

Abstract
An extreme phenotype sampling (EPS) model with targeted next-generation sequencing (NGS) identified genetic variants associated with tacrolimus (Tac) metabolism in subjects from the Deterioration of Kidney Allograft Function (DeKAF) Genomics cohort which included 1,442 European Americans (EA) and 345 African Americans (AA). This study included 48 subjects separated into 4 groups of 12 (AA high, AA low, EA high, EA low). Groups were selected by the extreme phenotype of dose-normalized Tac trough concentrations after adjusting for common genetic variants and clinical factors. NGS spanned >3 Mb of 28 genes and identified 18,661 genetic variants (3,961 previously unknown). A group of 125 deleterious variants, by SIFT analysis, were associated with Tac troughs in EAs (burden test, p=0.008), CYB5R2 was associated with Tac troughs in AAs (SKAT, p=0.00079). In CYB5R2, rs61733057 (increased allele frequency in AAs) was predicted to disrupt protein function by SIFT and PolyPhen2 analysis. The variants merit further validation.
Introduction
Tacrolimus (Tac), the primary immune suppressant used in >90% of solid organ transplants1, is a substrate of cytochrome P450 (CYP) enzymes CYP3A4 and CYP3A5. Tac has a narrow therapeutic window2 with blood concentrations (troughs) that are highly associated with efficacy3 and toxicity4. Tac troughs are routinely monitored to maintain a therapeutic range and guide dosing adjustments. Most African Americans (AAs) often have higher rates of Tac metabolism generally due to higher CYP3A5 expression. Consequently, AAs often require higher Tac doses than European Americans (EAs)5. High Tac clearance and low troughs in kidney transplant recipients during the first 90 days post-transplant is a risk factor for acute rejection6.
There is large interpatient variability7 in Tac metabolism which is partially due to genetic variants and clinical factors that alter clearance. Tac dosing equations including common genotypes for CYP3A single-nucleotide polymorphisms (SNPs) and clinical factors have been developed to personalize Tac dosing8, 9. However, dosing equations have not allowed for low-frequency variants (<5% frequency in population) because few studies have been sufficiently powered to identify them. Thus, further understanding the genetics of Tac disposition, especially the low-frequency variants, could be translated into more precise Tac dosing strategies.
Genetic variants impact Tac troughs10 by altering CYP3A4 and CYP3A5 enzyme expression, activity11, transcription factors, co-enzymes or transporters. Previously, with a diverse cohort of kidney allograft recipients and a custom SNP array, we found that 52.5% of Tac trough variation in subjects was explained by a set of common SNPs and clinical variables12. Upon further investigation of Tac troughs using a genome-wide association study (GWAS), three loss-of-function (LoF) genetic variants, CYP3A5*3 (rs776746), CYP3A5*6 (rs10264272) and CYP3A5*7 (rs41303343), in AAs were highly associated with Tac troughs7; these three genetic variants and clinical factors, accounted for 53.9% of the Tac trough variability in AAs. In a cohort of EAs, CYP3A5*3 andCYP3A4*22 (rs35599367) were significantly associated with Tac troughs13. A limitation of GWAS SNP arrays is that the genotypes are typically restricted to known common genetic variants requiring alternative methods to identify low-frequency, and unknown, variants associated with Tac disposition.
We hypothesized that Tac trough variation between subjects is, in part, due to low-frequency genetic variants which may not be present on a GWAS SNP array. To identify low-frequency genetic variants associated with Tac metabolism, we used an extreme phenotype sampling (EPS) model and next generation sequencing (NGS). The EPS model allows increased statistical power with fewer specimens for analysis14 and can account for known clinical factors and common genotypes7. Our EPS model investigated subjects with either the highest or lowest dose-normalized Tac troughs in our cohort. Because AAs often have different allele frequencies than EAs, we conducted a separate analysis for EAs and AAs. After selecting the subjects with extreme dose-normalized Tac troughs, and adjusting for clinical and common genetic variants, we used targeted NGS to identify low-frequency genetic variants. The variants may be useful for improving Tac dosing and understanding Tac trough variability.
Methods
Subjects and Tacrolimus Measurements
The 48 subjects identified for EPS and NGS were selected from 345 AAs and 1,443 EAs enrolled in our multi-center prospective, observational trial Deterioration of Kidney Allograft Function (DeKAF) Genomics (clinicaltrials.gov NCT00270712). The study was approved by the Institutional Review Board and informed consent was obtained from each subject prior to entering the study. Although race status was collected by self-reporting, principal components were used to select subjects for the EPS model. GWAS was previously conducted with all subjects. Subjects in the analysis were AA or EA kidney transplant recipients, ≥18 years who received Tac maintenance immunosuppression from 7 centers: University of Minnesota, Hennepin County Medical Center, University of Alabama, Mayo Clinic-Rochester, University of Iowa, University of Manitoba and University of Alberta. Recipient characteristics, clinical outcomes, Tac troughs and doses and concomitant medications were prospectively collected. Oral Tac was initiated around time of transplant using twice daily dosing. Doses were adjusted to achieve each institution’s target trough. Tac troughs were measured at each center approximately 12-hours following the last dose, at steady state with the current dose. Generally, troughs of 8-12 ng/mL were targeted for the first 3 months and 6-10 ng/mL for 3-6 months post-transplant. Median (range) of 18 (1-24) troughs were obtained for each subject in the first 6 months post-transplant. Tac trough whole blood measurements were clinically measured at each site and analyzed in CLIA approved laboratories with >95% measured by liquid chromatography-mass spectrometry.
Genotyping of Subjects
Before this study, genotyping on all subjects was performed on recipient DNA isolated from peripheral blood with the Affymetrix Transplant GWAS array that has been previously described15. The EPS model adjusted for common SNPs and principal components data from this array to assign race.
Selection of Subjects for Extreme Phenotype Sampling (EPS)
To select subjects with the extreme phenotype of Tac troughs, 48 kidney transplant recipients with the 12 highest and 12 lowest Tac troughs from the EA or AA cohorts, after accounting for clinical factors, known common genetic variants and enrolling transplant center, were selected for this study (Figure 1). To select these individuals, linear mixed-effects models (LMMs) were used to test for associations between natural log (ln)-transformed dose-normalized Tac troughs and the LoF genotypes CYP3A5 *3 (rs776746), CYP3A5 *6 (rs10264272) and CYP3A5 *7 (rs41303343) in AAs. For EAs, we adjusted for LoF genotypes CYP3A5*3 and CYP3A4*22 (rs35599367). Log transformation was used to ensure that the outcome was normally distributed. Our prior analyses found that dose-normalized troughs initially start low, rise quickly until day 9 after transplant and then plateau in the early weeks after transplant12, 16. Therefore, a simple spline method was used to model the effect of time on all trough concentrations, with the change in slope occurring at day 9. The longitudinal LMMs included a random intercept, random slopes for days after transplant, and days after post-transplant day 9. Confounding fixed clinical factors were retained in the EPS model and were selected by performing backward selection with retention p-value of 0.10. For EAs, we adjusted for factors: time post-transplant, transplant recipient age, weight, diabetes status, living vs. deceased donor, donor gender, and antibody induction type; and time-varying covariates included estimated glomerular filtration rate, steroid use, calcium channel blocker use, angiotensin-converting enzyme inhibitor use and antiviral use. For AAs, we adjusted for time post-transplant, transplant recipient age, simultaneous pancreas and kidney transplant (SPK), and antibody induction type and time-varying covariates glomerular filtration rate (GFR) and antiviral use. The multivariable models were used to determine residuals which were then used to identify the subjects with the extreme phenotypes of adjusted Tac troughs. Analyses were conducted with SAS version 9.2 software (SAS Institute, Cary, NC).
Figure 1: Extreme Phenotype Sampling (EPS) Model to Detect Genetic Variants Associated with Tacrolimus Metabolism from African American (AA) or European American (EA) Kidney Transplant Recipients.
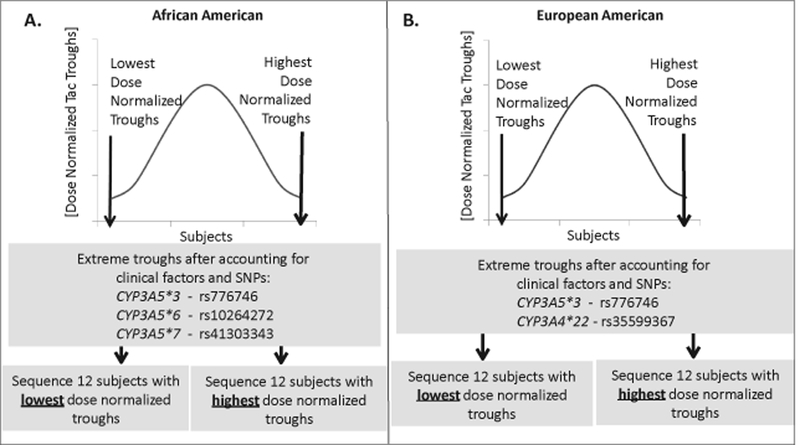
The graphs represent the mean dose-normalized Tac troughs on the y-axis and the distribution of subjects on the x-axis. The 12 recipients with highest or lowest Tac troughs, after adjusting for clinical variables and common genetic variants, from each group were selected for targeted next generation sequencing (NGS). A. The model used to select AA kidney transplant recipients was adjusted for genetic variants CYP3A5 *3, *6, and *7. The 12 AA subjects with the highest (3.5%) or 12 with the lowest (3.5%) Tac troughs were used for NGS from a cohort of 345 total subjects. B. The model used to select EA kidney transplant recipients was adjusted for genetic variants CYP3A5 *3 and CYP3A4 *22. The 12 EA subjects with the highest (0.8%) or 12 with the lowest (0.8%) dose-normalized Tac troughs were used for NGS from a cohort of 1,443 total subjects.
Targeted Next Generation Sequencing (NGS)
Hybridization-based capture was performed with 1 μg of genomic DNA with NimbleGen SeqCap EZchoice kit (Roche, NimbleGen). Sequencing spanning the entire length of 28 genes (Table 1) was performed and extended ~20,000 base pairs upstream and downstream of these genes. Thus, the extended sequencing length included 42 partial genes adjacent to the 28 genes for a total of 70 genes (Table 2) spanning 3,123,443 base pairs. These 28 genes were selected because they were hypothesized as associated with Tac disposition. We used a custom relaxed coverage probe design (Roche NimbleGen) allowing up to 20 close matches in the genome that increased the coverage across all regions. Standard SeqCap EZ gDNA libraries were developed and hybridized with the custom EZ choice probes following standard protocols. The captured libraries were multiplexed and sequenced using MiSeq V2 chemistry (2×150 bp).
Table 1:
Full Genes Sequenced in this Study
| Gene | Protein Name | Function and Relevant References Showing Association with Tac Disposition |
|---|---|---|
| CYP3A locus | Cytochrome P450 subfamily: CYP3A4, CYP3A5, CYP3A43, CYP3A7, CYP3A51P | Metabolism of Tac 55-58 |
| CYP2J2 | Cytochrome P450, subfamily 2J polypeptide 2 | P450 enzyme expressed in intestine, heart. Drug metabolism. Metabolizes arachidonic acid promoting kidney homeostasis, Tac has inhibitory effect nephrotoxicity 59, 60 |
| Co-enzymes | ||
| POR | cytochrome P450 oxidoreductase | P450 oxidoreductase and reduced cytochrome b5 supply electrons into the P450 cycle. Addition of cyt b5 stimulates CYP3A4 activity in vitro. Oxidoreductase responsible for electron transfer from NAD to CYP450, (POR*28 is associated with increased CYP3A activity and increase Tac clearance) 61-63 |
| CYB5A | Cytochrome B5, TypeA | Participant in the CYP450 cycle as an electron donor for cytochrome b5. Drug metabolism |
| CYB5R1 | NADH-Cytochrome B5 Reductase | Reduces cytochrome b5. Cytochrome b5 donates second electron in P450 cycle and enhances CYP3A activity. |
| CYB5R2 | NADH-Cytochrome B5 Reductase-2 | Bifunctional reductase that contains cytochrome b5 and reductase domains in same protein. Cytosolic enzyme. Unclear if it associated with P450. |
| CYB5R3 | Cytochrome B5 Reductase 3 | Participant in CYP450 cycle as electron donor for cytochrome b5. Drug metabolism 64, Present in endoplasmic reticulum membrane |
| CYB5R4 | NADH-Cytochrome B5 Reductase-4 | Reduces cytochrome b5. Cytochrome b5 supplies second electron in P450 cycle and stimulates CYP3A activity. |
| CYB5RL | NADH-Cytochrome B5 Reductase-Like | Reduces cytochrome b5 |
| CYB5D1 | Cytochrome B5 Domain-Containing Protein-1 | Serves as an electron donor for cytochrome b5 and thus participates in CYP450 cycle. Thus, play a role in drug metabolism |
| Transporters | ||
| ABCB1 | ATP-Binding Cassette, Subfamily B, member 1 | Efflux transporter known as Multi Drug Resistance1 or P-glycoprotein. Tac is a substrate. Actively transports Tac into the intestinal lumen as a counter-transport pump 65-67 |
| ABCC1 | ATP-Binding Cassette, subfamily C, member 1 | Efflux transporter. Also known as Multidrug resistance associated protein 1 (MRP1). Findings suggest that MDR1 polymorphisms has effect on Tac pharmacodynamics 68-70 |
| ABCC2 | ATP-Binding Cassette, subfamily C, member 2 | Efflux transporter also known as Multidrug resistance associated protein 2 (MRP2) 71. |
| ABCG2 | ATP-Binding Cassette, Subfamily G, member 2 | Efflux transporter, also named Breast Cancer Resistance Protein. Tac is a inhibitor, variants in ABC transporter gene may also associate with Tac pharmacokinetics 67 |
| ABCE1 | ATP-Binding Cassette, Subfamily E, member 1 | Efflux transporter also known as ribonuclease 4 inhibitor |
| SLCO1B3 | Solute Carrier Organic anion transporter family, member 1B3 | Uptake transporter for organic anions. Also known as OATP1B3. |
| Transcription Factors | ||
| VDR | Vitamin D Receptor | Ligand activated transcription factors) that control gene expression). Highly expressed in intestine, but not in liver. Affects intestinal expression of CYP3A 72 |
| NR3C1(GR) | Nuclear Receptor Subfamily 3, group Member 1 | Glucocorticoid Receptor. Glucocorticoid-activated transcription factor that controls gene expression (several drug metabolizing genes contain GR response elements) 73 |
| NR1I2(PXR) | Nuclear Receptor Subfamily 1, group 1, Member 2 | Pregnane X Receptor. Ligand activated transcription factors) that control gene expression Regulates expression of drug metabolizing enzymes and drug transporters in liver 62, 74, 75 |
| NR1I3(CAR) | Nuclear Receptor Subfamily 1, group 1, Member 3 | Constitutive Androstane Receptor. Ligand-activated transcription factors) that control gene expression. Alters expression of CYP3A genes. Key regulator of drug metabolizing enzymes and drug transporters 76 |
| HNF4A | Hepatocyte Nuclear Factor-4-α | Transcription factor for hepatic gene expression regulation, Regulates PXR and CAR expression and CYP3A expression77 |
| CEBPA | C/EBP-Alpha | Co-factor (activator) for gene regulation. Especially transporters ABBC2 and ABCB1 78, 79 |
| CEBPB | CCAAT/Enhancer Binding Protein, Beta | Co-factor (activator) for gene regulation. Especially transporters ABBC2 and ABCB1 |
| PPARA | Peroxisome Proliferator-Activator Receptor Alpha | Has regulatory effect on CYP3A4 expression 62, 80, 81 |
| FOXA2 | Forkhead Box protein A2 | Transcription factor also named HNF3-β, has effect on hepatic CYP3A4 expression82 |
| NCOR1 | Nuclear Receptor Corepressor 1 | Co-factor (repressor) for gene regulation. Associated with transporters ABBC2 and ABCB1 |
| YY1 | Transcriptional Repressor Protein | Downregulates Cytochrome c Oxidase and CYP3A4 and CYP3A5 |
Note: Each gene was sequenced 20 kilobases upstream and downstream of the gene.
Table 2: List of all 70 genes used in the gene based statistical test.
Since we sequenced 20 kb upstream and downstream, and spanning the entire length of 28 genes in Table 1, this led to partial sequencing of 42 genes adjacent to these 28 genes and thus 70 total genes.
| ABCB1 | CYB5D2 | LOC401980 | PPFIBP2 |
| ABCC1 | CYB5R1 | LSMD1 | R3HDML |
| ABCC2 | CYB5R2 | MAATS1 | RIPPLY2 |
| ABCC6 | CYB5R3 | MRPL37 | RNU12 |
| ABCE1 | CYB5R4 | NCOR1 | RUNDC3B |
| ABCG2 | CYB5RL | NDUFS2 | SLC25A29 |
| ADIPOR1 | CYP2J2 | NR1I2 | SLCO1B3 |
| ANAPC10 | CYP3A4 | NR1I3 | STYXL1 |
| ANKFY1 | CYP3A43 | NR3C1 | TMEM120A |
| APOA2 | CYP3A5 | OR2AE1 | TMEM88 |
| CDCP2 | CYP3A7-CYP3AP1 | OTUD4 | TOMM40L |
| CDPF1 | FCER1G | OVCH2 | TTC19 |
| CEBPA | FOXA2 | PIGL | VDR |
| CEBPA-AS1 | GSK3B | PKD2 | YY1 |
| CEBPB | HNF4A | PKDREJ | ZSCAN25 |
| CHD3 | HOOK1 | POLDIP3 | ZZEF1 |
| YB5A | KDM6B | POR | |
| CYB5D1 | LINC00261 | PPARA |
Bioinformatics Analysis of NGS Data
The raw Illumina sequences were evaluated for quality with FASTQC17. Sequenced reads were aligned to University of California Santa Cruz’s human reference genome (GRCH 37/hg 19) with a Burroughs-Wheeler Aligner18. Depending on the reporting group19, 20, recommended sequence depth is at least 10X-30X; we targeted >20X depth for making variant calls. Genome Analysis Toolkit’s (GATK) best practices21-26 pipeline was used to identify and call variants27. The final list of variants obtained were annotated with the snpEff tool28 and the Ensembl Variant Effect Predictor (VEP)29. Variants were evaluated in silico by Sorting Intolerant from Tolerant (SIFT)30, 31 and Polymorphism Phenotyping Tool 2 (PolyPhen2)32-34 to assess potential impact on protein.
Statistical Analysis of Extreme Phenotype Individuals
A logistic regression model was applied, as cases and controls were identified as low versus high dose-normalized Tac trough subjects respectively, in either AA or EA groups. Due to small sample size, tests for association were performed by permutation testing and p-values were calculated. A continuous trait test was performed by regressing the dose-normalized Tac troughs on the genetic variants accounting for the selection procedure. Thus, two types of analyses were performed: A) Association tests for each of the single genetic variants with both EA and AA groups to determine SNPs associated with Tac metabolism in each group. B) Gene based test on 70 genes (Table 2) with burden test (BT) (linear sum of variant scores test), sequence kernel association test (SKAT) (sum of squared variant based test), and an optimal combination of BT and SKAT (SKATO)35. P-values were further Bonferroni corrected with significance level of 0.0007 for the gene-based test. Focused-SNP set analyses, with each subject group, were performed on SIFT and PolyPhen2 selected variants which were predicted to impact protein function.
Manual Curation of Genetic Variants to Identify Genetic Variants
We manually inspected variants identified by GATK analysis in the Tac related genes CYP3A4, CYP3A5, POR and CYB5A for previously unidentified genetic variants in the 5’-untranslated regions (UTR), exons and 3’-UTR regions of these genes in our EPS model cohorts.
Results
Subject characteristics are described in Table 3. The EPS model in Figure 2 shows the natural-log of dose-normalized Tac troughs from the groups over the first 6-months post-transplant. As expected, the EA high group had the highest dose-normalized Tac troughs over time. The AA high group had the next highest Tac troughs, third was the EA low group and the AA low group had lowest Tac troughs. The subjects with 2 known LoFs could have any combination of CYP3A5 *3, *6, *7 or CYP3A4 *22 alleles. After adjusting for CYP3A5 *3, *6, and *7 in the AA high group 6 subjects had 2 known LoFs, while the AA low group had 1 subject with 2 known LoFs (Table 3). After adjusting for CYP3A5 *3 and CYP3A4 *22 alleles, the EA high group had 11 subjects with 2 known LoFs and the EA low group had 10 subjects with 2 known LoFs. Since the EPS model adjusted for common LoF genetic variants, these groups may have complex genetics associated with Tac disposition.
Table 3: Clinical and Genetic Characteristics of the Extreme Phenotype Subjects in African American (AA) and European American (EA) Groups.
The High groups had the highest dose-normalized Tac troughs, while the Low groups had the lowest dose normalized Tac troughs. AA cohort N=345 and EA cohort N=1443.
| Variable | Dose-Normalized Tac Trough Groups | ||||
|---|---|---|---|---|---|
| AAHigh | AA Low | EA High | EA Low | ||
| N | 12 | 12 | 12 | 12 | |
| Age | 18-34 | 2 | 2 | 1 | 0 |
| 35-64 | 9 | 10 | 8 | 10 | |
| 65-84 | 1 | 0 | 3 | 2 | |
| Diabetes | yes | 6 | 9 | 9 | 7 |
| no | 6 | 3 | 3 | 5 | |
| Donor Status | Living | 2 | 8 | 11 | 7 |
| Deceased | 10 | 4 | 1 | 5 | |
| Donor Gender | Male | 7 | 4 | 7 | 10 |
| Female | 5 | 8 | 5 | 2 | |
| Number of subjects with CYP3A5*3 Allelesrs776746_G | 0 | 5 | 4 | 0 | 0 |
| 1 | 6 | 7 | 1 | 2 | |
| 2 | 1 | 1 | 11 | 10 | |
| Number of subjects with CYP3A5*6 Allelesrs10264272_T | 0 | 10 | 10 | 12 | 12 |
| 1 | 1 | 2 | 0 | 0 | |
| 2 | 1 | 0 | 0 | 0 | |
| Number of subjects with CYP3A5*7 Allelesrs41303343_TA | 0 | 8 | 11 | 12 | 12 |
| 1 | 3 | 1 | 0 | 0 | |
| 2 | 1 | 0 | 0 | 0 | |
| Number of subjects with CYP3A4*22 Allelesrs35599367_A | 0 | 11 | 12 | 10 | 11 |
| 1 | 1 | 0 | 2 | 1 | |
| 2 | 0 | 0 | 0 | 0 | |
| Number of subjects with known CYP3A Loss of Function Alleles (CYP3A5*3,*6,*7 or CYP3A4*22) | 0 | 2 | 1 | 0 | 0 |
| 1 | 4 | 10 | 1 | 2 | |
| 2 | 6 | 1 | 11 | 10 | |
| Estimated GlomerularFiltration Rate*(mL/min) | < 54.9 | 19.9% | 9.1% | 19.0% | 31.6% |
| 54.9-67.9 | 11.7% | 45.7% | 28.8% | 27.0% | |
| 67.9-83.5 | 24.5% | 17.8% | 22.3% | 20.9% | |
| >83.5 | 43.9% | 27.4% | 29.9% | 20.5% | |
| Weight (kg)* | < 69.4 | 26.5% | 4.6% | 56.5% | 20.5% |
| 69.4-80.9 | 20.9% | 12.8% | 28.3% | 49.3% | |
| 80.9-94.6 | 32.7% | 21.0% | 12.0% | 0.9% | |
| >94.6 | 19.9% | 61.6% | 3.3% | 29.3% | |
| Steroid Use in First 6 Months | Yes | 11 | 11 | 12 | 12 |
| No | 1 | 1 | 0 | 0 | |
| Simultaneous Pancreas andKidney Transplant | Yes | 1 | 0 | 0 | 1 |
| No | 11 | 12 | 12 | 11 | |
| Antibody Induction | Monoclonal | 8 | 5 | 5 | 3 |
| Polyclonal | 4 | 7 | 7 | 8 | |
| Calcium ChannelBlocker in First 6 Months | Yes | 8 | 9 | 5 | 9 |
| No | 4 | 3 | 7 | 3 | |
| ACE Inhibitor in First 6 Months | Yes | 4 | 4 | 5 | 2 |
| No | 8 | 8 | 7 | 10 | |
| Antiviral Use in First 6 Months | Yes | 12 | 9 | 12 | 11 |
| No | 0 | 3 | 0 | 1 | |
| Tac Daily Dose (mg)Median (range) | 4.0(0.5 - 12.0) | 14.0(1.0 - 36.0) | 1.0(0.1 - 6.0) | 14.0(2.0 - 36.0) | |
| Tac Trough Concentration (ng/mL)Median (range)** | 7.5(1.0 - 21) | 5.1(1.0 -18) | 8.9(2.4 - 26) | 8.1(1.3 - 29) | |
| Dose Normalized Tac Trough Concentration (ng/mL)Median (range) | 2.4(0.3-31) | 0.38(.083-1.4) | 7.7(1.0-82) | 0.57(0.13-4.8) | |
Estimated Glomerular Filtration Rate and Weight are for time point closest to the corresponding Tac trough measurement
Tac troughs, and dose normalized Tac troughs, were measured periodically for each subject, up to 24 times per subject.
Figure 2: Dose Normalized Tac Troughs of Subjects from Extreme Phenotype Sampling (EPS) Model used for Next Generation Sequencing (NGS).
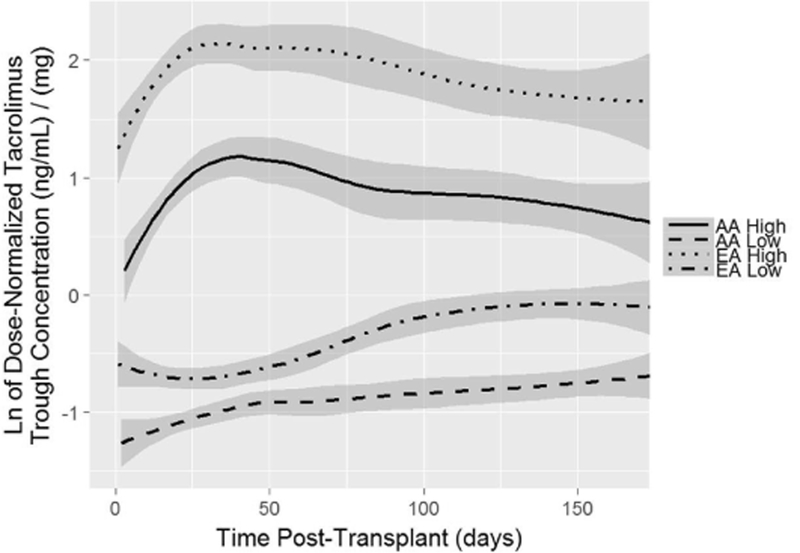
The figure shows natural log transformed Tac dose-normalized troughs over time, in high and low AA or EA Tac groups. Data lines represent smoothed conditional means and gray areas represent 95% confidence intervals. The 12 EA subjects with the highest (0.8%) or 12 with the lowest (0.8%) Tac troughs were used for NGS from a cohort of 1,443 total subjects. The 12 EA subjects with the highest (3.5%) or 12 with the lowest (3.5%) Tac troughs were used for NGS from a cohort of 345 total subjects after adjustment for known genotypes and clinical factors.
Data Availability
Raw sequence data, in fastq format, are available at the United States National Center for Biotechnology Information’s (NCBI) Sequence Read Archive (SRA) with SRA accession number: SRP156752. The associated phenotype and covariate data are available at NCBI’s Database for Genotypes and Phenotypes with dbGaP accession number: phs001670.v1.p1.
Variants Identified from Sequencing
The estimated coverage of NimbleGen sequencing was 86.6% of the total bases across the entire genetic distance of 28 genes. The remaining 13.4% were not covered because of the repetitive nature of the genomic regions. The sequencing depth was 60X across these 28 genes and 42 adjacent partial genes after mapping and quality control filtering of the sequences. The sequencing of the 42 partial genes did not span the entire length of those genes. A total of 18,661 variants in 48 extreme phenotype subjects were identified and processed for quality. With the Variant Effect Predictor (VEP) tool 29, out of the 18,661 total variants identified, 3,961 variants (21.2%) were unknown and 14,700 (78.8%) were previously identified. The VEP analysis of these variants, and the coding variants, based on their predicted consequences are described in Figure 3. Although many of the genetic variants had unspecified significance, we identified 15,948 variants in the AA cohort and 11,074 variants in the EA cohort that were different (alternative allele) than the reference genome GRCH 37/hg 19.
Figure 3: Variant Effect Predictor (VEP) results based on genetic variants identified.
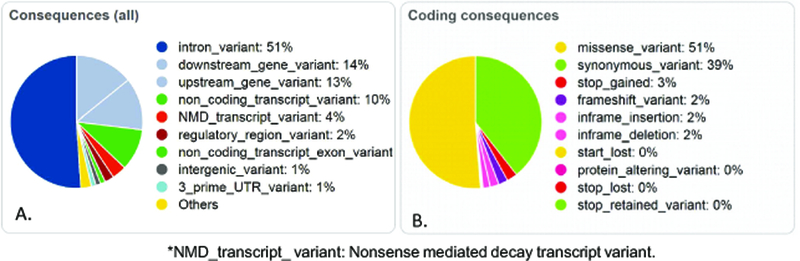
A. Predicted consequences of the 18,661 genetic variants identified in this sequencing study. B. Predicted gene expression consequences from coding sequences in the VEP analysis.
Statistical Association of Variants Identified through Sequencing with Tac Troughs
The association testing identified 397 and 297 variants that were associated with dose-normalized Tac troughs in AA and EA, respectively, with p<0.05 by either case-control or continuous trait tests. However, 15 (Table 4) and 9 (Table 5) variants in AA or EA, respectively had a p<0.005. Variants identified in the EA cohort with p<0.005 were in ABCC1, ANAPC10, NR3C1 and OTUD4. Variants identified in the AA cohort with p<0.005 were in ADIPOR1, CYB5R2, OVCH2 and POR.
Table 4: Single Variants Associated with Dose- Normalized Tacrolimus Troughs, identified in African American Kidney Transplant Recipients (p<0.005).
The table indicates the chromosome location of the variants based on GRCH37 assembly, the variant alternate allele, the consequence effect of the variant on the Ensembl transcripts, the gene symbol, the exon number out of the total number of exon in that gene, the intron number out of the total number in that gene, Existing known variants’ rs number if available and the allele frequencies from 1000 Genomes project as given by VEP software. AF = global, AFR = African population, AMR = American population, EUR = European population, EAS = East Asian population, SAS = South Asian population, AA = Allele Frequency from in African American population from Lung and Blood Institute-Exome Sequencing Project (NHLBI-ESP), EA = Allele Frequency in European American population from NHLBI-ESP. Also shown are the related test p-values for association with Tac troughs.
| Location | Allele | Consequence | Symbol | Exon | Intron | Existing_variation | Allele frequencies | Pvalb1 | Pvalc2 | |||||||
|---|---|---|---|---|---|---|---|---|---|---|---|---|---|---|---|---|
| AF | AFR | AMR | EAS | EUR | SAS | AA | EA | |||||||||
| 7:75552252-75552252 | A | intron_variant | POR | - | 1/14 | - | - | - | - | - | - | - | - | - | 0.001 | 0.002 |
| 7:75558027-75558037 | C | intron_variant | POR | - | 1/14 | rs66811056 | - | - | - | - | - | - | - | - | 0.001 | 0.002 |
| 7:75573951-75573956 | GTGTTTGTT | intron_variant | POR | - | 1/14 | rs67675959 | 0.26 | 0.52 | 0.24 | 0.25 | 0.09 | 0.10 | - | - | 0.001 | 0.002 |
| 7:75576956-75576956 | T | intron_variant | POR | - | 1/14 | rs239955 | 0.26 | 0.52 | 0.24 | 0.25 | 0.09 | 0.10 | - | - | 0.001 | 0.002 |
| 7:75565740-75565740 | A | intron_variant | POR | - | 1/14 | rs239960 | 0.25 | 0.49 | 0.24 | 0.25 | 0.09 | 0.10 | - | - | 0.002 | 0.003 |
| 11:7710178-7710178 | T | downstream_gene_variant | OVCH2 | - | - | rs4501973 | 0.46 | 0.18 | 0.57 | 0.58 | 0.61 | 0.49 | - | - | 0.002 | 0.001 |
| 11:7711872-7711872 | C | downstream_gene_variant | OVCH2 | - | - | rs10839842 | 0.47 | 0.18 | 0.57 | 0.59 | 0.62 | 0.50 | - | - | 0.002 | 0.001 |
| 11:7712471-7712471 | T | stop_gained | OVCH2 | 15/15 | - | rs4509745 | 0.48 | 0.23 | 0.58 | 0.59 | 0.62 | 0.49 | 0.31 | 0.62 | 0.002 | 0.001 |
| 1:202931839-202931839 | A | upstream_gene_variant | ADIPOR1 | - | - | rs2232854 | 0.31 | 0.18 | 0.40 | 0.43 | 0.35 | 0.28 | 0.23 | 0.34 | 0.002 | 0.002 |
| 7:75544455-75544455 | C | upstream_gene_variant | POR | - | - | rs3823884 | 0.48 | 0.94 | 0.42 | 0.27 | 0.27 | 0.35 | - | - | 0.002 | 0.004 |
| 11:7687305-7687305 | T | intron_variant | CYB5R2 | - | 8/8 | rs12794507 | 0.26 | 0.44 | 0.18 | 0.14 | 0.25 | 0.22 | - | - | 0.003 | 0.001 |
| 7:75586536-75586536 | C | intron_variant | POR | - | 2/14 | rs4728533 | 0.73 | 0.48 | 0.76 | 0.74 | 0.91 | 0.84 | - | - | 0.003 | 0.003 |
| 7:75563682-75563682 | G | intron_variant | POR | - | 1/14 | rs12533235 | 0.26 | 0.52 | 0.24 | 0.25 | 0.09 | 0.10 | - | - | 0.003 | 0.004 |
| 11:7687517-7687517 | C | intron_variant | CYB5R2 | - | 8/8 | rs11041523 | 0.49 | 0.30 | 0.49 | 0.68 | 0.51 | 0.53 | - | - | 0.004 | 0.004 |
| 11:7686602-7686606 | TGTTTGTT | stop_retained_variant,3_prime_UTR_variant | CYB5R2 | 9/9 | - | rs536512597,rs16411 | 0.47 | 0.26 | 0.49 | 0.64 | 0.51 | 0.53 | 0.28 | 0.51 | 0.004 | 0.004 |
-Tac troughs were adjusted in the extreme phenotype model for clinical variables and genotypes CYP3A5*3, CYP3A5*6, and CYP3A5*7.
Pvalb: Logistic regression with permutation applied to calculate p-value in the case-control trait test.
Pvalc: Linear regression applied to obtain p-values in the continuous trait test
Table 5: Single Variants Associated with Tacrolimus Adjusted Troughs, Identified in European American Kidney Transplant Recipients of (p<0.005).
The table indicates the chromosome location of the variants based on GRCH37 assembly, the variant alternate allele, the consequence effect of the variant on the Ensembl transcripts, the gene symbol, the intron number out of the total number in the gene, Existing known variants’ rs numbers if available and the allele frequencies from 1000 Genomes project as given by VEP software. AF = global, AFR = African population, AMR = American population, EUR = European population, EAS = East Asian population, SAS = South Asian population. Also shown are the related test p-values for association with Tac troughs.
| Location | Allele | Consequence | Symbol | Intron | Existing_variation | Allele frequencies | Pvalb1 | Pvalc2 | |||||
|---|---|---|---|---|---|---|---|---|---|---|---|---|---|
| AF | AFR | AMR | EAS | EUR | SAS | ||||||||
| 4:146068652-146068652 | T | intron_variant | OTUD4 | 13/20 | rs12502109 | 0.31 | 0.37 | 0.31 | 0.47 | 0.13 | 0.26 | 0.001 | 0.002 |
| 20:43074372-43074372 | C | downstream_gene_variant | 14kb 3’ of HNF4A | - | rs1321826 | 0.16 | 0.32 | 0.16 | 0.03 | 0.11 | 0.15 | 0.002 | 0.004 |
| 20:43075161-43075161 | A | downstream_gene_variant | 14kb 3’ of HNF4A | - | rs7272694 | 0.16 | 0.32 | 0.16 | 0.03 | 0.11 | 0.15 | 0.002 | 0.004 |
| 20:43075280-43075280 | C | downstream_gene_variant | 15kb 3’ of HNF4A | - | rs7267639 | 0.16 | 0.32 | 0.16 | 0.03 | 0.11 | 0.15 | 0.002 | 0.004 |
| 5:142803548-142803548 | G | intron_variant | NR3C1 | 1/8 | rs72802815 | 0.25 | 0.23 | 0.42 | 0.10 | 0.34 | 0.23 | 0.005 | 0.004 |
| 16:16203559-16203559 | T | intron_variant | ABCC1 | 21/29 | rs35090860 | 0.21 | 0.06 | 0.14 | 0.40 | 0.21 | 0.25 | 0.005 | 0.003 |
| 16:16208172-16208172 | T | intron_variant | ABCC1 | 22/29 | rs45443999 | 0.20 | 0.04 | 0.14 | 0.40 | 0.19 | 0.25 | 0.005 | 0.003 |
| 16:16208173-16208173 | C | intron_variant | ABCC1 | 22/29 | rs45624535 | 0.20 | 0.04 | 0.14 | 0.40 | 0.19 | 0.25 | 0.005 | 0.003 |
| 4:146001613-146001613 | T | intron_variant | ANAPC10 | 3/4 | rs35098431 | 0.35 | 0.51 | 0.32 | 0.47 | 0.13 | 0.26 | 0.005 | 0.004 |
-Tac troughs were adjusted in the extreme phenotype model for clinical variables and genotypes CYP3A5*3 and CYP3A4*22.
Pvalb: Logistic regression with permutation applied to calculate p-value in the case-control trait test.
Pvalc: Linear regression applied to obtain p-values in the continuous trait test
SIFT and PolyPhen2 analysis of identified genetic variants
SIFT30, 31 analysis was conducted on all the genetic variants identified in the 48 subjects. Of the 18,661 identified genetic variants, 125 were determined to be deleterious, 22 were deleterious-low confidence while the remaining variants were tolerated.
PolyPhen232-34 analysis was also performed on genetic variants. Of the 18,661 genetic variants, 110 were determined to be probably damaging, 63 of the variants were determined to be possibly damaging and the remaining variants were benign.
Figure 4 shows a Venn diagram of the SIFT and PolyPhen2 results of variants predicted to impact protein function. We discovered 69 genetic variants classified as both deleterious by SIFT and probably damaging by PolyPhen2. These 69 genetic variants (Supplemental Table 1) have the highest likelihood of affecting protein function and thus may also affect Tac disposition.
Figure 4: SIFT and PolyPhen2 Results of all 18,661 variants in a Venn diagram.
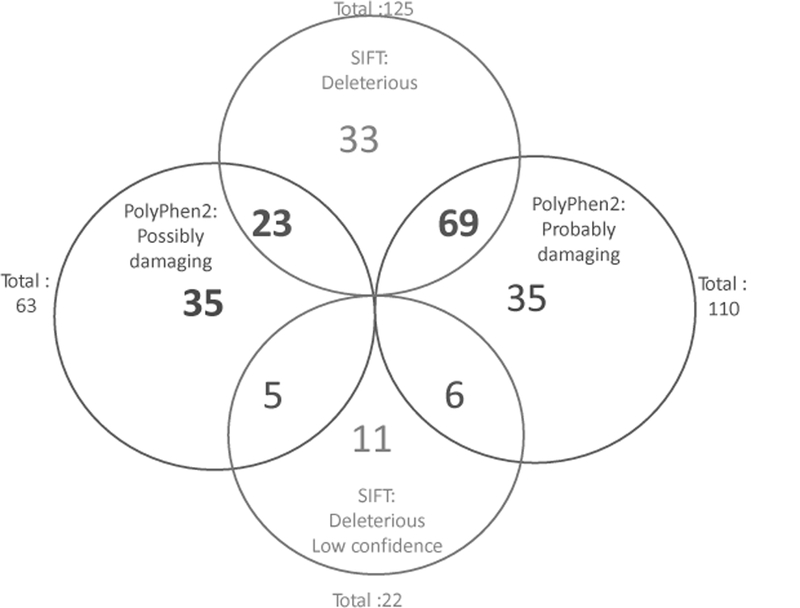
SIFT and PolyPhen2 are bioinformatics analytic tools that predict the affect specific genetic variants may have on protein function. Of the 18,661 variants, 125 were deleterious and 22 were deleterious with low confidence by SIFT while the remaining variants were tolerated. Polyphen2 analysis found 110 of the variants were probably damaging, 63 were possibly damaging while the remaining variants were benign to impacting protein.
SKAT Gene Based Test Identified CYP5R2 Association with Tac Disposition in African American Cohort
By using SKAT36-39 to test the gene-level association with the continuous trait of dose-normalized Tac troughs, the most significant gene associated with Tac troughs in AA subjects was CYB5R2 by SKAT after Bonferroni correction (p=7.9×10⁻⁴). CYB5R2 was also significant by SKAT by case-control test (p=8.5×10⁻⁴). None of the genes were significantly associated with the EA cohort. Of the 525 variants identified in CYB5R2 (including upstream and downstream), 4 of these variants were found within the CYB5R2 gene that were predicted to functionally impact protein function according to SIFT or PolyPhen2 (Table 6). The genetic variant identified in CYB5R2 most likely to disrupt protein function was rs61733057 (Leu163Trp) because it is predicted as deleterious by SIFT and probably damaging by PolyPhen2. As seen in Table 6, the missense A to C variant rs61733057, in CYB5R2, has a global allele frequency of 0.05, but has increased allele frequency in both Africans (0.106) and AAs (0.119) compared with EAs (0.048). Likewise, rs61733056 is more frequent in AAs. CYB5R2 is a possible co-enzyme that may supply reducing equivalents to P450, although it is generally thought that CYB5R3 functions by supplying the second electron into the P450 cycle.
Table 6: Genetic Variants in the CYB5R2 Gene Associated with Dose Normalized Tacrolimus Troughs in African American Kidney Transplant Recipients.
The table indicates the location of the variants in the CYB5R2 gene, consequences, the codon changes, rs numbers and predicted protein effect from SIFT and PolyPhen2 analysis (with prediction scores), chromosome location of the variants based on GRCH37 assembly, the variant allele used to calculate the consequence, the consequence effect of the variant on the Ensembl transcripts, the Exon number out of the total number, Existing known variant rs numbers. Also shown are the allele frequencies from 1000 Genomes project as given by VEP software. AF = global, AFR = African population, AMR = American population, EUR = European population, EAS = East Asian population, SAS = South Asian population, AA = Allele Frequency from in African American population from Lung and Blood Institute-Exome Sequencing Project (NHLBI-ESP), EA = Allele Frequency in European American population from NHLBI-ESP.
| Location | Allele | Consequence | Exon | Existing_variation | SIFT | PolyPhen2 | Allele Frequencies | |||||||
|---|---|---|---|---|---|---|---|---|---|---|---|---|---|---|
| AF | AFR | AMR | EAS | EUR | SAS | AA | EA | |||||||
| 11:7687146-7687146 | A | missense_variant | 9/9 | rs67173996 | deleterious(0.03) | Benign (0.019) | 0.161 | 0.035 | 0.052 | 0.504 | 0.128 | 0.089 | - | - |
| 11:7687715-7687715 | C | missense_variant | 8/9 | rs12801394 | deleterious(0.03) | Benign (0) | - | 0.853 | 0.679 | 0.817 | 0.763 | 0.766 | 0.852 | 0.771 |
| 11:7689029-7689029 | C | missense_variant | 7/9 | rs61733057 | deleterious(0) | probably_damaging (0.947) | 0.050 | 0.106 | 0.043 | 0.002 | 0.060 | 0.016 | 0.119 | 0.048 |
| 11:7690873-7690873 | T | missense_variant | 4/9 | rs61733056 | Tolerated (0.08) | possibly_ damaging (0.875) | 0.075 | 0.213 | 0.035 | 0.014 | 0.004 | 0.053 | 0.192 | 0.003 |
Focused SNP-set Analysis for Association in the EA and AA Cohorts
Genetic variants were further analyzed to detect association with dose-normalized Tac troughs within the AA or EA cohorts. The SNPs analyzed by SIFT and Polyphen2, with predicted impact on protein function, were grouped into 4 categories: 1.) Polyphen2: probably damaging (N=110) (Supplemental Table 2) 2.) PolyPhen2: possibly damaging (N=63) (Supplemental Table 3) 3.) SIFT: deleterious (N=125) (Supplemental Table 4) 4.) SIFT: deleterious-low confidence (N=22) (Supplemental Table 5). These 4 categories of variants were tested by BT, SKAT, and SKATO for association with the EA and AA cohorts, separately. The group of 125 predicted deleterious variants (Supplemental Table 4) from SIFT had significant association with the EA cohort (BT, p=0.008) by case-control test.
Variants Observed During Manual Inspection of Variants
We examined SNPs in CYP3A4, CYP3A5, POR and CYB5A genes. We found several SNPs in the 5’-UTR of CYP3A4 and CYP3A5 that could affect protein expression. Surprisingly, we identified synonymous and non-synonymous SNPs with no reported rs numbers in dbSNP database in POR. In contrast, only a single previously unreported non-synonymous variant, His44Asn in exon 2 was identified in CYB5A, along with 16 previously unreported SNPs in the first 2,300bp upstream in the 5’-UTR. These variants are shown in Supplemental Table 6 (CYP3A4), Supplemental Table 7 (CYP3A5), Supplemental Table 8 (POR) and Supplemental Table 9 (CYB5A).
Discussion
This study showed that an EPS model and NGS identified 18,661 genetic variants associated with Tac disposition in 48 extreme phenotype subjects. VEP analysis determined 3,961 variants (21.2%) were unknown and 14,700 (78.8%) were previously known. We found 125 genetic variants that were predicted as deleterious of protein function by SIFT analysis and were significantly associated with Tac disposition in the EA group (BT, p=0.008). We further found 110 genetic variants that were probably damaging to protein function by PolyPhen2. Of these variants, 69 were also deleterious according to SIFT analysis and would represent the genetic variants most likely to affect protein function, and thus Tac disposition. For our studies, individual variant analysis lacks power due to small sample size with very limited number of genotype counts. Though some individual variants in a gene have weak signals, combining them can lead to a significant result as done in SKAT. Thus, a major finding was the significant association of CYB5R2 with Tac troughs in AAs by SKAT analysis. The genetic variant, rs61733057, in the CYB5R2 gene, was identified and predicted to be deleterious by SIFT and probably damaging by PolyPhen2. Thus, we have identified variants associated with Tac troughs in kidney transplant recipients that require future in vitro assessment or validation in another cohort.
At the time of this study, it was not feasible to determine low-frequency variants, by sequencing all subjects because that required NGS of thousands of subjects. Therefore, we used an EPS approach that was successful to identify low-frequency variants in other diseases40,41,42,43,44,45. Previous research suggests sampling from both high and low extremes is important to identify variants associated with a particular phenotype45. This EPS approach allows for smaller sample sizes to identify low-frequency genetic variants associated with a phenotype14. Thus, our study corroborates other studies showing that the EPS approach can identify genetic variants, or genes, which are associated with a phenotype. This EPS approach can save time and money by sampling fewer subjects.
Genetic Variants associated with Tac metabolism were identified and shown in Table 4 (AA) and Table 5 (EA). Table 4 shows single genetic variants associated with Tac metabolism in AAs. Many of these variants were in POR which encodes for a coenzyme involved in cytochrome P450 metabolism. The variants in OVCH2 are upstream, and likely in the promotor, of CYB5R2. A single variant found in ADIPOR1, was likely identified since it is downstream of the gene CYB5R1. Additionally, Table 5 has genetic variants associated with Tac metabolism in EAs. The variants identified were in the genes OTUD4, NR3C1, ABCC1, upstream of HNF4A and ANAPC10. The variant in ANAPC10 was also located in the 5’-UTR of ABCE1 gene. The OTUD4 variants are located in the 3’-UTR of ABCE1. ABCE1 is an ATP-binding cassette protein but lacks the transmembrane domain needed for transporter function. ABCE1 functions as a ribonuclease L inhibitor where it associates with the ribosome and initiation factors elF3 and elF5. We speculate that this would lead to less mRNA transcription, and reduce protein expression but that may be non-specific for CYP3A4 and CYP3A5. The variant found in the glucocorticoid receptor NR3C1, a transcription factor that can influence the expression of PXR, which in turn regulates CYP3A4 and CYP3A5. The other variant found in AAs was in the ABCC1 gene which may be involved in Tac transport. In general, functional assays will be needed to validate the association of these variants with Tac metabolism.
Table 6 shows 4 variants found in CYB5R2 and indicates CYB5R2 to be associated with Tac metabolism in AAs. CYB5R2 has not previously been associated with Tac troughs, disposition or metabolism, but was unexpectedly identified in AAs with extreme Tac troughs. CYB5R2, (in chromosome 11), differs from its homolog CYB5R3 (in chromosome 22), but share high sequence identity and there is limited literature regarding CYB5R2. Both CYB5R2 and CYB5R3 can reduce cytochrome b5 and act as co-factors for cytochrome P450 function (supply electrons into the P450 cycle). While CYB5R2 is located in the nucleus, CYB5R3 is present in the endoplasmic reticulum in liver. CYB5R3 exists in two forms as a membrane-bound variant in membranes including in erythrocytes where low activity variants have been associated with methemoglobinemia and a truncated soluble cytoplasmic form containing the FAD catalytic domain. CYB5R2 has been identified as a tumor suppressor that is epigenetically regulated46. CYB5R2 negatively regulates vascular endothelial growth factor47 which could contribute to its tumor suppressor activity. Furthermore, CYB5R2 is epigenetically regulated through promoter methylation48, associated with patient survival of glioblastoma, and functions in collagen maturation, immunoregulation via toll-like receptor pathways, and osmotic stress49. The CYB5R2 variant, rs61733057, that likely impacts CYB5R2 protein function, was identified. It has elevated frequency in the AAs compared with EAs. According to 1000 genomes database (Table 6), the identified variants associated with Tac troughs in AAs rs61733057 and rs61733056 are primarily in people of African descent, which would corroborate our finding of this variant in AAs. However, with limited CYB5R2 literature it is difficult to determine its function in Tac disposition.
This study identified genetic variants in CYP3A4, CYP3A5, POR and CYB5A. Although many of these variants (Supplemental Tables 6-9) did not show significant association with Tac troughs in our analysis, numerous naturally occurring genetic variants were identified that have not been reported. Many of these variants were in the 5’ and 3’-UTR regions of CYP3A4 and CYP3A5. We identified 1 exonic SNP in CYP3A4 with gene position 1022 A>G which would lead to amino acid substitution Lys341Arg. We identified multiple non-synonymous SNPs in POR without rs numbers. More than 160 POR variants have been described to be associated with altered steroid metabolism and Antley-Bixler syndrome and disordered steroidogenesis. Five of the novel POR variants appeared only in single individuals with high Tac troughs, namely Arg186Val, Asp473Tyr, Gly589Val and Ala661Ser in the EA high group and Arg453Ser in the AA high group. If these SNPs result in lowered transfer of electrons into the P450 cycle, one would expect reduced clearance via CYP3A4 and CYP3A5.
We recently developed an in vitro method to validate the association of genetic variants with drug metabolism50. Variants are genetically engineered into cell lines, using CRISPR/Cas9, and then the cells are assayed to determine the effect of the specific variant on drug metabolism. This method was successfully used to validate the effect of CYP3A5 *1 vs. CYP3A5 *3 (rs776746) alleles on Tac metabolism50. This method can be used to engineer variants, identified in this study, into a hepatocyte cell lines to study Tac metabolism.
This study had limitations. Although we sequenced numerous genes expected to be associated with Tac troughs, whole genome sequencing would have been more complete. However, there were considerable cost differences between whole genome sequencing and targeted NGS. A FOXP3 genetic variant, rs3761548, was reported to be associated with Tac troughs51 and we did not sequence FOXP3. Another limitation of this study is that SIFT and PolyPhen2 are not completely accurate prediction algorithms. One study found, for missense variants in G protein couple receptor genes, that SIFT and PolyPhen2 were 83% and 85% accurate, respectively; while the LoF prediction was over 90% accurate for both, predicting non-functional variants was 54 or 57% accurate, respectively52. One study investigated the accuracy of SIFT and PolyPhen2 for predicting missense mutations in BRCA1, MSH2, MLH1 and TP53 genes that resulted in area under the curve of receiver operating characteristic curves for both algorithms to be between 78 and 79%53. Another study has shown that SIFT, PolyPhen2 and other predictive in silico tools’ accuracy is gene dependent and also best when used in combination54. Thus, we focused on the identified variants in this study that were identified to disrupt protein function by both SIFT and PolyPhen2. A further limitation that we did not consider was Tac adherence because adherence data was not collected. Due to the limited number of subjects in each group (N=48, 4 groups of 12), additional statistical power would be gained by sequencing more subjects. Although, there are limitations to this study, this model was effective at identifying genetic variants associated with Tac metabolism in kidney transplant recipients.
We envision expanding this study with more subjects to identify more genetic variants. We foresee these genetic variants being translated into refined Tac dosing equations8, 9. Refined dosing equations could be used to reduce variability in Tac troughs while reaching optimal therapeutic Tac troughs quickly post-transplant to reduce poor outcomes.
Supplementary Material
Acknowledgements
The authors wish to thank the research subjects for their participation in this study. We acknowledge the dedication and hard work of our coordinators at each of the DeKAF Genomics clinical sites: University of Alberta, Nicoleta Bobocea, Tina Wong, Adrian Geambasu and Alyssa Sader; University of Manitoba, Myrna Ross and Kathy Peters; University of Minnesota, Mandi DeGrote, Monica Meyers, Danielle Berglund and Ashley Roman; Hennepin County Medical Center, Lisa Berndt; Mayo Clinic, Tom DeLeeuw; University of Iowa, Wendy Wallace and Tammy Lowe; University of Alabama, Jacquelin Vaughn, Valencia Stephens and Tena Hilario. We also acknowledge the dedicated work of our research scientist Marcia Brott. This study was supported in part by NIH/NIAID grants 5U19-AI070119 and 5U01-AI058013 and by NIH/NIAID grant K01AI130409 to Casey Dorr.
Footnotes
Conflict of Interest
The authors declare no conflicts of interest for this study.
References
- 1.Annual Data Report of the US Organ Procurement and Transplantation Network (OPTN) and the Scientific Registry of Transplant Recipients (SRTR). Preface. Am J Transplant 2013; 13 Suppl 1: 1–7. [DOI] [PubMed] [Google Scholar]
- 2.Endrenyi L, Tothfalusi L. Determination of bioequivalence for drugs with narrow therapeutic index: reduction of the regulatory burden. J Pharm Pharm Sci 2013; 16(5): 676–682. [DOI] [PubMed] [Google Scholar]
- 3.Gaynor JJ, Ciancio G, Guerra G, Sageshima J, Roth D, Goldstein MJ, et al. Lower tacrolimus trough levels are associated with subsequently higher acute rejection risk during the first 12 months after kidney transplantation. Transpl Int 2016; 29(2): 216–226. [DOI] [PubMed] [Google Scholar]
- 4.Laskow DA, Vincenti F, Neylan JF, Mendez R, Matas AJ. An open-label, concentration-ranging trial of FK506 in primary kidney transplantation: a report of the United States Multicenter FK506 Kidney Transplant Group. Transplantation 1996; 62(7): 900–905. [DOI] [PubMed] [Google Scholar]
- 5.Lancia P, Jacqz-Aigrain E, Zhao W. Choosing the right dose of tacrolimus. Arch Dis Child 2015; 100(4): 406–413. [DOI] [PubMed] [Google Scholar]
- 6.Egeland EJ, Robertsen I, Hermann M, Midtvedt K, Storset E, Gustavsen MT, et al. High tacrolimus clearance is a risk factor for acute rejection in the early phase after renal transplantation. Transplantation 2017. [DOI] [PubMed] [Google Scholar]
- 7.Oetting WS, Schladt DP, Guan W, Miller MB, Remmel RP, Dorr C, et al. Genomewide Association Study of Tacrolimus Concentrations in African American Kidney Transplant Recipients Identifies Multiple CYP3A5 Alleles. Am J Transplant 2016; 16(2): 574–582. [DOI] [PMC free article] [PubMed] [Google Scholar]
- 8.Sanghavi K, Brundage RC, Miller MB, Schladt DP, Israni AK, Guan W, et al. Genotype-guided tacrolimus dosing in African-American kidney transplant recipients. Pharmacogenomics J 2017; 17(1): 61–68. [DOI] [PMC free article] [PubMed] [Google Scholar]
- 9.Passey C, Birnbaum AK, Brundage RC, Oetting WS, Israni AK, Jacobson PA. Dosing equation for tacrolimus using genetic variants and clinical factors. Br J Clin Pharmacol 2011; 72(6): 948–957. [DOI] [PMC free article] [PubMed] [Google Scholar]
- 10.Passey C, Birnbaum AK, Brundage RC, Schladt DP, Oetting WS, Leduc RE, et al. Validation of tacrolimus equation to predict troughs using genetic and clinical factors. Pharmacogenomics 2012; 13(10): 1141–1147. [DOI] [PMC free article] [PubMed] [Google Scholar]
- 11.Andreu F, Colom H, Elens L, van Gelder T, van Schaik RH, Hesselink DA, et al. A New CYP3A5*3 and CYP3A4*22 Cluster Influencing Tacrolimus Target Concentrations: A Population Approach. Clinical pharmacokinetics 2017. [DOI] [PubMed] [Google Scholar]
- 12.Jacobson PA, Oetting WS, Brearley AM, Leduc R, Guan W, Schladt D, et al. Novel polymorphisms associated with tacrolimus trough concentrations: results from a multicenter kidney transplant consortium. Transplantation 2011; 91(3): 300–308. [DOI] [PMC free article] [PubMed] [Google Scholar]
- 13.Oetting WS, Wu B, Schladt DP, Guan W, Remmel RP, Mannon RB, et al. Genome-wide association study identifies the common variants in CYP3A4 and CYP3A5 responsible for variation in tacrolimus trough concentration in Caucasian kidney transplant recipients. Pharmacogenomics J 2017. [DOI] [PMC free article] [PubMed] [Google Scholar]
- 14.Li D, Lewinger JP, Gauderman WJ, Murcray CE, Conti D. Using extreme phenotype sampling to identify the rare causal variants of quantitative traits in association studies. Genet Epidemiol 2011; 35(8): 790–799. [DOI] [PMC free article] [PubMed] [Google Scholar]
- 15.Li YR, van Setten J, Verma SS, Lu Y, Holmes MV, Gao H, et al. Concept and design of a genome-wide association genotyping array tailored for transplantation-specific studies. Genome Med 2015; 7: 90. [DOI] [PMC free article] [PubMed] [Google Scholar]
- 16.Jacobson PA, Schladt D, Oetting WS, Leduc R, Guan W, Matas AJ, et al. Lower calcineurin inhibitor doses in older compared to younger kidney transplant recipients yield similar troughs. Am J Transplant 2012; 12(12): 3326–3336. [DOI] [PMC free article] [PubMed] [Google Scholar]
- 17.Andrew S FastQC: a quality control tool for high throughput sequence data‥ 2010. [Google Scholar]
- 18.Li H, Durbin R. Fast and accurate long-read alignment with Burrows–Wheeler transform. Bioinformatics 2010; 26(5): 589–595. [DOI] [PMC free article] [PubMed] [Google Scholar]
- 19.Chou LS, Liu CS, Boese B, Zhang X, Mao R. DNA sequence capture and enrichment by microarray followed by next-generation sequencing for targeted resequencing: neurofibromatosis type 1 gene as a model. Clin Chem 2010; 56(1): 62–72. [DOI] [PubMed] [Google Scholar]
- 20.Lim BC, Lee S, Shin JY, Kim JI, Hwang H, Kim KJ, et al. Genetic diagnosis of Duchenne and Becker muscular dystrophy using next-generation sequencing technology: comprehensive mutational search in a single platform. J Med Genet 2011; 48(11): 731–736. [DOI] [PubMed] [Google Scholar]
- 21.do Valle IF, Giampieri E, Simonetti G, Padella A, Manfrini M, Ferrari A, et al. Optimized pipeline of MuTect and GATK tools to improve the detection of somatic single nucleotide polymorphisms in whole-exome sequencing data. BMC Bioinformatics 2016; 17(Suppl 12): 341. [DOI] [PMC free article] [PubMed] [Google Scholar]
- 22.Zhu P, He L, Li Y, Huang W, Xi F, Lin L, et al. Correction: OTG-snpcaller: An Optimized Pipeline Based on TMAP and GATK for SNP Calling from Ion Torrent Data. PLoS One 2015; 10(9): e0138824. [DOI] [PMC free article] [PubMed] [Google Scholar]
- 23.McCormick RF, Truong SK, Mullet JE. RIG: Recalibration and interrelation of genomic sequence data with the GATK. G3 (Bethesda) 2015; 5(4): 655–665. [DOI] [PMC free article] [PubMed] [Google Scholar]
- 24.Zhu P, He L, Li Y, Huang W, Xi F, Lin L, et al. OTG-snpcaller: an optimized pipeline based on TMAP and GATK for SNP calling from ion torrent data. PLoS One 2014; 9(5): e97507. [DOI] [PMC free article] [PubMed] [Google Scholar]
- 25.Van der Auwera GA, Carneiro MO, Hartl C, Poplin R, Del Angel G, Levy-Moonshine A, et al. From FastQ data to high confidence variant calls: the Genome Analysis Toolkit best practices pipeline. Curr Protoc Bioinformatics 2013; 43: 11 10 11–33. [DOI] [PMC free article] [PubMed] [Google Scholar]
- 26.McKenna A, Hanna M, Banks E, Sivachenko A, Cibulskis K, Kernytsky A, et al. The Genome Analysis Toolkit: a MapReduce framework for analyzing next-generation DNA sequencing data. Genome Res 2010; 20(9): 1297–1303. [DOI] [PMC free article] [PubMed] [Google Scholar]
- 27.DePristo MA, Banks E, Poplin R, Garimella KV, Maguire JR, Hartl C, et al. A framework for variation discovery and genotyping using next-generation DNA sequencing data. Nat Genet 2011; 43(5): 491–498. [DOI] [PMC free article] [PubMed] [Google Scholar]
- 28.Cingolani P, Platts A, Wang le L, Coon M, Nguyen T, Wang L, et al. A program for annotating and predicting the effects of single nucleotide polymorphisms, SnpEff: SNPs in the genome of Drosophila melanogaster strain w1118; iso-2; iso-3. Fly (Austin) 2012; 6(2): 80–92. [DOI] [PMC free article] [PubMed] [Google Scholar]
- 29.McLaren W, Gil L, Hunt SE, Riat HS, Ritchie GR, Thormann A, et al. The Ensembl Variant Effect Predictor. Genome Biol 2016; 17(1): 122. [DOI] [PMC free article] [PubMed] [Google Scholar]
- 30.Vaser R, Adusumalli S, Leng SN, Sikic M, Ng PC. SIFT missense predictions for genomes. Nat Protoc 2016; 11(1): 1–9. [DOI] [PubMed] [Google Scholar]
- 31.Sim NL, Kumar P, Hu J, Henikoff S, Schneider G, Ng PC. SIFT web server: predicting effects of amino acid substitutions on proteins. Nucleic Acids Res 2012; 40(Web Server issue): W452–457. [DOI] [PMC free article] [PubMed] [Google Scholar]
- 32.Adzhubei I, Jordan DM, Sunyaev SR. Predicting functional effect of human missense mutations using PolyPhen-2. Curr Protoc Hum Genet 2013; Chapter 7: Unit7 20. [DOI] [PMC free article] [PubMed] [Google Scholar]
- 33.Zou M, Baitei EY, Alzahrani AS, Parhar RS, Al-Mohanna FA, Meyer BF, et al. Mutation prediction by PolyPhen or functional assay, a detailed comparison of CYP27B1 missense mutations. Endocrine 2011; 40(1): 14–20. [DOI] [PubMed] [Google Scholar]
- 34.Flanagan SE, Patch AM, Ellard S. Using SIFT and PolyPhen to predict loss-of-function and gain-of-function mutations. Genet Test Mol Biomarkers 2010; 14(4): 533–537. [DOI] [PubMed] [Google Scholar]
- 35.Sha Q, Zhang S. A rare variant association test based on combinations of single-variant tests. Genet Epidemiol 2014; 38(6): 494–501. [DOI] [PMC free article] [PubMed] [Google Scholar]
- 36.Ionita-Laza I, Lee S, Makarov V, Buxbaum JD, Lin X. Sequence kernel association tests for the combined effect of rare and common variants. Am J Hum Genet 2013; 92(6): 841–853. [DOI] [PMC free article] [PubMed] [Google Scholar]
- 37.Lee S, Wu MC, Lin X. Optimal tests for rare variant effects in sequencing association studies. Biostatistics 2012; 13(4): 762–775. [DOI] [PMC free article] [PubMed] [Google Scholar]
- 38.Lee S, Emond MJ, Bamshad MJ, Barnes KC, Rieder MJ, Nickerson DA, et al. Optimal unified approach for rare-variant association testing with application to small-sample case-control whole-exome sequencing studies. Am J Hum Genet 2012; 91(2): 224–237. [DOI] [PMC free article] [PubMed] [Google Scholar]
- 39.Wu MC, Lee S, Cai T, Li Y, Boehnke M, Lin X. Rare-variant association testing for sequencing data with the sequence kernel association test. Am J Hum Genet 2011; 89(1): 82–93. [DOI] [PMC free article] [PubMed] [Google Scholar]
- 40.Liu Y, Kheradmand F, Davis CF, Scheurer ME, Wheeler D, Tsavachidis S, et al. Focused Analysis of Exome Sequencing Data for Rare Germline Mutations in Familial and Sporadic Lung Cancer. J Thorac Oncol 2016; 11(1): 52–61. [DOI] [PMC free article] [PubMed] [Google Scholar]
- 41.Bruse S, Moreau M, Bromberg Y, Jang JH, Wang N, Ha H, et al. Whole exome sequencing identifies novel candidate genes that modify chronic obstructive pulmonary disease susceptibility. Hum Genomics 2016; 10(1): 1. [DOI] [PMC free article] [PubMed] [Google Scholar]
- 42.Shtir C, Aldahmesh MA, Al-Dahmash S, Abboud E, Alkuraya H, Abouammoh MA, et al. Exome-based case-control association study using extreme phenotype design reveals novel candidates with protective effect in diabetic retinopathy. Hum Genet 2016; 135(2): 193–200. [DOI] [PubMed] [Google Scholar]
- 43.Emond MJ, Louie T, Emerson J, Chong JX, Mathias RA, Knowles MR, et al. Exome Sequencing of Phenotypic Extremes Identifies CAV2 and TMC6 as Interacting Modifiers of Chronic Pseudomonas aeruginosa Infection in Cystic Fibrosis. PLoS Genet 2015; 11(6): e1005273. [DOI] [PMC free article] [PubMed] [Google Scholar]
- 44.McLaren CE, Emond MJ, Subramaniam VN, Phatak PD, Barton JC, Adams PC, et al. Exome sequencing in HFE C282Y homozygous men with extreme phenotypes identifies a GNPAT variant associated with severe iron overload. Hepatology 2015; 62(2): 429–439. [DOI] [PMC free article] [PubMed] [Google Scholar]
- 45.Lange LA, Hu Y, Zhang H, Xue C, Schmidt EM, Tang ZZ, et al. Whole-exome sequencing identifies rare and low-frequency coding variants associated with LDL cholesterol. Am J Hum Genet 2014; 94(2): 233–245. [DOI] [PMC free article] [PubMed] [Google Scholar]
- 46.Xiao X, Zhao W, Tian F, Zhou X, Zhang J, Huang T, et al. Cytochrome b5 reductase 2 is a novel candidate tumor suppressor gene frequently inactivated by promoter hypermethylation in human nasopharyngeal carcinoma. Tumour Biol 2014; 35(4): 3755–3763. [DOI] [PMC free article] [PubMed] [Google Scholar]
- 47.Ming H, Lan Y, He F, Xiao X, Zhou X, Zhang Z, et al. Cytochrome b5 reductase 2 suppresses tumor formation in nasopharyngeal carcinoma by attenuating angiogenesis. Chinese journal of cancer 2015; 34(10): 459–467. [DOI] [PMC free article] [PubMed] [Google Scholar]
- 48.Devaney JM, Wang S, Funda S, Long J, Taghipour DJ, Tbaishat R, et al. Identification of novel DNA-methylated genes that correlate with human prostate cancer and high-grade prostatic intraepithelial neoplasia. Prostate cancer and prostatic diseases 2013; 16(4): 292–300. [DOI] [PubMed] [Google Scholar]
- 49.Liu Q, Liu Y, Li W, Wang X, Sawaya R, Lang FF, et al. Genetic, epigenetic, and molecular landscapes of multifocal and multicentric glioblastoma. Acta neuropathologica 2015; 130(4): 587–597. [DOI] [PMC free article] [PubMed] [Google Scholar]
- 50.Dorr CR, Remmel RP, Muthusamy A, Fisher J, Moriarity B, Yasuda K, et al. CRISPR/Cas9 genetic modification of CYP3A5 *3 in HuH-7 human hepatocyte cell line leads to cell lines with increased midazolam and tacrolimus metabolism. Drug metabolism and disposition: the biological fate of chemicals 2017. [DOI] [PMC free article] [PubMed] [Google Scholar]
- 51.Ge J, Wang J, Zhao H, Li K, Jing Y, Li G. Impact of FOXP3 Polymorphisms on the Blood Level of Tacrolimus in Renal Transplant Recipients. Transplant Proc 2016; 48(6): 1962–1967. [DOI] [PubMed] [Google Scholar]
- 52.Min L, Nie M, Zhang A, Wen J, Noel SD, Lee V, et al. Computational Analysis of Missense Variants of G Protein-Coupled Receptors Involved in the Neuroendocrine Regulation of Reproduction. Neuroendocrinology 2016; 103(3–4): 230–239. [DOI] [PMC free article] [PubMed] [Google Scholar]
- 53.Hicks S, Wheeler DA, Plon SE, Kimmel M. Prediction of missense mutation functionality depends on both the algorithm and sequence alignment employed. Hum Mutat 2011; 32(6): 661–668. [DOI] [PMC free article] [PubMed] [Google Scholar]
- 54.Leong IU, Stuckey A, Lai D, Skinner JR, Love DR. Assessment of the predictive accuracy of five in silico prediction tools, alone or in combination, and two metaservers to classify long QT syndrome gene mutations. BMC Med Genet 2015; 16: 34. [DOI] [PMC free article] [PubMed] [Google Scholar]
- 55.Crettol S, Venetz JP, Fontana M, Aubert JD, Pascual M, Eap CB. CYP3A7, CYP3A5, CYP3A4, and ABCB1 genetic polymorphisms, cyclosporine concentration, and dose requirement in transplant recipients. Ther Drug Monit 2008; 30(6): 689–699. [DOI] [PubMed] [Google Scholar]
- 56.de Jonge H, de Loor H, Verbeke K, Vanrenterghem Y, Kuypers DR. In vivo CYP3A4 activity, CYP3A5 genotype, and hematocrit predict tacrolimus dose requirements and clearance in renal transplant patients. Clin Pharmacol Ther 2012; 92(3): 366–375. [DOI] [PubMed] [Google Scholar]
- 57.Staatz CE, Tett SE. Clinical pharmacokinetics and pharmacodynamics of tacrolimus in solid organ transplantation. Clin Pharmacokinet 2004; 43(10): 623–653. [DOI] [PubMed] [Google Scholar]
- 58.Kamdem LK, Streit F, Zanger UM, Brockmoller J, Oellerich M, Armstrong VW, et al. Contribution of CYP3A5 to the in vitro hepatic clearance of tacrolimus. Clinical chemistry 2005; 51(8): 1374–1381. [DOI] [PubMed] [Google Scholar]
- 59.Smith HE, Jones JP 3rd, Kalhorn TF, Farin FM, Stapleton PL, Davis CL, et al. Role of cytochrome P450 2C8 and 2J2 genotypes in calcineurin inhibitor-induced chronic kidney disease. Pharmacogenet Genomics 2008; 18(11): 943–953. [DOI] [PMC free article] [PubMed] [Google Scholar]
- 60.Gervasini G, Garcia M, Macias RM, Cubero JJ, Caravaca F, Benitez J. Impact of genetic polymorphisms on tacrolimus pharmacokinetics and the clinical outcome of renal transplantation. Transpl Int 2012; 25(4): 471–480. [DOI] [PubMed] [Google Scholar]
- 61.Hubbard PA, Shen AL, Paschke R, Kasper CB, Kim JJ. NADPH-cytochrome P450 oxidoreductase. Structural basis for hydride and electron transfer. The Journal of biological chemistry 2001; 276(31): 29163–29170. [DOI] [PubMed] [Google Scholar]
- 62.Bruckmueller H, Werk AN, Renders L, Feldkamp T, Tepel M, Borst C, et al. Which Genetic Determinants Should be Considered for Tacrolimus Dose Optimization in Kidney Transplantation? A Combined Analysis of Genes Affecting the CYP3A Locus. Ther Drug Monit 2015; 37(3): 288–295. [DOI] [PubMed] [Google Scholar]
- 63.de Jonge H, Metalidis C, Naesens M, Lambrechts D, Kuypers DR. The P450 oxidoreductase *28 SNP is associated with low initial tacrolimus exposure and increased dose requirements in CYP3A5-expressing renal recipients. Pharmacogenomics 2011; 12(9): 1281–1291. [DOI] [PubMed] [Google Scholar]
- 64.Kurian JR, Bajad SU, Miller JL, Chin NA, Trepanier LA. NADH cytochrome b5 reductase and cytochrome b5 catalyze the microsomal reduction of xenobiotic hydroxylamines and amidoximes in humans. The Journal of pharmacology and experimental therapeutics 2004; 311(3): 1171–1178. [DOI] [PubMed] [Google Scholar]
- 65.Hebert MF. Contributions of hepatic and intestinal metabolism and P-glycoprotein to cyclosporine and tacrolimus oral drug delivery. Adv Drug Deliv Rev 1997; 27(2–3): 201–214. [DOI] [PubMed] [Google Scholar]
- 66.Masuda S, Goto M, Okuda M, Ogura Y, Oike F, Kiuchi T, et al. Initial dosage adjustment for oral administration of tacrolimus using the intestinal MDR1 level in living-donor liver transplant recipients. Transplant Proc 2005; 37(4): 1728–1729. [DOI] [PubMed] [Google Scholar]
- 67.Sakurai A, Tamura A, Onishi Y, Ishikawa T. Genetic polymorphisms of ATP-binding cassette transporters ABCB1 and ABCG2: therapeutic implications. Expert opinion on pharmacotherapy 2005; 6(14): 2455–2473. [DOI] [PubMed] [Google Scholar]
- 68.Shilbayeh S The impact of genetic polymorphisms on time required to attain the target tacrolimus levels and subsequent pharmacodynamic outcomes in pediatric kidney transplant patients. Saudi journal of kidney diseases and transplantation : an official publication of the Saudi Center for Organ Transplantation, Saudi Arabia 2014; 25(2): 266–277. [DOI] [PubMed] [Google Scholar]
- 69.Pawarode A, Shukla S, Minderman H, Fricke SM, Pinder EM, O’Loughlin KL, et al. Differential effects of the immunosuppressive agents cyclosporin A, tacrolimus and sirolimus on drug transport by multidrug resistance proteins. Cancer Chemother Pharmacol 2007; 60(2): 179–188. [DOI] [PubMed] [Google Scholar]
- 70.Ciftci HS, Ayna TK, Caliskan YK, Guney I, Bakkaloglu H, Nane I, et al. Effect of MDR1 polymorphisms on the blood concentrations of tacrolimus in Turkish renal transplant patients. Transplant Proc 2013; 45(3): 895–900. [DOI] [PubMed] [Google Scholar]
- 71.Ogasawara K, Chitnis S, Gohh R, Christians U, Akhlaghi F. Multidrug Resistance-Associated Protein 2 (MRP2/ABCC2) Haplotypes Significantly Affect the Pharmacokinetics of Tacrolimus in Kidney Transplant Recipients. Clinical Pharmacokinetics 2013; 52(9): 751–762. [DOI] [PMC free article] [PubMed] [Google Scholar]
- 72.Pascussi JM, Gerbal-Chaloin S, Drocourt L, Maurel P, Vilarem MJ. The expression of CYP2B6, CYP2C9 and CYP3A4 genes: a tangle of networks of nuclear and steroid receptors. Biochim Biophys Acta 2003; 1619(3): 243–253. [DOI] [PubMed] [Google Scholar]
- 73.Pascussi JM, Drocourt L, Gerbal-Chaloin S, Fabre JM, Maurel P, Vilarem MJ. Dual effect of dexamethasone on CYP3A4 gene expression in human hepatocytes. Sequential role of glucocorticoid receptor and pregnane X receptor. Eur J Biochem 2001; 268(24): 6346–6358. [DOI] [PubMed] [Google Scholar]
- 74.Rodriguez M, Felsenfeld AJ, Llach F. Aluminum administration in the rat separately affects the osteoblast and bone mineralization. J Bone Miner Res 1990; 5(1): 59–67. [DOI] [PubMed] [Google Scholar]
- 75.Barraclough KA, Isbel NM, Lee KJ, Bergmann TK, Johnson DW, McWhinney BC, et al. NR1I2 polymorphisms are related to tacrolimus dose-adjusted exposure and BK viremia in adult kidney transplantation. Transplantation 2012; 94(10): 1025–1032. [DOI] [PubMed] [Google Scholar]
- 76.Chen D, Guo F, Shi J, Zhang C, Wang Z, Fan J, et al. Association of hemoglobin levels, CYP3A5, and NR1I3 gene polymorphisms with tacrolimus pharmacokinetics in liver transplant patients. Drug Metab Pharmacokinet 2014; 29(3): 249–253. [DOI] [PubMed] [Google Scholar]
- 77.Tirona RG, Lee W, Leake BF, Lan LB, Cline CB, Lamba V, et al. The orphan nuclear receptor HNF4alpha determines PXR- and CAR-mediated xenobiotic induction of CYP3A4. Nat Med 2003; 9(2): 220–224. [DOI] [PubMed] [Google Scholar]
- 78.Jover R, Bort R, Gomez-Lechon MJ, Castell JV. Down-regulation of human CYP3A4 by the inflammatory signal interleukin-6: molecular mechanism and transcription factors involved. FASEB J 2002; 16(13): 1799–1801. [DOI] [PubMed] [Google Scholar]
- 79.Rodriguez-Antona C, Bort R, Jover R, Tindberg N, Ingelman-Sundberg M, Gomez-Lechon MJ, et al. Transcriptional regulation of human CYP3A4 basal expression by CCAAT enhancer-binding protein alpha and hepatocyte nuclear factor-3 gamma. Mol Pharmacol 2003; 63(5): 1180–1189. [DOI] [PubMed] [Google Scholar]
- 80.Klein K, Thomas M, Winter S, Nussler AK, Niemi M, Schwab M, et al. PPARA: A Novel Genetic Determinant of CYP3A4 In Vitro and In Vivo. Clinical Pharmacology & Therapeutics 2012; 91(6): 1044–1052. [DOI] [PubMed] [Google Scholar]
- 81.Kurzawski M, Malinowski D, Dziewanowski K, Drozdzik M. Impact of PPARA and POR polymorphisms on tacrolimus pharmacokinetics and new-onset diabetes in kidney transplant recipients. Pharmacogenet Genomics 2014; 24(8): 397–400. [DOI] [PubMed] [Google Scholar]
- 82.Lamba V, Panetta JC, Strom S, Schuetz EG. Genetic predictors of interindividual variability in hepatic CYP3A4 expression. The Journal of pharmacology and experimental therapeutics 2010; 332(3): 1088–1099. [DOI] [PMC free article] [PubMed] [Google Scholar]
Associated Data
This section collects any data citations, data availability statements, or supplementary materials included in this article.
Supplementary Materials
Data Availability Statement
Raw sequence data, in fastq format, are available at the United States National Center for Biotechnology Information’s (NCBI) Sequence Read Archive (SRA) with SRA accession number: SRP156752. The associated phenotype and covariate data are available at NCBI’s Database for Genotypes and Phenotypes with dbGaP accession number: phs001670.v1.p1.