Summary
Across the animal kingdom, gastrulation represents a key developmental event during which embryonic pluripotent cells diversify into lineage-specific precursors that will generate the adult organism. Here we report the transcriptional profiles of 116,312 single cells from mouse embryos collected at nine sequential time-points ranging from 6.5 to 8.5 days post-fertilisation. We reconstruct a molecular map of cellular differentiation from pluripotency towards all major embryonic lineages, and explore the complex events involved in the convergence of visceral and primitive streak-derived endoderm. Furthermore, we demonstrate how combining temporal and transcriptional information illuminates gene function by single-cell profiling of Tal1−/− chimeric embryos, with our analysis revealing defects in early mesoderm diversification. Taken together, this comprehensive delineation of mammalian cell differentiation trajectories in vivo represents a baseline for understanding the effects of gene mutations during development as well as a baseline for the optimisation of in vitro differentiation protocols for regenerative medicine.
The 48 hours of mouse embryonic development from embryonic day (E) 6.5 to E8.5 encompass the key phases of gastrulation and early organogenesis, when pluripotent epiblast cells diversify into ectodermal, mesodermal and endodermal progenitors of all major organs1. Despite the central importance of this period of mammalian development, we currently lack a comprehensive understanding of the underlying developmental trajectories and molecular processes, principally because research efforts either employed in vitro systems2, focused on small numbers of genes, or limited the number of developmental stages or cell types that were studied3.
A single-cell map of early embryogenesis
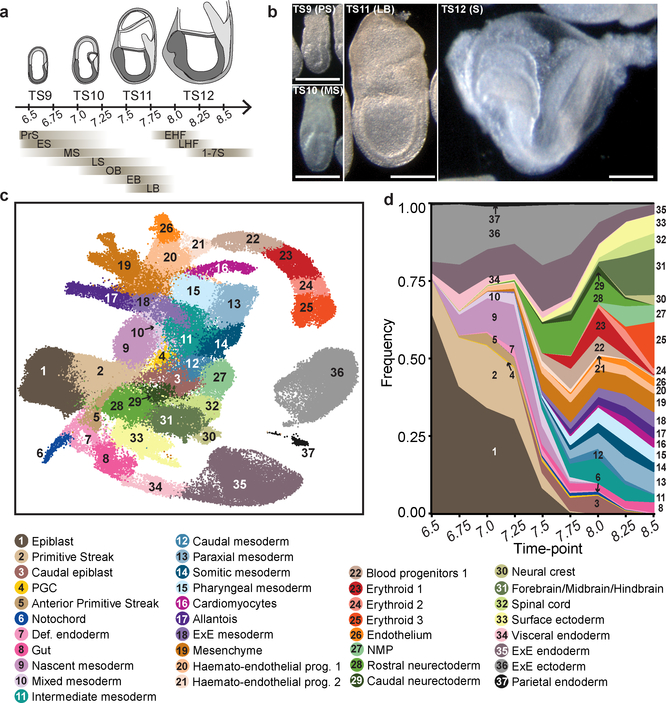
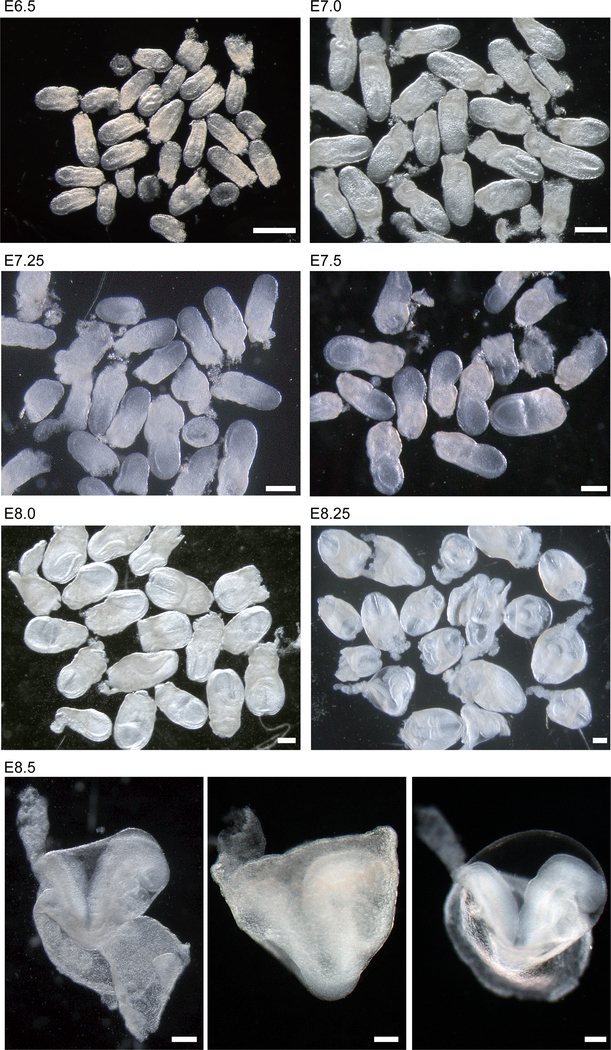
To investigate the dynamic unfolding of cellular diversification during gastrulation and early organogenesis, we complemented a previous E8.25 dataset5 by generating single-cell RNA-seq (scRNA-seq) profiles from over 350 whole mouse embryos, collected at six-hour intervals between E6.5 and E8.5 (Fig. 1a, b; Extended Data Fig. 1, 2a). Our dataset thus captures Theiler stages TS9, TS10, TS11 and TS12, enriched in the Pre-Streak to Early Streak, Mid-Streak to Late-streak, Neural Plate, and Headfold to Somitogenesis stages, respectively6.
Figure 1: A single-cell resolution atlas of mouse gastrulation and early organogenesis.
a, Overview of embryonic developmental time-points sampled, alongside corresponding Theiler and Downs and Davies stages. Adapted from38. Numbers indicate days post-fertilisation. PrS: Pre-Streak, ES: Early Streak, MS: Mid-Streak, LS: Late Streak, OB: Neural Plate no bud, EB: Neural Plate Early Bud, LB: Neural Plate Late Bud, EHF: Early Headfold, LHF: Late Headfold, 1–7S: 1–7 Somites. b, Representative images of sampled embryos (see Supplementary Information Table 1 for sample collection and size). Scale bars: 0.25 mm. c, UMAP plot showing all cells of the atlas (116,312 cells). Cells are coloured by their cell type annotation and numbered according to the legend below. ExE: Extra-embryonic, NMP: Neuromesodermal progenitors, PGC: Primordial germ cells, prog.: progenitor, Def.: Definitive. d, Change in frequency of cell type per time-point, displaying a progressive increase in cell type complexity throughout our sampling.
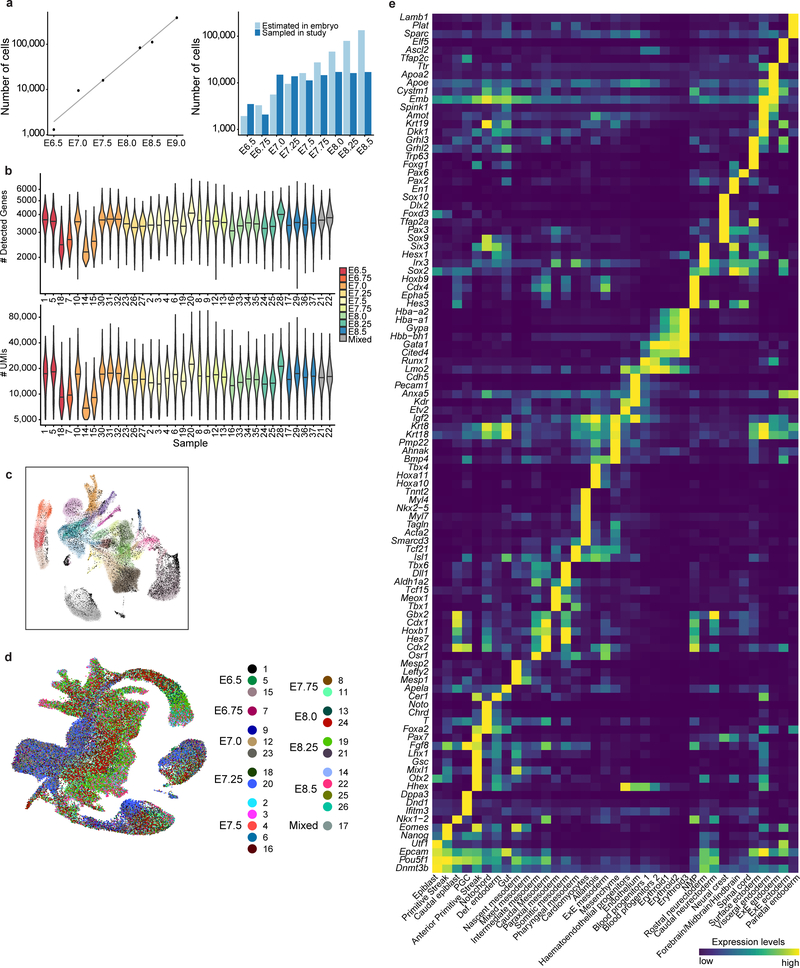
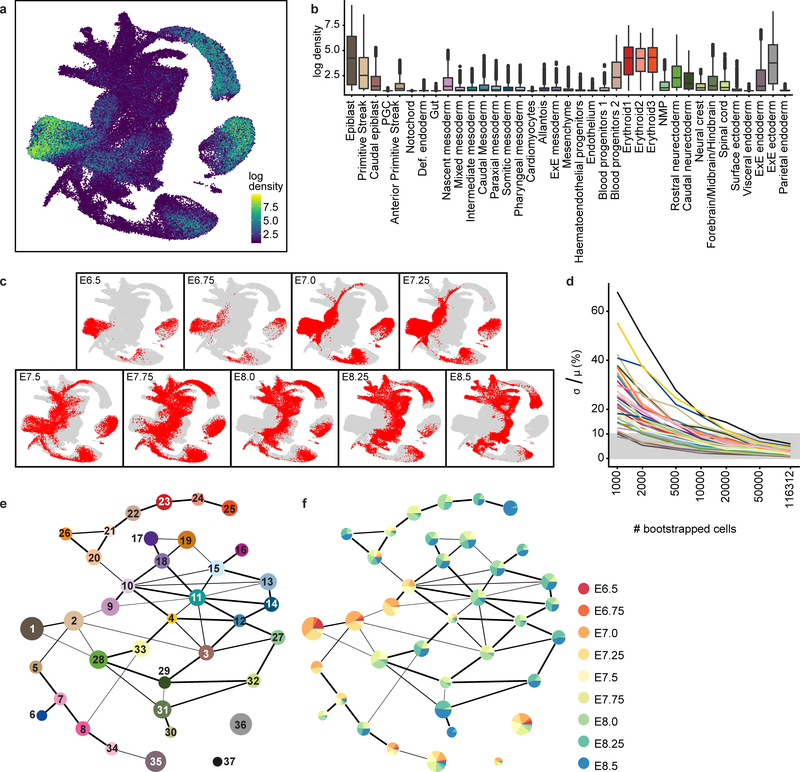
116,312 single-cell transcriptomes passed stringent quality control measures, with a median of 3,436 genes detected per cell (Methods; Extended Data Fig. 2b–d; Supplementary Information Table 1). Clustering and annotation identified 37 major cell populations (Fig. 1c; Extended Data Fig. 2e), whose presence was coupled with progression along the densely sampled time-points (Extended Data Fig. 3a–d). The frequency of pluripotent epiblast cells declined over time, and mesodermal and definitive endodermal lineages appeared as early as E6.75. Later, ectodermal lineages emerged alongside a striking diversification of cell types from each germ layer at the onset of organogenesis (Fig. 1d).
Transcriptional similarities between clusters (Methods; Extended Data Fig. 3e, f) were consistent with prior knowledge: epiblast was similar to neuroectoderm and primitive streak, with the latter being related to mesoderm and endoderm, consistent with the divergence of the three germ layers. Neural and mesodermal layers were connected during organogenesis (E8.25-E8.5) via a neuro-mesodermal progenitor population, which has been reported to give rise to both caudal and neural tissues of the spinal cord (Extended Data Fig. 3e)7,8. Our atlas can be explored via an interactive and user-friendly website: https://marionilab.cruk.cam.ac.uk/MouseGastrulation2018/.
Mapping endoderm development
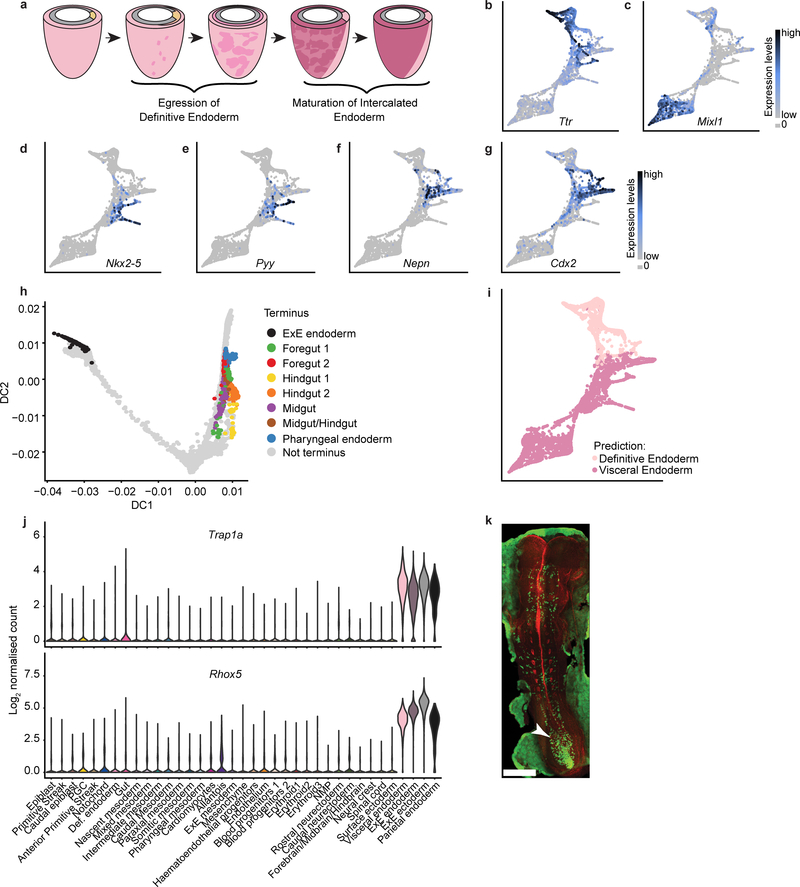
Previous lineage tracing studies3,9 have shown that extra-embryonic and intra-embryonic endodermal cells intercalate to form a single tissue, highlighting the plasticity of embryonic cells (Extended Data Fig. 4a). Since extra-embryonic structures were sampled alongside the gastrulating embryo, our dataset provided an opportunity to investigate this convergence of primitive streak-derived definitive endoderm (DE) with visceral endoderm-derived cells (VE) at the molecular level.
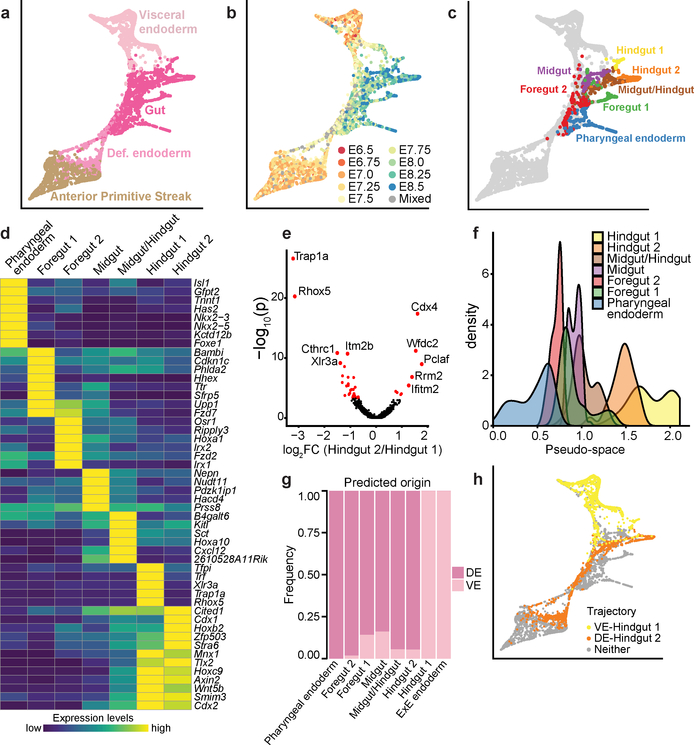
To this end, we performed a focused analysis using only the visceral endoderm, anterior primitive streak, definitive endoderm and gut cell types (Fig. 2a; 5,015 cells), which was consistent with gut endoderm arising from visceral as well as definitive endoderm, identified by expression of Ttr and Mixl1, respectively (Extended Data Fig. 4b, c). Inspection of the time-points of cell collection supported the transcriptional convergence of these two lineages during development (Fig. 2b).
Figure 2: Molecular conversion and subsequent diversification during early endoderm development.
a-c, Force-directed graph layout of the endoderm cell subset (5,015 cells) coloured by (a) global cell type annotation, (b) embryo collection time-point, (c) mature gut cell types. Each point is a cell, and cells close to each other have similar transcriptional profiles. d, Heatmap illustrating mean expression of marker genes for each mature gut cluster (row-normalised). e, Volcano plot showing differentially-expressed genes between Hindgut 1 (53 cells) and 2 (148 cells). Red: significantly differentially-expressed genes (BH-adjusted p <0.1; Methods). The five most significantly differentially-expressed genes in each direction are labelled. f, Pseudo-spatial ordering of cells along the gut tube. x-axis: pseudo-space coordinate corresponding to DPT values. g, Fraction of cells of each mature gut cluster predicted to derive from visceral endoderm (VE) or definitive endoderm (DE). h, Force-directed graph coloured by putative trajectories for formation of the Hindgut clusters.
To define the transcriptional diversity within the mature gut, we exclusively analysed cells collected at E8.25 and E8.5 and identified seven clusters corresponding to different cell populations that line the gut tube (Fig. 2c), spanning the pharyngeal endoderm (expressing Nkx2–5), foregut (expressing Pyy), midgut (expressing Nepn), and hindgut (expressing Cdx2) (Extended Data Fig. 4d–g). Notably, foregut was split into two clusters, named Foregut 1 and Foregut 2, likely corresponding to liver and lung precursors, respectively (see hepatic-associated genes Hhex, Sfrp5 and Ttr 10–12, and lung-associated genes Ripply3 and Irx113,14, in Fig. 2d). Hindgut cells were also divided into two distinct clusters, Hindgut 1 and Hindgut 2, with significantly higher expression of the X-linked genes Trap1a and Rhox5 in Hindgut 1 (Fig. 2d, e). Given the spatial complexity of the gut tube, we derived a pseudo-spatial ordering of these clusters using diffusion pseudotime (DPT15), which recapitulated their anterior-posterior distribution (Fig. 2f).
To assess how VE cells may contribute to the mature gut, we inferred cellular transitions along sequential collection time-points using transport maps16 (Methods). We then asked whether cells in each gut cluster at E8.25 and E8.5 were likely derived from E7.0 VE or DE ancestors. To account for cells with a permanent extra-embryonic fate, we added ExE endoderm to the analysis (Methods; Extended Data Fig. 4h). Both the ExE endoderm and the Hindgut 1 clusters were comprised of cells derived primarily from the VE, with all remaining clusters having considerably smaller contributions (Fig. 2g; Extended Data Fig. 4i). Of note, the Hindgut 1 specific genes Trap1a and Rhox5 are also expressed in ExE endoderm and ExE ectoderm, consistent with the extra-embryonic origin of Hindgut 1 (Extended Data Fig. 4j). This suggests that, while Hindgut 1 and Hindgut 2 share a core hindgut signature, Hindgut 1 cells also retain a transcriptional legacy from their extraembryonic origin. We also extended previous lineage tracing at E8.759 by showing enrichment of Ttr-YFP traced cells in the most posterior section of E8.5 embryos containing the hindgut, using a Ttr::Cre transgene coupled with a conditional YFP transgene in the ROSA26 locus (Extended Data Fig. 4k).
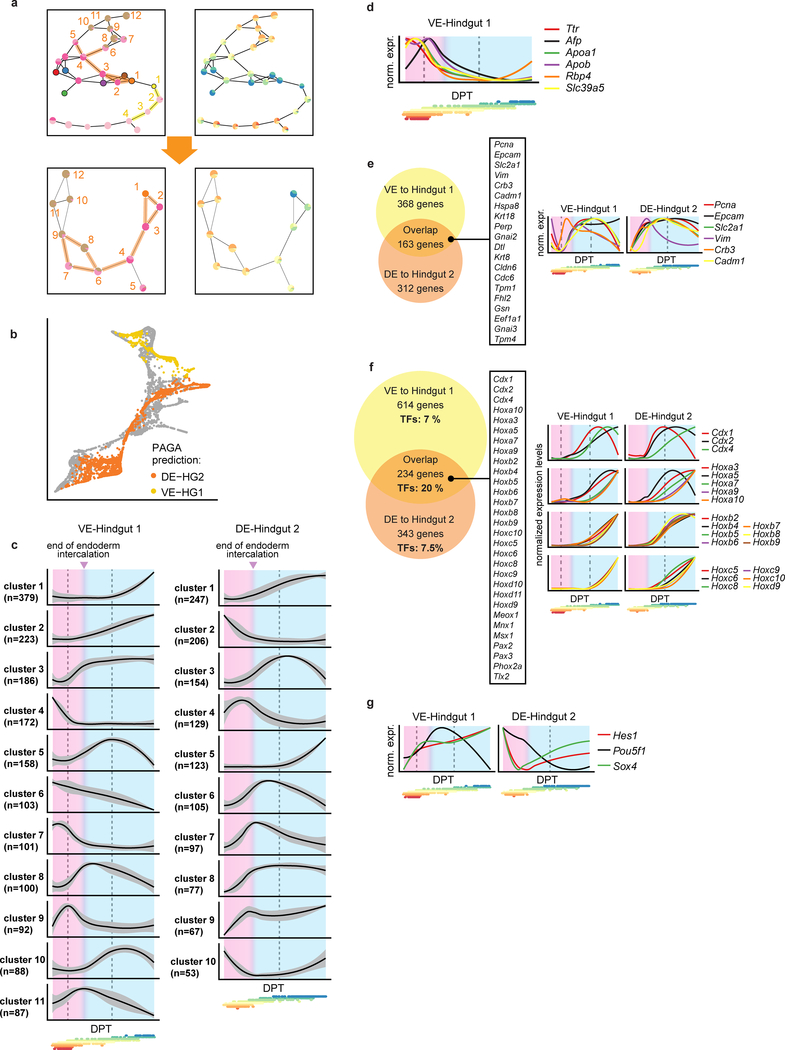
Next, we inferred which cells belonged to the developmental trajectories from the VE to Hindgut 1, and from the DE to Hindgut 2 (Methods; Fig. 2h; Extended Data Fig. 5a, b), ordered the cells using DPT15, and clustered genes based on their expression dynamics along each trajectory (Methods; Supplementary Information Table 2; Extended Data Fig. 5c). We divided each trajectory into two domains: before and after completion of endoderm intercalation at E7.517. In the VE-Hindgut 1 trajectory, we observed upregulation of VE genes during the first domain, followed by an abrupt decline as cells proceeded towards the gut fate (Extended Data Fig. 5d), indicating that we captured a subset of VE cells undergoing visceral maturation prior to the onset of DE intercalation.
Across both trajectories, a common set of genes were upregulated during intercalation (Extended Data Fig. 5c, e), including genes involved in epithelial remodelling such as Pcna, Epcam, and Vim, consistent with epithelial rearrangement9. Genes commonly upregulated during the subsequent gut maturation and morphogenesis phase (Extended Data Fig. 5c, f) were enriched for transcription factors (>20% of overlapping genes), 66% of which were homeodomain proteins that showed sequential activation profiles, indicative of a temporal collinearity during hindgut specification18. Analysis of dynamic gene expression also revealed transcription factors specifically induced early in the VE-Hindgut1 trajectory, including Hes1, Pou5f1, and Sox4, which represent promising candidates for further study (Extended Data Fig. 5g).
Origins of haemato-endothelial lineages
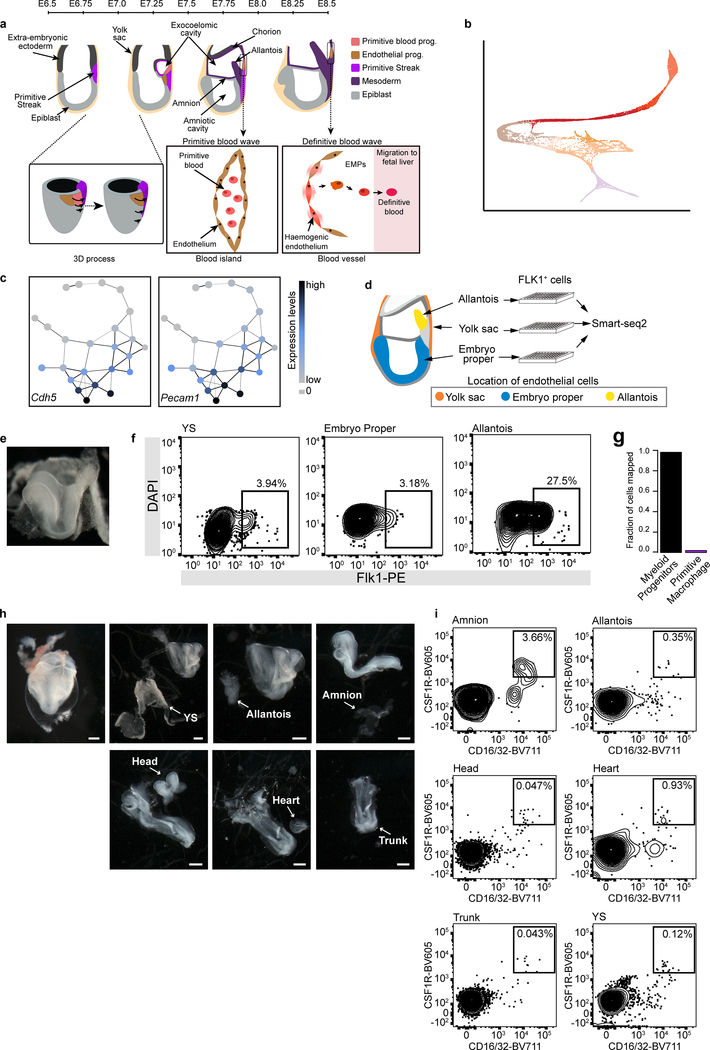
Red blood cells are formed in two consecutive waves in the yolk sac (YS), the first arising at around E7.5 and the second from E8.25. The first wave (primitive) generates nucleated erythrocytes, which disappear shortly after birth. The second wave (YS definitive) starts with the emergence of erythro-myeloid progenitors (EMPs) from YS haemogenic endothelium (HE). These later migrate to the foetal liver and generate definitive erythrocytes19 (Extended Data Fig. 6a).
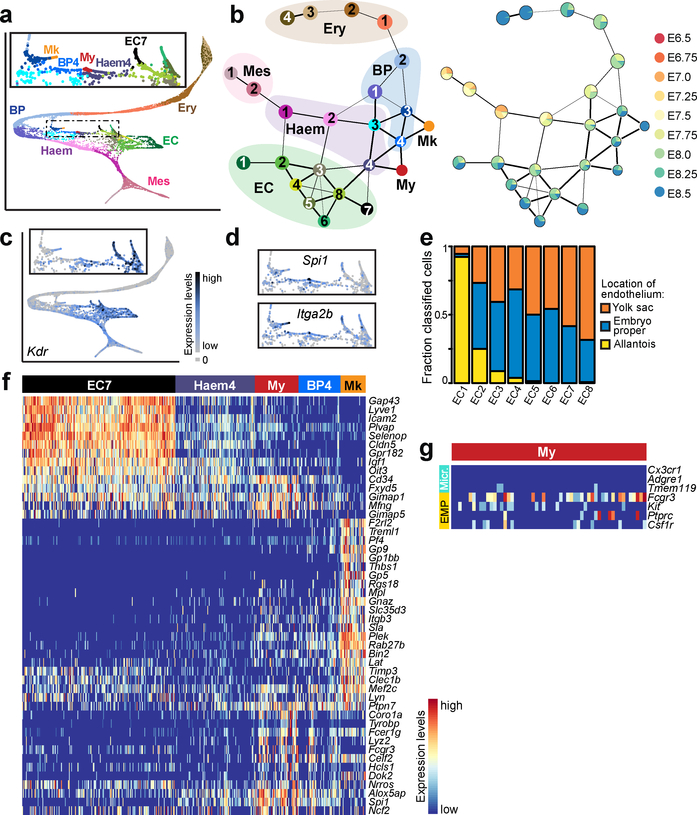
While some key phenotypic and molecular distinctions between primitive and YS definitive haematopoiesis are known, the respective in vivo progenitors are poorly understood due to limiting cell numbers and lack of markers. To characterise these processes more deeply, we computationally isolated and re-clustered cells assigned to the erythroid, haemato-endothelial, blood progenitor, endothelial and mixed mesoderm groups (15,875 cells; Fig. 3a, b; Extended Data Fig. 6b).
Figure 3: Temporal analysis of blood emergence reveals early myeloid cells.
a, Force-directed graph layout of cells associated with the blood lineage, coloured by subcluster (15,875 cells). Box shows a zoomed section focusing on Myeloid (My), Megakaryocytic (Mk), and haemogenic endothelial cells. b, Graph abstraction summarising the relationships between the subclusters as in (a), coloured by subcluster (left) and collection time-point (right), excluding two samples of mixed-time-point embryos. c, Expression levels of Kdr, overlaid on the force-directed layout, d, Expression levels of Spi1 and Itga2b, overlaid on the inset of the force-directed layout, e, Fraction of EC cells mapped to yolk sac, allantois and embryo proper. f, Heatmap illustrating row-normalised expression of genes upregulated in EC7 (197 cells), Haem4 (102 cells), My (56 cells), BP4 (54 cells) and Mk (32 cells) clusters when comparing all subclusters in (a) (logFC>2.5; BH-adjusted p<0.05). g, Heatmap illustrating the log-count expression (ranging from 0 to 3.5) of previously described microglial (Micr.) and EMP markers.
This analysis highlighted a putative trajectory towards the primitive erythroid lineage, passing through clusters Haem1–2 (haemato-endothelial progenitors), BP1–2 (blood progenitors) and Ery1–4 (erythrocytes) (Fig. 3a, b). This trajectory did not include the endothelial region (clusters EC1–8), which was enriched for cells collected at E8.25-E8.5, displayed a complex structure, and expressed high levels of Kdr, which encodes the protein FLK1 (termed Kdrhi region hereafter) (Fig. 3c). Notably, some of these endothelial cells expressed haematopoietic markers, such as Spi1 (Pu.1) and Itga2b (Fig. 3d), potentially highlighting the emergence of blood from endothelium during the second wave20. Incorporating temporal information (Fig. 3b) suggested that, unlike the second haematopoietic wave, the first wave does not transit through a molecular state with classical mature endothelial characteristics, as marked by Cdh5 and Pecam1 (Extended Data Fig. 6c).
Endothelial cells are generated independently in the YS, allantois and embryo proper (EP)21,22, with the allantoic endothelium being hypothesised to display a specific transcriptional signature5. To test whether the heterogeneity in the Kdrhi region was associated with different anatomical locations, we dissected out the YS, allantois and EP from a new batch of E8.25 embryos, purified endothelial cells by flow sorting the FLK1+ population, and performed scRNA-seq on 288 cells using Smart-seq223 (Extended Data Fig. 6d–f). Assigning the cells from the Kdrhi region (EC1–8) to their most likely embryonic location intimated that diverse anatomical origin can partially explain the transcriptional heterogeneity observed in the endothelium (Fig. 3e).
Previous in vitro colony forming assays of early embryonic cells suggested that, in addition to erythrocytes, the primitive wave also gives rise to macrophage and megakaryocytic progenitors24–26. However, the molecular nature of these progenitors remains obscure. In our atlas, we identified two rare cell groups (present at a frequency of around 0.1%) that we annotated as megakaryocytes (Mk) and myeloid cells (My; Extended Data Fig. 6g), providing an opportunity to characterise their molecular profiles based on primary in vivo cells (Fig. 3f).
Recent reports suggest that early myeloid progenitors can give rise to brain microglia27. Consistent with this, cells in our My population expressed Ptprc (CD45), Kit, Csf1r and Fcgr3 (CD16/32), previously reported as markers of the E8.5 EMP-like population that give rise to microglial macrophages20,28 (Fig. 3g). However, they did not express appreciable levels of more mature microglial-related genes such as Cx3cr1, Adgre1 (F4/80) and Tmem11929,30. To investigate the location and frequency of these cells in the embryo, we dissected different regions of E8.5 embryos (Extended Data Fig. 6h) and performed flow cytometry analysis using the markers CD16/32 and CSF1R. Rare CD16/32+CSF1R+ cells were found in all dissected regions (Extended Data Fig. 6i), indicating that by E8.5 this population has already started to migrate out of the YS.
A platform to dissect genetic mutations
Previous work has emphasised the critical role of the bHLH transcription factor TAL1 (SCL) in haematopoiesis, with Tal1−/− mouse embryos dying around E9.5 from severe anaemia31. Dissecting the temporal and mechanistic roles in vivo of major regulatory genes is challenging using knockout mice, as they require time-consuming breeding and genotyping of embryos. Additionally, direct effects of the mutation are often masked by gross developmental malformation or embryo lethality. To circumvent these difficulties, we generated chimeric mouse embryos where Tal1−/− tdTomato+ mouse embryonic stem cells (ESC) were injected into wildtype blastocysts. In the resulting chimeras, wildtype cells still produce blood cells, allowing the specific effects of TAL1 depletion to be studied in an otherwise healthy embryo32.
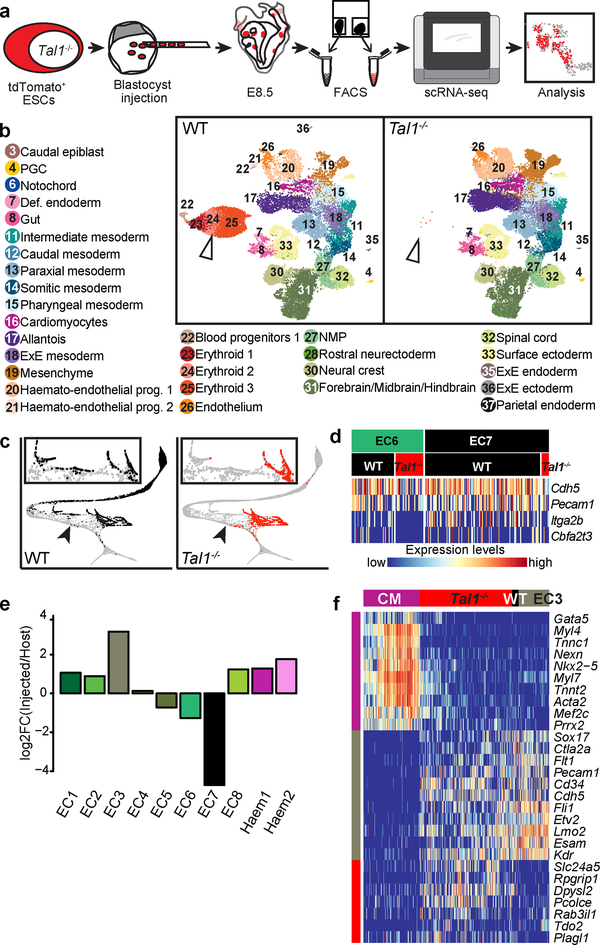
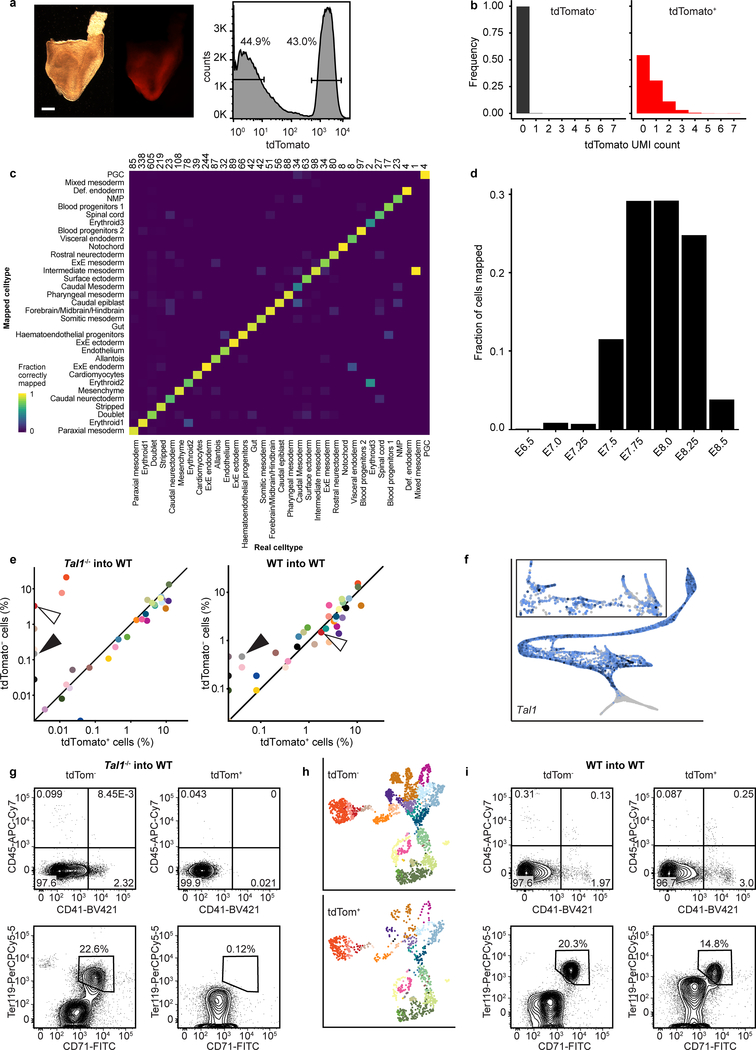
To determine whether Tal1 mutant cells were associated with abnormalities in specific lineages, we sorted tdTomato− (WT) and tdTomato+ (Tal1−/−) cells from chimeric embryos at E8.5 followed by scRNA-seq (Fig. 4a; Extended Data Fig. 7a, b). Each cell was annotated by computationally mapping its transcriptome onto our wildtype atlas (Methods; Fig. 4b; Extended Data Fig. 7c–e). Consistent with the pivotal role of Tal1 in haematopoiesis, tdTomato+ cells did not contribute to blood lineages (Fig. 4b; Extended Data Fig. 7e–g). Importantly, we confirmed that wildtype control tdTomato+ Tal1+/+ ESCs, when injected into wildtype embryos, make a similar contribution to haematopoiesis as the tdTomato− host cells (Extended Data Fig. 7h, i).
Figure 4: Mapping Tal1−/− chimeras to the atlas identifies molecular states associated with defects in haemato-endothelial development.
a, Experimental design for Tal1−/− chimera generation and sequencing. b, UMAPs of chimera cells (25,078 WT cells; 26,326 Tal1−/− cells). Points are coloured and numbered according to their computationally assigned cell type, as in Figure 1. Numbers and legend have only been specified for those cell types that are clearly visible in the plot. White arrowhead highlights blood cells, which are depleted in mutant cells. c, Mapping of blood-related cells from the chimera onto the blood-related cells from the atlas. Left: WT (9,336 cells); right: Tal1−/− (2,911 cells). Arrowheads denote the position at which blood development appears blocked in Tal1−/− cells. d, Heatmap illustrating the row-normalised expression of blood (Cbfa2t3 and Itga2b) and endothelial (Cdh5 and Pecam1) genes in EC6 WT (43 cells), EC6 Tal1−/− (28 cells), EC7 WT (117 cells), and EC7 Tal1−/− (7 cells) cells. e, Log-fold-change abundance of Tal1−/− cells with respect to WT chimera cells in each of the clusters. Below are the absolute numbers of cells resulting from the injected Tal1−/− cells (red) and from the host WT (black). f, Heatmap illustrating the row-normalised expression of genes upregulated in EC3-mapped Tal1−/− cells. From left to right, columns represent a sample of atlas cardiomyocytes (CM) (200 cells), Tal1−/− EC3 (328 cells), (3) WT EC3 (23 cells) and (4) atlas EC3 cells (107 cells). Illustrative genes have been manually selected from the full heatmap shown in Extended Data Fig. 8a.
Comparisons between WT and Tal1−/− chimeric cells mapped to the landscape defined in Fig. 3a illustrated that TAL1 depletion disrupts the emergence of primitive erythroid cells as well as our newly characterised megakaryocyte and myeloid cells (Fig. 4c). Although a subset of Tal1−/− cells were mapped to the haemogenic endothelial groups EC6 and EC7, they did not express genes associated with blood development, such as Itga2b or the known TAL1 target gene Cbfa2t3 (Eto2), in contrast to the host WT cells, supporting the disruption of the second haematopoietic wave upon TAL1 depletion (Fig. 4d).
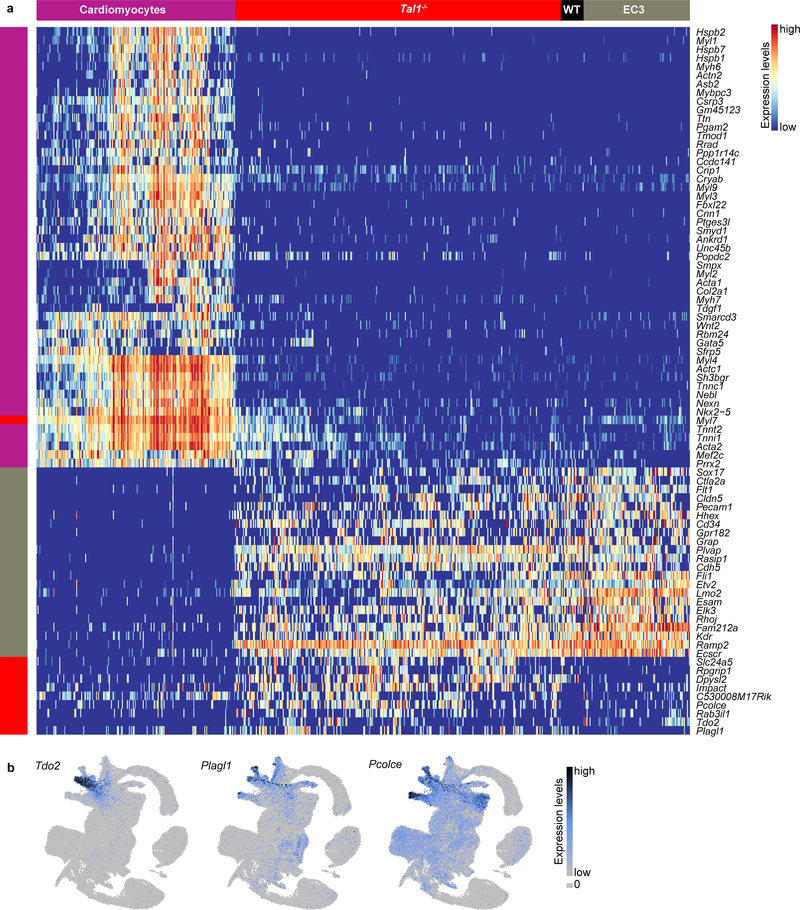
To further characterise the developmental block in the second haematopoietic wave, we quantified the relative contributions of Tal1−/− and WT chimeric cells to each “EC” and “Haem” cluster described in Fig. 3 (Fig. 4e; Supplementary Information Table 3). Interestingly, E8.5 Tal1−/− cells were more abundant than the WT cells in EC3, one of the earliest-appearing endothelial sub-clusters (Fig. 3b). While mutant cells might simply accumulate in this state, Tal1−/− cells mapped to EC3 may alternatively acquire a novel transcriptional state, which is similar but not identical to EC3. To clarify this, we performed differential expression analyses comparing EC3-mapped Tal1−/− cells to their most similar cells in the reference atlas, and to the WT host chimeric cells mapped to EC3. Interestingly, we observed a small set of genes specifically upregulated in EC3-mapped Tal1−/− cells, including Pcolce, Tdo2 and Plagl1 (Fig. 4f; Extended Data Fig. 8a). When inspecting expression of these genes in our atlas, we observed high expression in the mesenchyme and other mesoderm clusters, such as the allantois, paraxial, pharyngeal and intermediate mesoderm (Extended Data Fig. 8b). Moreover, we noted that a subset of these cells also upregulated cardiac-related genes, such as Nkx2–5, Mef2c and Tnnt2 (Fig. 4f), consistent with a previous report that Tal1−/− YS cells can adopt a cardiomyocyte- like phenotype33. However, these cells did not present a full cardiomyocyte transcriptional program and continued to express endothelial genes such as Esam and Sox17, albeit with some down-regulation compared to their EC3 atlas counterparts. These results suggest that Tal1 disruption blocks cells at a transcriptional state similar to that of the EC3 cluster during the second wave of blood development. Moreover, when unable to proceed towards a haemogenic phenotype, EC3-mapped Tal1−/− cells begin to activate other mesodermal programs. This is consistent with prior evidence that haematopoietic precursors isolated from E7.5 mouse embryos are endowed with mesodermal plasticity when cultured ex vivo34.
Discussion
Our comprehensive atlas of mouse gastrulation and early organogenesis offers a powerful resource for investigating the molecular underpinnings of cell fate decisions during this key period of mammalian development. We exploited this resource by investigating two specific developmental phenomena: the transdifferentiation process of visceral endoderm cells contributing to the composition of the embryonic gut, and the emergence of rare blood cells in the early embryo. Moreover, we used our atlas as a reference for the analysis of Tal1−/− mutant chimeric embryos, which highlighted where TAL1 is critical for progression into the blood lineage, and also identified a novel transcriptional state unique to Tal1−/− cells, where genes from multiple different mesodermal tissues are expressed alongside endothelial genes.
More broadly, our chimera analysis illustrates the utility and efficiency of such a model for studying the molecular and cellular consequences of a wide range of developmental mutants, including those that are embryonically lethal and relevant for human developmental disorders. In sum, our work, in a widely-used and experimentally relevant mammalian system, complements recent single-cell expression profiling surveys in early zebrafish and Xenopus embryos35–37. Collectively, these studies demonstrate that densely sampled large-scale single-cell profiling has the potential to advance our understanding of embryonic development in vertebrates.
Methods
Embryo collection and sequencing
All procedures were performed in strict accordance to the UK Home Office regulations for animal research. Chimeric mouse embryos were generated under the project licence number PPL 70/8406.
Reference atlas
Pregnant C57BL/6 mouse females were purchased from Charles River and delivered one day before or on the day of embryo harvest. Mouse embryos were dissected at time-points E6.5, E6.75. E7.0, E7.25, E7.5, E7.75, E8.0, E8.25 and E8.5. As previously reported6, development can proceed at different speeds between embryos, even within the same litter (Fig. 1a; Extended Data Fig. 1). Consequently, we adopted careful staging by morphology (Downs and Davies staging6) to exclude clear outliers. Following euthanasia of the females using cervical dislocation, the uteri were collected into PBS with 2% heat-inactivated FCS and the embryos were immediately dissected and processed for scRNA-seq. Two samples contained pooled embryos staged across several time-points. Cells from these samples are denoted as “Mixed” in Figures, and “mixed_gastrulation” in Supplementary Information Table 4. Embryos from the same stage were pooled to make individual 10X samples, and single-cell suspensions were prepared by incubating the embryos with TrypLE Express dissociation reagent (Life Technologies) at 37 °C for 7 min and quenching with heat inactivated serum. The resulting single-cell suspension was washed and resuspended in PBS with 0.4% BSA, and filtered through a Flowmi Tip Strainer with 40 μm porosity (ThermoFisher Scientific, #136800040). Cell counts were then assessed with a haemocytometer. scRNA-seq libraries were subsequently generated using the 10X Genomics Chromium system (version 1 chemistry) and samples were sequenced according to the manufacturer’s instructions on an Illumina HiSeq 2500 platform. Supplementary Information Table 1 contains detailed information on embryo collection, and Supplementary Information Table 4 contains metadata for each sequenced cell. Sample sizes were chosen to maximise the number of recovered cells from each experiment and to obtain total cell numbers similar to the estimated cell numbers in mouse embryos at their respective stages. The sample sizes were also dependent on the number of viable embryos from each litter. Cells were partitioned to prevent overloading of a single 10X lane.
Yolk sac, allantois and embryo proper EC dissection experiment
Mice were bred and maintained at the University of Cambridge, in individually ventilated cages with sterile bedding; sterile food and water were provided ad libitum. All animals were kept in pathogen-free conditions. Timed-matings were set up between C57BL/6 mice, purchased from Charles River. Upon dissection, only embryos staged as Theiler Stage 12 were further processed. Allantois, yolk sac and embryo proper were dissected and placed into separate tubes. Single-cell suspensions were prepared by incubating the embryos with TrypLE Express dissociation reagent (Life Technologies) at 37°C for 7 min and quenching with heat inactivated serum. Single cells were subsequently stained with Flk1-PE antibody (1:100; Biolegend, cat# 12–5821-83, clone Avas12a1, lot# E01819–1631) and DAPI as viability stain (1 μg/ml; Sigma). Live FLK1+ cells were isolated by fluorescence-activated cell sorting (FACS) using a BD Influx sorter into individual wells of a 96-well plate containing lysis buffer (0.2% (v/v) Triton X-100 and 2 U/μl SUPERase-In (Invitrogen, #AM2696) and stored at −80 °C (1 plate per tissue was prepared). Plates were processed following the Smart-seq2 protocol as previously described23 and libraries were generated using the Illumina Nextera XT DNA preparation kit. Libraries were pooled and sequenced on an Illumina HiSeq 4000. Sample sizes were chosen based on the amount of viable endothelial cells recovered from the experiment and we aimed to have an equal (or very similar) number of endothelial cells from each of the dissected regions that was large enough (i.e. 96 per sample) to infer correlations with the atlas dataset.
Flow cytometry analysis of myeloid progenitors
Mice and embryos were obtained as above (Yolk sac, allantois and embryo proper EC dissection experiment). Yolk sac, allantois, amnion, head, heart and trunk were dissected and placed into separate tubes. Single-cell suspensions were prepared as above (Yolk sac, allantois and embryo proper EC dissection experiment). Single cells were subsequently stained with CD16/32-BV711 (1:200; Biolegend, cat# 101337, clone 93, lot# B251800) for 20 min at 4°C, washed with 2 ml PBS+2%FCS, blocked with Fc block CD16/32 (1:100; eBioscience, cat# 14–0161-85, clone 93, lot# E03558–1640) and stained with CSF1R-BV605 (1:800; Biolegend; cat# 135517, clone AFS98, lot# B196541) for 30 minutes at 4°C. Cells were then washed and 7AAD was added as a viability stain (1:200; BD Pharmigen; cat# 51–68981E, lot# 7061885). Cells were analysed using a BD Fortessa cytometer. Gates were established using Fluorescence Minus One (FMO) controls. Two biological replicates were performed: one pool of 12 and one pool of 13 embryos.
Ttr-YFP embryo staining
Ttr::Cre stud male mice9 were crossed with R26R-YFP females39. Dissected E8.5 embryos were fixed for 1 hour at room temperature with 4% paraformaldehyde (PFA) in Phosphate buffered saline (PBS). The embryos were then washed 3 times in PBS with 0.1% Triton X-100 (PBT-0.1%) for 15 minutes, permeabilised in PBT-0.25% for 40 minutes and washed again 3 times in PBT-0.1%. The embryos were transferred to blocking solution (5% donkey serum (Sigma, #D9663), 1% Bovine Serum Albumin (Sigma, #A7906) in PBT-0.1%) overnight (o/n) at 4°C. Primary antibody (Chicken Anti-GFP; 1:100; Abcam, cat# ab13970, Lot# GR3190550–2) was then added in blocking solution and incubated o/n at 4°C. The embryos were washed 3 times in PBT-0.1% and incubated o/n at 4°C in PBT-0.1% with the secondary antibody (Goat Anti-chicken 488; Sigma; 1:100; cat# A11039; Lot# 1899514) and Phalloidin 555 (1:100; Sigma; #19083), then subsequently washed 3 times PBT-0.1% for 15 min and mounted in Vectashield mounting media with DAPI for at least 24 hrs at 4°C. Images were captured using a Zeiss 880 confocal microscope.
Chimera generation and sequencing
TdTomato-expressing mouse embryonic stem cells (ESC) were derived as previously described40 from E3.5 blastocysts obtained by crossing a male ROSA26tdTomato (Jax Labs - 007905) with a wildtype C57BL/6 female. The cells were negative for mycoplasma contamination. The cells were expanded under the 2i+LIF conditions41 and transiently transfected with a Cre-IRES-GFP plasmid42 using Lipofectamine 3000 Transfection Reagent (ThermoFisher Scientific, #L3000008) according to manufacturer’s instructions. Single GFP+ cells were sorted 48h post-transfection into 96-well plates. Individual clones were allowed to grow and were manually picked for expansion. A tdTomato-positive, male, karyotypically normal line, competent for chimera generation as assessed using morula aggregation assay, was selected for targeting Tal1. Two guides targeting exon 4 were designed using the http://crispr.mit.edu tool (guide 1: GAACCCACTATGGAAAGAGA; guide 2: GAGGCCCTCCCCATATGAGA) and were cloned into the pX458 plasmid (Addgene, #48138) as previously described43. The resulting plasmids were then used to transfect the cells as detailed above. Single transfected clones were expanded and assessed for Cas9-induced mutations. Genomic DNA was isolated by incubating cell pellets in 0.1 mg/ml of Proteinase K (Sigma, #03115828001) in TE buffer at 50°C for 2 hrs, followed by 5 min at 99°C. The sequence flanking the guide-targeted sites was amplified from the genomic DNA by polymerase chain reaction (PCR) in a Biometra T3000 Thermocycler (30 sec at 98°C; 30 cycles of 10 sec at 98°C, 20 sec at 58°C, 20 sec at 72°C; and elongation for 7 min at 72°C) using the Phusion High-Fidelity DNA Polymerase (NEB, #M0530S) according to the manufacturer’s instructions. Primers including Nextera overhangs were used (F-GTCTCGTGGGCTCGGAGATGTGTATAAGAGACAGTTGCCCCTCCCATTTATGTA R-TCGTCGGCAGCGTCAGATGTGTATAAGAGACAGGAGTTCCAAGCCAGCATTTT), allowing library preparation with the Nextera XT Kit (Illumina, #15052163), and sequencing was performed using the Illumina MiSeq system according to manufacturer’s instructions. An ESC clone showing a 77 base-pair deletion in exon 4 inactivating Tal1 gene expression was then injected into C57BL/6 E3.5 blastocysts. Chimeric embryos were subsequently transferred into recipient females at 0.5 days of pseudopregnancy following mating with vasectomised males, as described previously44.
Chimeric embryos were harvested at E8.5 (7 embryos), dissected, and single-cell suspensions were generated from pooled embryos as described above. Given the low detection rate of the tdTomato transcript (Extended Data Fig. 7b), single-cell suspensions were sorted into tdTomato+ and tdTomato− samples using a BD Influx sorter with DAPI at 1μg/ml (Sigma) as a viability stain for subsequent 10X scRNA-seq library preparation (version 2 chemistry) and sequencing on an Illumina HiSeq 4000 platform, which resulted in 27,817 tdTomato− and 28,305 tdTomato+ cells that passed quality control (see below). Supplementary Information Table 5 contains metadata for each sequenced cell. Flow cytometry of chimeric embryos was performed in parallel using a BD Fortessa cytometer. Cells were stained with the conjugated antibodies CD45-APC-Cy7 (1:200; BD Pharmingen, cat# 557659, clone 30-F11, lot# 6126662), CD41-BV421 (1:200; Biolegend, cat# 133911, clone MWReg30, lot# B216311), Ter119-PerCP-Cy5 (1:200; Biolegend, cat# 116227, clone TER-119, lot# B169767) and CD71-FITC (1:400; BD Pharmingen, cat# 553266, clone C2, lot# 2307673) with Fc block CD16/32 (1:100; eBioscience, cat# 14–0161-85, clone 93, lot# 4316103), and DAPI at 1μg/ml (Sigma) as a viability stain. For the wildtype-into-wildtype experiment, a parental tdTomato+ Tal1+I+ line was injected into C57BL/6 E3.5 blastocysts and processed as for the Tal1−/− samples. Three pooled embryos were used for scRNA-seq, and 1,077 tdTomato− and 2,454 tdTomato+ cells passed quality control (Supplementary Information Table 6). Chimera sample sizes were dependent on the number of viable embryos that did not show excessive global biases towards host or injected cells (i.e. very low or high fluorescence). Two E9.5 embryos were individually analysed by flow cytometry as described above.
10X data pre-processing
Raw files were processed with CellRanger 2.1.1 using default mapping arguments, with reads mapped to the mm10 genome and counted with GRCm38.92 annotation, including tdTomato sequence for chimera cells. HTML reports that provide code, greater detail, and diagnostic plots for the following steps are available at https://github.com/MarioniLab/EmbryoTimecourse2018. Singularity containers are also available, providing direct access to the same software versions that were used in this analysis. Swapped molecule removal. Molecule counts that derived from barcode swapping were removed from all 10X samples by applying the DropletUtils function swappedDrops (default parameters) to groups of samples (where a sample is a single lane of a 10X Chromium chip) that were multiplexed for sequencing. Cell calling. Cell barcodes that were associated with real cell transcriptomes were identified using emptyDrops45, which assesses whether the RNA content associated with a cell barcode is statistically significantly distinct from the ambient background RNA present within each sample. A minimum UMI threshold was set at 5,000, and cells with an adjusted p-value <0.01 (BH-corrected) were considered for further analysis. The ambient RNA profile was determined from barcodes associated with fewer than 100 UMIs for the atlas, and 60 UMIs for the chimeras. We reproduced our analysis pipeline with a lower UMI threshold of 1,000, and found that no new cell types were present, justifying our rigorous threshold (Extended Data Fig. 2c). Quality control. Cell libraries with low complexity (<1000 expressed genes) were excluded. Cells with mitochondrial gene expression fractions greater than 2.37%, 2.18%, and 3.35% for each of the wildtype atlas, Tal1−/− chimeras, and WT chimeras, respectively, were excluded. The thresholds were determined by considering a median-centred MAD-variance normal distribution; cells with mitochondrial read fraction “outside” of the upper end of this distribution were excluded (adjusted p-value < 0.05; BH-corrected). Normalisation. Transcriptome size factors were calculated for each dataset separately (atlas, Tal1−/− chimeras, WT chimeras), using computeSumFactors from the R scran package46. Cells were pre-clustered with scran’s quickCluster function (using the igraph method), with minimum and maximum cluster sizes of 100 and 3,000 cells, respectively. Raw counts for each cell were divided by their size factors, and the resulting normalised counts were used for further processing. Selection of highly variable genes (HVGs).HVGs were calculated using trendVar and decomposeVar from the scran R package, with loess span 0.05. Genes that had significantly higher variance than the fitted trend (BH-corrected p < 0.05) were retained. Genes with mean log2 normalised count <10−3, genes on the Y chromosome, Xist, and td-Tomato (where applicable) were excluded. Batch correction. Batch-effects were removed using the fastMNN function in scran on 50 PCs computed from the HVGs only. Correction was performed first between the samples of each time-point, merging sequentially from the samples containing the most cells to the samples containing the least. Time-points were then merged from oldest to youngest; the mixed time-point was merged between E7.25 and E7.0 (Extended Data Fig. 2d). This was applied on the whole atlas dataset, and separately on the subsets of cells considered in Figures 2 and 3 for their respective analyses. Euclidean distances calculated from this batch-corrected PCA were used for all further analysis steps e.g., nearest-neighbour graphs. Doublet removal. First, a doublet score was computed for each cell by applying the doubletCells function (scran R package) to each 10X sample separately. This function returns the density of simulated doublets around each cell, normalised by the density of observed cell libraries. High scores indicate high doublet probability. We next identified clusters of cells in each sample by computing the first 50 principal components across all genes, building a shared nearest-neighbour graph (10 nearest neighbours; buildSNNGraph function; scran R package), and applying the Louvain clustering algorithm (cluster_louvain function; igraph R package; default parameters) to it. Only HVGs (calculated separately for each sample) were used for the clustering. This procedure was repeated in each identified cluster to break the data into smaller clusters, ensuring that small regions of high doublet density were not clustered with large numbers of singlets. For each cluster, the median doublet score was considered as a summary of the scores of its cells, as clusters with a high median score are likely to contain mostly doublets. Doublet calls were made in each sample by considering a null distribution for the scores of a median-centred MAD-variance normal distribution, separately for each sample. The MAD estimate was calculated only on values above the median to avoid the effects of zero-truncation, as doublet scores cannot be less than zero. All cells in clusters with median score at the extreme upper end of this distribution (BH-corrected p < 0.1) were labelled as doublets. A final clustering step was performed across all samples together to identify cells that shared transcriptional profiles with called doublets, but escaped identification in their own samples. Clusters were defined using the same procedure as applied to each sample with the exceptions that sub-clustering was not performed, and batch-corrected principal components were used (see Batch correction, above). To identify clusters that contained more doublets than expected, we considered for each cluster the fraction of cell libraries that were called as doublets in their own samples. We modelled a null distribution for this fraction using a median-centred, MAD-estimated variance normal distribution as described for the median doublet score in each sample, above, and called doublets from the distribution as in each sample, above. Stripped nucleus removal. Five of the clusters found in the across-sample clustering step above (Doublet removal) contained cells with considerably lower mitochondrial gene expression and smaller total UMI counts compared to other clusters. We considered these clusters to consist of nuclei that had been stripped of their cytoplasm in the 10X droplets, and excluded them from downstream analyses due to their supposed technically-derived signal. Density estimation. The density of cells in gene expression space was calculated using a tricube kernel on the top 50 batch-corrected principal components. The median distance of all cells to their 50th nearest neighbour was used to define the maximum distance for the kernel.
Smart-seq2 data pre-processing
Mapping. Reads were mapped to the mm10 genome using GSNAP47 (version 2015–09-29) with default arguments except batch=5. HTSeq48 was subsequently used to count the number of reads mapped to each gene using GRCm38.92 for annotation. Quality control. Three criteria were used to identify and discard poor-quality cells: (1) Number of mapped reads to nuclear genes < 50,000; (2) number of genes detected < 4,000; (3) proportion of reads mapping to mitochondrial genes > 10%. Cell libraries for which any of these criteria were met were discarded. Of the 288 cell libraries prepared, 250 passed our quality control. Normalisation. Cells were size-factor normalised as above (scran).
Visualisation
UMAPs were calculated using Scanpy 1.2.249 (scanpy.api.tl.umap), considering the 20 nearest neighbours in the batch-corrected PCA, with default parameters except for min.dist = 0.7. Force-directed graphs considered the 10 nearest neighbours of each cell in a 15-dimension diffusion space calculated on the first 50 PCs of the HVG-subset data (using Scanpy v1.2.2 function tl.diffmap and Scanpy v0.4.449 function utils.comp_distance). Edges were unweighted, and the layouts were generated in Gephi v0.9.250 using the ForceAtlas2 algorithm51. Endoderm diffusion maps were calculated using the R package destiny, with function DiffusionMap, using default settings, from batch-corrected PC coordinates. Graph abstraction52 was computed using the tl.aga function from Scanpy v1.2.2 and edges were drawn using the adjacency confidence matrix. For Extended Data Fig. 3e–f, graph abstraction was computed on the clusters annotated in Fig. 1c and with the threshold for connection of clusters set to 0.23. For Fig. 3b, the clusters in Fig. 3a were used, and the threshold was set to 0.2. For Extended Data Fig. 5a (top), a threshold of 0.95 was used and for Extended Data Fig. 5a (bottom), a threshold of 0.45 was applied. The generation of the clusters for these two latter plots is described in the Endoderm analysis section.
Clustering and cell annotation
A shared nearest neighbour graph (considering the 10 neighbours of each cell) was constructed using the 50 batch-corrected PCs of the HVG-subset expression data using Euclidean distance (buildSNNGraph, R package scran). Clusters were called from this graph using the Louvain algorithm (cluster_louvain with default parameters, R package igraph). To identify finer substructure from these top-level clusters, each cluster underwent a second round of clustering using the same method as above with the same batch-corrected PC coordinates (i.e., by subsetting from the batch- corrected coordinates). Graph abstraction was then used to assess the connectivity across all sub-clusters in the dataset. Within each top-level cluster, we considered distances between the sub-clusters based on their graph abstraction connectivity. Specifically, for a connectivity confidence score between clusters of x, we considered a distance of 1-x. Ward-linkage hierarchical clustering was performed to evaluate sub-cluster relatedness (scipy.cluster.hierarchy module, Python 3.4). Sub-clusters with distances less than 1.6 were merged. The merged sub-clusters were then annotated by examination of marker gene expression. Sub-clusters without a unique identity according to marker gene expression were manually merged with their closest sub-cluster to form final cell type annotations. Unannotated sub-clusters (i.e., before merging) are available in Supplementary Information Table 4. Stability of the atlas under downsampling. To test stability of the atlas with regard to the size of the dataset, we sampled with replacement cell type labels from the atlas dataset. We performed 50 samplings for each of the sizes of sample (1,000–116,312). For each of these sizes, we calculated for each cell type the ratio of standard deviation of cell type label frequency by mean cell type frequency. The ratios are shown in Extended Data Figure 3d. Note that when the atlas is downsampled to less than half its full size (50,000 cells), the standard deviation of cell-type frequency remains less than 10% of the mean for all cell types.
Endoderm analysis
Cell selection. Cell types annotated as anterior primitive streak, definitive endoderm, visceral endoderm and gut were selected for further analysis. A batch-correction was computed for this cell set, using the same method as described above. Annotation of the gut. Cells with the “Gut” cell type label from the collection time-points E8.5 and E8.25 were selected. We constructed a shared nearest-neighbour graph on their batch-corrected PC coordinates (i.e., by subsetting from the coordinates from the endoderm-specific correction; buildSNNGraph function; scran R package; 10 nearest neighbours), and clustered cells using the Louvain algorithm (cluster_louvain function; igraph R package; default parameters). Gut tube pseudospatial ordering. E8.5 cells from the gut clusters (Fig. 2c) were selected and a diffusion map was constructed from their batch-corrected PC coordinates. DPT was calculated for each cell starting from the pharyngeal endoderm cell with minimum value on DC2. Differential expression analyses were performed using the findMarkers function in scran, using the 10X sample as a blocking factor. Significantly differentially expressed genes were considered as those with BH-corrected p<0.1. Hindgut differentially expressed genes were tested against an absolute fold-change of 0.5. Transport maps16. This approach considers each cell as a unit of mass, to be “transported” to other cells at consecutive time-points. By seeking to move these masses efficiently between time-points (i.e., minimising the transcriptional differences between cells across which mass is moved) a mapping of expected descendant and ancestor cells can be identified. Importantly, this method allows the integration of both transcriptional and collection time-point information. Transport maps were constructed using the wot python package (v0.2.1) using default settings except for skipping the dimension-reduction step, and instead using the batch-corrected PCs as input. 100 randomly selected cells from each collection time-point of ExE endoderm were added to the cells projected in Fig. 2c (Extended Data Fig. 4h). Cells from the mixed time-points were excluded from the analysis. Selecting cells for trajectories with the transport maps. For pushing mass forward through the graph (i.e., considering from which progenitor cells the gut clusters derived), we considered two starting populations. The DE population consisted of E7.0 cells labelled as anterior primitive streak or definitive endoderm; the VE population consisted of E7.0 cells labelled as visceral endoderm. This stage was selected because the two populations still retained very distinct transcriptional profiles, and many cells were present for each population. For pulling mass backward through the graph (i.e., selecting cells for the DE-Hindgut 2 and VE-Hindgut 1 trajectories), we considered E8.5 cells from each of the gut clusters as terminal populations. For the cells in the VE-Hindgut 1 trajectory, we included all cells whose largest mass contribution was to the Hindgut 1 cluster. For cells in the DE-Hindgut 2 trajectory, we selected cells whose Hindgut 2 mass contribution was greater than 90% their largest mass contribution to any cluster. This allows selection of cells committed to Hindgut 2 (i.e., with greatest mass towards Hindgut 2), and common progenitor cells, which show relatively balanced mass contributions to several terminal clusters. Cells with balanced mass contributions across clusters were not observed for the VE-Hindgut 1 trajectory, consistent with the hindward bias of the intercalated visceral endoderm cells. Selecting cells for trajectories with graph abstraction. A shared 10-nearest neighbour graph was constructed on the endoderm cell subset using the first 50 PCs of the HVG-subset expression data using Euclidean distance (buildSNNGraph, R package scran). Clusters were called from this graph using the Louvain algorithm (cluster_louvain with default parameters, R package igraph). Clusters that presented more substructure in the force-directed layout were further subclustered using the same pipeline. Cells were selected based on a manually curated parsimonious trajectory connecting Hindgut 1 or 2 to the appropriate progenitor populations (Extended Data Fig. 5a, b). Hindgut trajectories and gut pseudospace ordering. Genes were clustered as in5 with some modifications. First, cells were ordered using DPT, calculated from a diffusion map built from the endoderm-specific batch-corrected PC coordinates of the relevant subset of cells. DPT was calculated from a cell with the most extreme value on DC1; direction along DC1 was selected to start from the youngest populations of cells. HVGs were calculated for each cell subset, with only these genes retained for subsequent clustering. For each retained gene, we fitted two ordinary least squares linear models (constant and degree-2 polynomial functions) that regress the log2 normalised expression levels for each cell against the values of DPT calculated above. Genes for which the degree-2 polynomial fit the data better were retained (F-test, BH-corrected p < 0.05, R function anova.lm). For each of these genes, we fitted a local regression to the expression level for each cell at their value of DPT (R function loess, span = 0.75). We then identified the predicted value of the loess fit for one thousand uniformly spaced points across the DPT to provide smoothed gene expression estimates and avoid biasing clustering to regions of DPT with high cell density. loess fits were scaled to a range of (0,1) to prevent clustering by expression level. The Pearson correlation distance between each gene was calculated as ([1-x]/2)0.5, where x is the Pearson correlation, and hierarchical clustering (UPGMA) was performed. The tree was cut with dynamicTreeCut (R; minimum cluster size of 50 genes, otherwise default parameters).
Blood development analysis
Cell clustering. A 10-nearest neighbour graph was constructed on the haemato-endothelial cell subset using the first 50 PCs of the HVG-subset expression data and Euclidean distance (buildKNNGraph, R package scran). Clusters were called from this graph using the Louvain algorithm (cluster_louvain with default parameters, R package igraph). Two clusters that presented higher substructure in the force-directed layout (one in EC, containing EC3–8; and one in the Haem/BP region, containing Haem3–4, BP3–4, My and Mk) were further subclustered using the same pipeline but different k values: k=30 for EC cluster and k=15 for Haem/BP cluster. Differential expression analyses. Pairwise comparisons were performed using edgeR53. Dispersions were estimated using estimateCommonDisp and estimateTagwiseDisp, tests with exactTest function and p-values BH-corrected. All functions were used with default parameters. Mapping of Smart-seq2 data to the reference atlas. The Spearman correlation distance, ([1-x]/2)0.5, was computed between each cell in the Smart-seq2 dataset and each cell in the endothelium cluster from the 10X atlas using the HVGs computed for the EC clusters of Fig. 3. The labels of the atlas endothelial cells were defined as the most frequent dissection location within the 5 nearest neighbours. If cells had an equal number of neighbours from two locations, they remained unassigned. Mapping of published embryonic blood dataset54. To support the annotation of the myeloid cluster, atlas cells from Fig. 3a were mapped to a published dataset containing haematopoietic cells collected between E9.5 and E11.5 (Extended Data Fig. 6g). The mapping was performed as with the Smart-seq2 dataset, using the HVGs computed for the published dataset54. The published dataset was processed as follows: The counts matrix with transcript counts per million (TPM) was downloaded from GEO accession GSE87038. Counts were log transformed as log2 (n/10 + 1) where n is the TPM value, and HVGs were calculated as in55. Since cluster identities from 54 were not provided, the data was re-clustered using Louvain clustering on a k-nearest neighbour graph with k=10 considering only the HVGs. Clusters were subsequently merged to approximate the clusters and expression patterns of marker genes shown in Figure 8 of54.
Tal1−/− chimera analysis
Mapping to the atlas. To avoid mapping biases that derive from unequal numbers of atlas cells at each collection time-point, each stage of the atlas was sub-sampled at random such that 10,000 cell libraries (i.e., including doublets and stripped nuclei) were present at each time-point. Cells from the mixed time-point were excluded. Stages E6.5 and E6.75 contained fewer cells (3,697 and 2,169 respectively) and were not downsampled; however, we do not expect cells from E8.5 chimera to map to these time-points, so their cell number bias is likely to be unimportant. We first constructed a 50-dimensional PC space from the combined normalised log-counts of subsampled atlas cells (including doublets and stripped nuclei) and the cells from the samples that are to be mapped to the atlas. Batch-correction was then performed on the atlas cells in the PC space, as described above (Batch correction), to construct a single reference manifold for mapping. Samples to be mapped were then independently merged with the newly-corrected atlas data (scran function fastMNN), and the 10 nearest cells (Euclidean distance) in the atlas to each chimera cell were recorded. Mapped time-point and cell type of chimera cells were defined as the mode of those of its nearest-neighbours. Ties were broken by choosing the stage or cell type of the cell that had the lowest distance to the chimera cell. Cells that mapped to doublet- or stripped nucleus-labelled cells were excluded from downstream analyses. The robustness of this mapping was assessed by mapping one entire biological replicate of E8.0 cells onto the atlas, having removed these cells from the reference. 89.4% of these cells correctly mapped to their annotated cell type (Extended Data Fig. 7c), and 29.2% to the correct time-point (Extended Data Fig. 7d; 83.1% of cells mapped within one time-point in either direction). Visualisation. UMAP visualisation of the data was performed as described above, using 50 batch-corrected PCs. Batches of cells of the same genotype were merged first, followed by merging across genotypes. To show the cell mapping with respect to atlas landscapes (e.g. Fig. 4b), we coloured cells in the visualisation by the closest atlas cell for each chimera cell after mapping. Remapping of cells to the haemato-endothelial landscape. To ensure that we utilised the full resolution of our atlas, a subset of chimera cells were mapped to the complete (i.e., not subsampled) atlas dataset for the relevant cell types. The mapping procedure was repeated as described above, only for atlas and chimera cells from the erythroid, haemato-endothelial, blood progenitor, endothelial and mixed mesoderm cell types. No downsampling was performed. Relative contributions to atlas clusters from injected and host cells in the Tal1−/− chimera. To compare the frequency of cells that contribute from each of the host and injected populations of cells to atlas clusters, we first corrected for compositional differences between the populations: ExE endoderm, Visceral endoderm, ExE ectoderm, Parietal endoderm, Blood Progenitors 1–3 and Erythroid 1–3 were excluded from this analysis, as the injected (Tal1−/−) cells cannot contribute to these lineages. The frequency of cells from each subcluster was then calculated and log-fold change calculated (Fig. 4e). Due to the absence of cells in the Tal1−/− samples, BP and Ery sub-clusters were not considered. Differential expression analyses were performed as in the “Blood development analysis” section.
Extended Data
Extended Data Figure 1: Embryo images.
Representative images of embryos collected at the time-points indicated in the Figure. Scale bars: 0.25mm.
Extended Data Figure 2: Data quality control.
a, Left: Estimated number of cells present in a single mouse embryo at each time-point. Points are values measured in24; line is an Ordinary Least Squares regression fit. Right: Number of cells captured in this study compared to the number of cells estimated in the embryo in (Left). b, Violin plots illustrating the number of detected genes (top) and Unique Molecular Identifiers (UMIs, bottom) per cell per sample. Sample 11 failed quality control and is therefore not shown. Sample details are provided in Supplementary Information Table 1. c, UMAP highlighting additional cells identified considering a reduced UMI threshold of 1,000. Additional cells are shown in black. Cells from the atlas are shown in the colour corresponding to their cell type (Fig. 1c). Note that all additional cells are present alongside cells from the atlas: no new cell types are found. d, UMAP as shown in Fig. 1c with cells coloured by biological replicate, showing consistency between samples collected at the same time-point. e, Mean gene expression of diagnostic markers (y-axis) for each cell type (x-axis) are shown. Genes are row-normalised.
Extended Data Figure 3: Lineage progression.
a, UMAP as shown in Fig. 1c, coloured by the density of each cell in gene expression space; brighter coloured regions (towards yellow) are more densely sampled, while darker regions (towards blue) are more sparsely sampled relative to other regions in the atlas. b, Boxplots summarising the density per cell type. Values are log-transformed. c, UMAPs as shown in Fig. 1c, highlighting cells from each sampled time-point illustrating the transcriptional progression along developmental time. d, Results of atlas stability testing (see Methods). y-axis: ratio of standard deviation of cell type frequency by the mean cell-type frequency at different degrees of downsampling. Note that when the atlas is downsampled to less than half its full size (50,000 cells), the standard deviation remains less than 10% of the mean for all cell types. e, f, Abstracted graphs, which quantify the degree of similarity between the identified clusters to represent the underlying biological structure of the dataset. Nodes correspond to the annotated cell types, and edges reflect the confidence of adjacency between clusters (thicker edges indicate higher confidence). Node sizes increase as a function of the number of cells within each cluster. Nodes in (e) are coloured and numbered according to the legend shown in Fig. 1c. Nodes in (f) show the frequency of cells from each time-point, excluding two samples of mixed time-point embryos.
Extended Data Figure 4: Endoderm convergence.
a, Schematic representing the process of definitive endoderm intercalation following gastrulation, and subsequent gut maturation. Adapted from9. b-g, Gene expression levels of Ttr (b), Mixl1 (c), Nkx2–5 (d), Pyy (e), Nepn (f), Cdx2 (g) overlaid on the Fig. 2a Force-directed graph. h, Diffusion map of cells selected for transport map construction; cells selected as termini for pulling mass backward through the transport maps are coloured. i, Results of pushing mass forward through the transport maps are shown on the force-directed layout. j, Violin plots showing expression levels of Trap1a and Rhox5 in all cell-types of the full atlas. k, Dorsal view of a whole-mount fluorescence image of a Ttr::Cre; R26R::YFP embryo at E8.5. Green: YFP, Red: Phalloidin. Arrowhead: increased Ttr-YFP staining in the posterior region of the gut. Scale bar: 300 μm.
Extended Data Figure 5: Endoderm trajectories.
a, Top: Graph abstraction of the endoderm landscape after fine sub-clustering as an alternative method to resolve which cells should be part of the VE-Hindgut 1 trajectory or the DE-Hindgut 2 trajectory (supporting transport maps; see Methods). Edges along VE-Hindgut 1 trajectory highlighted in yellow (nodes 1–4; yellow numbers. Edges along DE-Hindgut 2 trajectory highlighted in orange (nodes 1–12; orange numbers). Bottom: Graph abstraction with the subset of nodes related to the DE-Hindgut 2 trajectory to resolve the origin of cluster 4 (between 5 and 6 in top panel). Resulting DE-Hindgut2 trajectory includes clusters 1–4 and 6–9. The right hand panel overlays information about the composition of each cluster by developmental stage. b, Force-directed graph coloured by graph abstraction (PAGA) trajectories. Note that this independent approach for trajectory identification reaches very similar results to those inferred by transport maps in Fig. 2h. c, Gene-normalised dynamics of all clusters found along the VE-Hindgut 1 and the DE-Hindgut 2 trajectory (x-axis: DPT along the trajectory, y-axis: normalized expression levels). The black line is the mean fitted expression level across all genes in each cluster. Grey shading indicates the standard deviation along the trend across all genes in the cluster. Pink area highlights intercalation process; blue area highlights gut maturation steps. Dashed lines correspond to additional stages in the process deduced from the changes in gene expression trends. Points below the plots are the DPT coordinates of cells from each time-point coloured according to time-point as in Fig. 1f (from E6.5 in red to E8.5 in blue). d, Gene-normalised dynamics of VE genes along VE-Hindgut 1 trajectory indicating VE maturation prior to the intercalation stage. Plot design is as in (c); d-g: Below the x-axis, points are as in (c). e, Left: Venn diagram of genes up-regulated during the intercalation process in both VE-Hindgut 1 (in clusters 3, 5, 8, 11) and DE-Hindgut 2 (in clusters 4, 6, 7, 8, 9) trajectories. Listed genes: signature of epithelial remodelling in the overlapping fraction. Right: expression trends of illustrative genes along the trajectories (gene-normalised). f, Left: Venn diagram of genes up-regulated after the intercalation process in both trajectories (VE-Hindgut 1: clusters 1, 2, 5, 10; DE-Hindgut 2: clusters 1, 3, 5, 10); the overlapping fraction was enriched in transcription factors including a large subset of homeodomain proteins (listed). Right: gene-normalised dynamics of Hox and Cdx genes along the trajectories. g, Gene-normalised dynamics of transcription factors up-regulated specifically in the VE-Hingut 1 trajectory during endoderm intercalation.
Extended Data Figure 6: Blood development.
a, Diagram illustrating embryonic blood emergence from the two first waves. At E6.5, gastrulation begins. Using transplantation assays, it has been shown that the proximo-posterior epiblast cells closest to the primitive streak (PS) at this stage (red) mainly give rise to primitive erythroid cells in the YS, while the epiblast cells located in the middle of the embryo at E6.5 but closer to the PS at a later stage are enriched for endothelial progenitors56. At E7.5, blood islands are apparent (zoomed box of primitive blood wave), where primitive erythroid cells are surrounded by endothelium. At around E8.25, some endothelial cells (haemogenic endothelium) undergo an endothelial-to-haematopoietic transition and become Erythroid-Myeloid Progenitors (EMPs), which migrate to the foetal liver (FL) and give rise to definitive erythrocytes. Adapted from38. b, Force directed layout of Fig. 3a coloured by original clusters from Fig. 1c. c, Gene expression levels of Cdh5 and Pecam1 overlaid on the graph abstraction visualisation from Fig. 3b. d, Experimental design to isolate FLK1+ cells from yolk sac, allantois and embryo proper for Smart-seq2 scRNA-seq. e, Representative image of an embryo collected for the transcriptional analysis of endothelial cells from the yolk sac (YS), allantois (AL) and Embryo proper (EP). f, Sorting strategy of FLK1+ cells from YS, EP and AL on live cells (DAPI−). x-axis: FLK1 intensity. y-axis: DAPI intensity. g, Evidence to support myeloid annotation of My cluster in Fig. 3. Haemato-endothelial cells from Fig. 3a were mapped to a published dataset that profiled haematopoietic cells collected at E9.5, E10.5 and E11.5 from different organs54. Barplots show the fraction of atlas cells in the My cluster mapped to the clusters defined by Dong et al.54 Figure 8. h, Representative images of the dissected regions collected to study the location of CSF1R+CD16/32+ cells. Scale bar: 0.25mm. i, Flow cytometry plots indicating the frequency of CSF1R+CS16/32+ cells in each embryonic region. Two biological replicates were performed for this experiment: with pools of 12 and 13 embryos respectively. Plots illustrate one biological replicate.
Extended Data Figure 7: Analysis of Tal1−/− chimeras.
a, Representative chimera embryo harvested at E8.5 (left: brightfield, right: tdTomato fluorescence; scale bar: 0.25mm), and flow cytometry plot with tdTomato fluorescence distribution and sorting gates. b, Histograms showing the UMI counts for the tdTomato construct in both tdTomato− and tdTomato+ fractions in the Tal1−/− into WT experiment (see Methods). c-d, Control mapping results of an E8.0 biological replicate that was removed and mapped back to the atlas. c, Heatmap showing the fraction of cells of each labelled cell type that mapped to each cell type in the reference atlas. Numbers above columns indicate the number of cells in each category. 89.4% of these cells correctly mapped to their annotated cell type. d, Histogram showing the fraction of cells from the E8.0 biological replicate that mapped to each time-point in the reference. 29.2% of cells mapped to the correct timepoint, 83.1% of cells mapped within one time-point in either direction. e, Scatter plot comparing the percentage of tdTomato+ cells against tdTomato− for each cell type in both Tal1−/− into WT (left) and WT into WT (right) experiments. Black arrow: extra-embryonic tissues. White arrow: haematopoietic tissues. f, Force-directed graph of blood-related lineages from the atlas (Fig. 3), coloured by Tal1 expression levels. Darker colouring shows higher expression. g, Flow cytometry analysis of E8.5 Tal1−/− into WT chimeras showing the complete depletion of the haematopoietic markers CD41, CD45 (upper), as well as of the CD71+ Ter119+ erythroid fraction (lower) in Tal1−/− tdTomato+ cells (right panels). h, UMAPs of WT into WT experiment showing balanced contribution to all embryonic lineages. i, Flow cytometry analysis of WT into WT chimeras showing balanced contribution to the haematopoietic lineage from both tdTomato+ and tdTomato− cells at E9.5 (representative of 2 individual embryos).
Extended Data Figure 8: Transcriptional effects of disruption caused by Tal1.
a, Heatmap illustrating the row-normalised expression of genes upregulated in EC3-mapped Tal1−/− cells when compared to their closest neighbours in the atlas (labelled “EC3”) and EC3-mapped WT chimera cells (labelled “WT”). b, UMAPs as in Fig. 1c, showing the expression of Tdo2, Plagl1 and Pcolce.
Supplementary Material
Acknowledgements
We thank William Mansfield for blastocyst injections, Aaron T.L. Lun and Fiona Hamey for discussions concerning the analysis, Tina L. Hamilton for technical support in embryo collection, Sarah Kinston and Kenneth Jones for technical assistance, the Flow Cytometry Core Facility at CIMR for cell sorting, the CRUK-CI genomics core for the chimera scRNA-seq 10X libraries and for letting us use the 10X Chromium after hours, and the Wellcome Sanger Institute DNA Pipelines Operations for sequencing. We thank Kat Hadjantonakis for generously sharing the Ttr::Cre mouse line. Research in the authors’ laboratories is supported by the Wellcome, MRC, CRUK, Bloodwise, NIH-NIDDK; by core support grants from the Wellcome to the Cambridge Institute for Medical Research and Wellcome-MRC Cambridge Stem Cell Institute; and by core funding from Cancer Research UK and the European Molecular Biology Laboratory. B.P.-S. and D.L.L.H. are funded by the Wellcome Trust 4-Year PhD Programme in Stem Cell Biology and Medicine and the University of Cambridge, UK. D.L.L.H is also funded by the Cambridge Commonwealth European and International Trust. J.A.G. is funded by the Wellcome Trust Mathematical Genomics and Medicine Programme at the University of Cambridge [109081/Z/15/A]. C.G. is funded by the Swedish Research Council [2017-06278]. This work was funded as part of a Wellcome Strategic Award [105031/Z/14/Z] awarded to Wolf Reik, Berthold Göttgens, John Marioni, Jennifer Nichols, Ludovic Vallier, Shankar Srinivas, Benjamin Simons, Sarah Teichmann, and Thierry Voet, by Wellcome Trust grant [108438/Z/15] awarded to John Marioni and by a BBSRC grant [BBS/E/B/000C0421] awarded to Wolf Reik.
Footnotes
The authors declare no competing interests.
Data availability statement
Raw sequencing data is available on ArrayExpress: Atlas – E-MTAB-6967; Smart-seq2 endothelial cells – E-MTAB-6970; Tal1−/− chimeras – E-MTAB-7325; WT chimeras – E-MTAB-7324. Processed data may be downloaded following the instructions at https://github.com/MarioniLab/EmbryoTimecourse2018. GEO accession GSE87038 was used to support the annotation of myeloid cells (see Methods).All code is available upon request, and at https://github.com/MarioniLab/EmbryoTimecourse2018. Our atlas can be explored at https://marionilab.cruk.cam.ac.uk/MouseGastrulation2018/
References
- 1.Tam PPL & Behringer RR Mouse gastrulation: the formation of a mammalian body plan. Mech. Dev 68, 3–25 (1997). [DOI] [PubMed] [Google Scholar]
- 2.Loh KM et al. Mapping the Pairwise Choices Leading from Pluripotency to Human Bone, Heart, and Other Mesoderm Cell Types. Cell 166, 451–467 (2016). [DOI] [PMC free article] [PubMed] [Google Scholar]
- 3.Viotti M, Nowotschin S & Hadjantonakis A-K SOX17 links gut endoderm morphogenesis and germ layer segregation. Nat. Cell Biol 16, 1146–1156 (2014). [DOI] [PMC free article] [PubMed] [Google Scholar]
- 4.Lescroart F et al. Defining the earliest step of cardiovascular lineage segregation by single-cell RNA-seq. Science 359, 1177–1181 (2018). [DOI] [PMC free article] [PubMed] [Google Scholar]
- 5.Ibarra-Soria X et al. Defining murine organogenesis at single-cell resolution reveals a role for the leukotriene pathway in regulating blood progenitor formation. Nat. Cell Biol 20, 127 (2018). [DOI] [PMC free article] [PubMed] [Google Scholar]
- 6.Downs KM & Davies T Staging of gastrulating mouse embryos by morphological landmarks in the dissecting microscope. Development 118, 1255–1266 (1993). [DOI] [PubMed] [Google Scholar]
- 7.Koch F et al. Antagonistic Activities of Sox2 and Brachyury Control the Fate Choice of Neuro-Mesodermal Progenitors. Dev. Cell 42, 514–526.e517 (2017). [DOI] [PubMed] [Google Scholar]
- 8.Tzouanacou E, Wegener A, Wymeersch FJ, Wilson V & Nicolas J-F Redefining the Progression of Lineage Segregations during Mammalian Embryogenesis by Clonal Analysis. Dev. Cell 17, 365–376 (2009). [DOI] [PubMed] [Google Scholar]
- 9.Kwon GS, Viotti M & Hadjantonakis A-K The Endoderm of the Mouse Embryo Arises by Dynamic Widespread Intercalation of Embryonic and Extraembryonic Lineages. Dev. Cell 15, 509–520 (2008). [DOI] [PMC free article] [PubMed] [Google Scholar]
- 10.Finley KR, Tennessen J & Shawlot W The mouse secreted frizzled-related protein 5 gene is expressed in the anterior visceral endoderm and foregut endoderm during early post-implantation development. Gene Expr Patterns 3, 681–684 (2003). [DOI] [PubMed] [Google Scholar]
- 11.Makover A, Soprano DR, Wyatt ML & Goodman DS An in situ-hybridization study of the localization of retinol-binding protein and transthyretin messenger RNAs during fetal development in the rat. Differentiation 40, 17–25 (1989). [DOI] [PubMed] [Google Scholar]
- 12.Martinez Barbera JP et al. The homeobox gene Hex is required in definitive endodermal tissues for normal forebrain, liver and thyroid formation. Development 127, 2433–2445 (2000). [DOI] [PubMed] [Google Scholar]
- 13.Bosse A et al. Identification of the vertebrate Iroquois homeobox gene family with overlapping expression during early development of the nervous system. Mech. Dev 69, 169–181 (1997). [DOI] [PubMed] [Google Scholar]
- 14.Osipovich AB et al. Insm1 promotes endocrine cell differentiation by modulating the expression of a network of genes that includes Neurog3 and Ripply3. Development 141, 2939–2949, doi: 10.1242/dev.104810 (2014). [DOI] [PMC free article] [PubMed] [Google Scholar]
- 15.Haghverdi L, Buttner M, Wolf FA, Buettner F & Theis FJ Diffusion pseudotime robustly reconstructs lineage branching. Nat Methods 13, 845–848, doi: 10.1038/nmeth.3971 (2016). [DOI] [PubMed] [Google Scholar]
- 16.Schiebinger G et al. Reconstruction of developmental landscapes by optimal-transport analysis of single-cell gene expression sheds light on cellular reprogramming. bioRxiv, 191056 (2017). [Google Scholar]
- 17.Viotti M, Foley AC & Hadjantonakis AK Gutsy moves in mice: cellular and molecular dynamics of endoderm morphogenesis. Philos. Trans. R. Soc. Lond. B Biol. Sci 369, doi: 10.1098/rstb.2013.0547 (2014). [DOI] [PMC free article] [PubMed] [Google Scholar]
- 18.Deschamps J & Duboule D Embryonic timing, axial stem cells, chromatin dynamics, and the Hox clock. Genes \& Development 31, 1406–1416 (2017). [DOI] [PMC free article] [PubMed] [Google Scholar]
- 19.Palis J Hematopoietic stem cell-independent hematopoiesis: emergence of erythroid, megakaryocyte, and myeloid potential in the mammalian embryo. FEBS Lett. 590, 3965–3974 (2016). [DOI] [PubMed] [Google Scholar]
- 20.McGrath KE et al. Distinct Sources of Hematopoietic Progenitors Emerge before HSCs and Provide Functional Blood Cells in the Mammalian Embryo. Cell Reports 11, 1892–1904 (2015). [DOI] [PMC free article] [PubMed] [Google Scholar]
- 21.Downs KM, Gifford S, Blahnik M & Gardner RL Vascularization in the murine allantois occurs by vasculogenesis without accompanying erythropoiesis. Development 125, 4507–4520 (1998). [DOI] [PubMed] [Google Scholar]
- 22.Patan S in Angiogenesis in Brain Tumors Cancer Treatment and Research 3–32 (Springer, Boston, MA, 2004). [DOI] [PubMed] [Google Scholar]
- 23.Picelli S et al. Smart-seq2 for sensitive full-length transcriptome profiling in single cells. Nature Methods 10, 1096–1098 (2013). [DOI] [PubMed] [Google Scholar]
- 24.Palis J, Robertson S, Kennedy M, Wall C & Keller G Development of erythroid and myeloid progenitors in the yolk sac and embryo proper of the mouse. Development 126, 5073–5084 (1999). [DOI] [PubMed] [Google Scholar]
- 25.Tober J et al. The megakaryocyte lineage originates from hemangioblast precursors and is an integral component both of primitive and of definitive hematopoiesis. Blood 109, 1433–1441, doi: 10.1182/blood-2006-06-031898 (2007). [DOI] [PMC free article] [PubMed] [Google Scholar]
- 26.Xu M.-j. et al. Evidence for the presence of murine primitive megakarycytopoiesis in the early yolk sac. Blood 97, 2016–2022 (2001). [DOI] [PubMed] [Google Scholar]
- 27.Hoeffel G et al. C-Myb+ Erythro-Myeloid Progenitor-Derived Fetal Monocytes Give Rise to Adult Tissue-Resident Macrophages. Immunity 42, 665–678 (2015). [DOI] [PMC free article] [PubMed] [Google Scholar]
- 28.Perdiguero EG et al. The Origin of Tissue-Resident Macrophages: When an Erythro-myeloid Progenitor Is an Erythro-myeloid Progenitor. Immunity 43, 1023–1024, doi: 10.1016/j.immuni.2015.11.022 (2015). [DOI] [PubMed] [Google Scholar]
- 29.Bennett ML et al. New tools for studying microglia in the mouse and human CNS. Proceedings of the National Academy of Sciences 113, E1738–E1746 (2016). [DOI] [PMC free article] [PubMed] [Google Scholar]
- 30.Ginhoux F et al. Fate Mapping Analysis Reveals That Adult Microglia Derive from Primitive Macrophages. Science 330, 841–845 (2010). [DOI] [PMC free article] [PubMed] [Google Scholar]
- 31.Shivdasani RA, Mayer EL & Orkin SH Absence of blood formation in mice lacking the T-cell leukaemia oncoprotein tal-1/SCL. Nature 373, 432–434 (1995). [DOI] [PubMed] [Google Scholar]
- 32.Robb L et al. The scl gene product is required for the generation of all hematopoietic lineages in the adult mouse. The EMBO journal 15, 4123–4129 (1996). [PMC free article] [PubMed] [Google Scholar]
- 33.Van Handel B et al. Scl represses cardiomyogenesis in prospective hemogenic endothelium and endocardium. Cell 150, 590–605, doi: 10.1016/j.cell.2012.06.026 (2012). [DOI] [PMC free article] [PubMed] [Google Scholar]
- 34.Huber TL, Kouskoff V, Fehling HJ, Palis J & Keller G Haemangioblast commitment is initiated in the primitive streak of the mouse embryo. Nature 432, 625–630 (2004). [DOI] [PubMed] [Google Scholar]
- 35.Briggs JA et al. The dynamics of gene expression in vertebrate embryogenesis at single-cell resolution. Science, eaar5780 (2018). [DOI] [PMC free article] [PubMed] [Google Scholar]
- 36.Farrell JA et al. Single-cell reconstruction of developmental trajectories during zebrafish embryogenesis. Science, eaar3131 (2018). [DOI] [PMC free article] [PubMed] [Google Scholar]
- 37.Wagner DE et al. Single-cell mapping of gene expression landscapes and lineage in the zebrafish embryo. Science, eaar4362 (2018). [DOI] [PMC free article] [PubMed] [Google Scholar]
- 38.Pijuan-Sala B, Guibentif C & Göttgens B Single-cell transcriptional profiling: a window into embryonic cell-type specification. Nature Reviews Molecular Cell Biology, 1 (2018). [DOI] [PubMed] [Google Scholar]
Additional References
- 39.Srinivas S et al. Cre reporter strains produced by targeted insertion of EYFP and ECFP into the ROSA26 locus. BMC Dev. Biol. 1, 4 (2001). [DOI] [PMC free article] [PubMed] [Google Scholar]
- 40.Nichols J & Jones K Derivation of Mouse Embryonic Stem (ES) Cell Lines Using Small-Molecule Inhibitors of Erk and Gsk3 Signaling (2i). Cold Spring Harbor Protocols 2017, pdb.prot094086 (2017). [DOI] [PubMed] [Google Scholar]
- 41.Ying Q-L et al. The ground state of embryonic stem cell self-renewal. Nature 453, 519–523 (2008). [DOI] [PMC free article] [PubMed] [Google Scholar]
- 42.Wray J et al. Inhibition of glycogen synthase kinase-3 alleviates Tcf3 repression of the pluripotency network and increases embryonic stem cell resistance to differentiation. Nat. Cell Biol 13, 838–845, doi: 10.1038/ncb2267 (2011). [DOI] [PMC free article] [PubMed] [Google Scholar]
- 43.Ran FA et al. Genome engineering using the CRISPR-Cas9 system. Nat. Protoc 8, 2281–2308, doi: 10.1038/nprot.2013.143 (2013). [DOI] [PMC free article] [PubMed] [Google Scholar]
- 44.Bin GCL et al. Oct4 is required for lineage priming in the developing inner cell mass of the mouse blastocyst. Development 141, 1001–1010 (2014). [DOI] [PMC free article] [PubMed] [Google Scholar]
- 45.Lun A et al. Distinguishing cells from empty droplets in droplet-based single-cell RNA sequencing data. bioRxiv, 234872 (2018). [DOI] [PMC free article] [PubMed] [Google Scholar]
- 46.Lun ATL, McCarthy DJ & Marioni JC A step-by-step workflow for low-level analysis of single-cell RNA-seq data. F1000Research 5, 2122 (2016). [DOI] [PMC free article] [PubMed] [Google Scholar]
- 47.Wu TD & Nacu S Fast and SNP-tolerant detection of complex variants and splicing in short reads. Bioinformatics 26, 873–881 (2010). [DOI] [PMC free article] [PubMed] [Google Scholar]
- 48.Anders S, Pyl PT & Huber W HTSeq--a Python framework to work with high-throughput sequencing data. Bioinformatics 31, 166–169, doi: 10.1093/bioinformatics/btu638 (2015). [DOI] [PMC free article] [PubMed] [Google Scholar]
- 49.Wolf FA, Angerer P & Theis FJ SCANPY: large-scale single-cell gene expression data analysis. Genome Biol. 19, 15 (2018). [DOI] [PMC free article] [PubMed] [Google Scholar]
- 50.Bastian M, Heymann S & Jacomy M in Third International AAAI Conference on Weblogs and Social Media. [Google Scholar]
- 51.Jacomy M, Venturini T, Heymann S & Bastian M ForceAtlas2, a Continuous Graph Layout Algorithm for Handy Network Visualization Designed for the Gephi Software. PLoS One 9, e98679 (2014). [DOI] [PMC free article] [PubMed] [Google Scholar]
- 52.Wolf FA et al. Graph abstraction reconciles clustering with trajectory inference through a topology preserving map of single cells. bioRxiv, 208819 (2017). [DOI] [PMC free article] [PubMed] [Google Scholar]
- 53.Robinson MD, McCarthy DJ & Smyth GK edgeR: a Bioconductor package for differential expression analysis of digital gene expression data. Bioinformatics 26, 139–140 (2010). [DOI] [PMC free article] [PubMed] [Google Scholar]
- 54.Dong J et al. Single-cell RNA-seq analysis unveils a prevalent epithelial/mesenchymal hybrid state during mouse organogenesis. Genome Biol. 19, 31 (2018). [DOI] [PMC free article] [PubMed] [Google Scholar]
- 55.Brennecke P et al. Accounting for technical noise in single-cell RNA-seq experiments. Nature Methods 10, 1093–1095 (2013). [DOI] [PubMed] [Google Scholar]
- 56.Kinder SJ et al. The orderly allocation of mesodermal cells to the extraembryonic structures and the anteroposterior axis during gastrulation of the mouse embryo. Development 126, 4691–4701 (1999). [DOI] [PubMed] [Google Scholar]
- 57.Zheng GX et al. Massively parallel digital transcriptional profiling of single cells. Nat Commun 8, 14049 (2017). [DOI] [PMC free article] [PubMed] [Google Scholar]
Associated Data
This section collects any data citations, data availability statements, or supplementary materials included in this article.


