Abstract
Type 1 diabetes is an autoimmune condition characterised by a pancreatic insulin secretion deficit, resulting in high blood glucose concentrations, which can lead to micro- and macrovascular complications. Type 1 diabetes also leads to impaired glucagon production by the pancreatic α-cells, which acts as a counter-regulatory hormone to insulin.
A closed-loop system for automatic insulin and glucagon delivery, also referred to as an artificial pancreas, has the potential to reduce the self-management burden of type 1 diabetes and reduce the risk of hypo- and hyperglycemia. To date, bihormonal closed-loop systems for glucagon and insulin delivery have been based on two independent controllers. However, in physiology, the secretion of insulin and glucagon in the body is closely interconnected by paracrine and endocrine associations. In this work, we present a novel biologically-inspired glucose control strategy that accounts for such coordination.
An in-silico study using an FDA-accepted type 1 simulator was performed to evaluate the proposed coordinated control strategy compared to its non-coordinated counterpart. The proposed coordinated strategy achieves a reduction of hyperglycemia without increasing hypoglycemia, when compared to its non-coordinated counterpart.
1. Introduction
Glucose metabolism in humans is tightly controlled by several feedback mechanisms that provide high robustness to prevent undesirable fluctuations (i.e. hyperglycemia or hypoglycemia). In these feedback mechanisms, many interconnected biological signals such as different hormones (e.g. insulin, glucagon) and neurotransmitters are involved [Wasserman 2009].
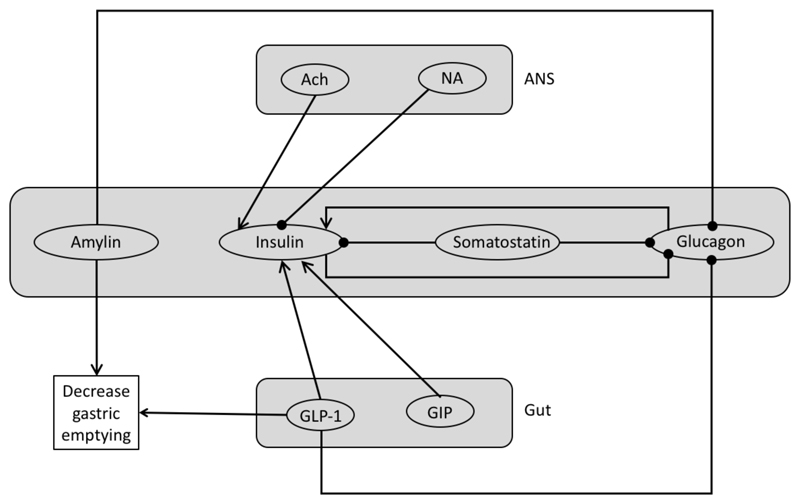
In addition to insulin and glucagon, which are the most important hormones that regulate glucose concentrations, there are many other substances that have to be taken into account. The primary glycohormones are insulin, glucagon, amylin and incretin hormones (GLP-1 and GIP), which are secreted by the pancreas and the gut. Moreover, both the Central Nervous System and the Autonomic Nervous System (sympathetic and parasympathetic) are implied directly and indirectly in the regulation mechanisms of glucose (Figure 1). However, the central axis of the regulation is the interaction between insulin secreting pancreatic β-cells and the glucagon secreting pancreatic α-cells.
Figure 1.
Global Hormone and Neurotransmitter interactions. ANS (Autonomic Nervous System), Ach (Acetylcholine), NA (Noradrenaline). Arrows indicate a potentiation effect and circles a suppressive effect.
Diabetes mellitus is a chronic condition that occurs either when the pancreatic β-cells can no longer produce sufficient insulin due to autoimmune destruction (type 1), or when there is a decreased cellular response to circulating insulin (type 2). The resulting absolute or relative deficiency of insulin causes hyperglycaemia (high blood glucose), which can lead to micro- and macro vascular complications including blindness, kidney failure, limb amputation, and cardiovascular disease. Type 1 diabetes mellitus (T1DM) may also lead to impaired glucagon production by the α-cells, which is the primary counter-regulatory hormone to insulin.
Current therapy for T1DM consists of measuring blood glucose levels by means of a glucose meter and injecting multiple daily doses of insulin to keeps glucose levels in a safe range. However, many people with T1DM using this therapy do not achieve the recommended glycemic targets [DCCT 1991].
One solution to reduce the burden of self-management of T1DM, as well as to significantly improve glycemic control, is a closed-loop system for automatic insulin delivery [Kropff 2016], also referred to as an artificial pancreas.
The most common configuration of artificial pancreas consists of a subcutaneous continuous glucose sensor which measures interstitial glucose levels every five minutes and a subcutaneous insulin pump that delivers insulin at a rate computed by a closed-loop controller [Doyle 2014] (Figure 2).
Figure 2.
Block diagram of a closed-loop system for glucose control incorporating a meal bolus calculator.
Due to the delays in subcutaneous insulin absorption, most of the current artificial pancreas systems include a feed-forward control strategy consisting of a pre-meal insulin bolus to compensate for perturbations caused by the meals as well as an insulin feedback mechanism to take into account the insulin still active in the body (i.e. insulin-on-board) [Doyle 2014].
Another configuration of artificial pancreas consists of a bihormonal closed-loop system incorporating insulin and glucagon delivery [Russell 2014]. This system has the advantage of accounting for the counter-regulatory action to insulin, which might be very useful in certain situations such as following exercise [Taleb 2016]. However, the need for a more complex system incorporating two infusion systems, and the lack of a commercial stable glucagon solution, makes this control strategy potentially more challenging. Despite these challenges, there are at least three companies that are currently working on a stable glucagon solutions (Zealand, Xeris, and Adocia) which have reported to be in the latest stage of development. In addition, there are two companies developing prototypes of dual-chamber bihormonal artificial pancreas (Beta-bionic and Inreda) which plan to have regulatory submissions in 2017 [Ginsberg 2017].
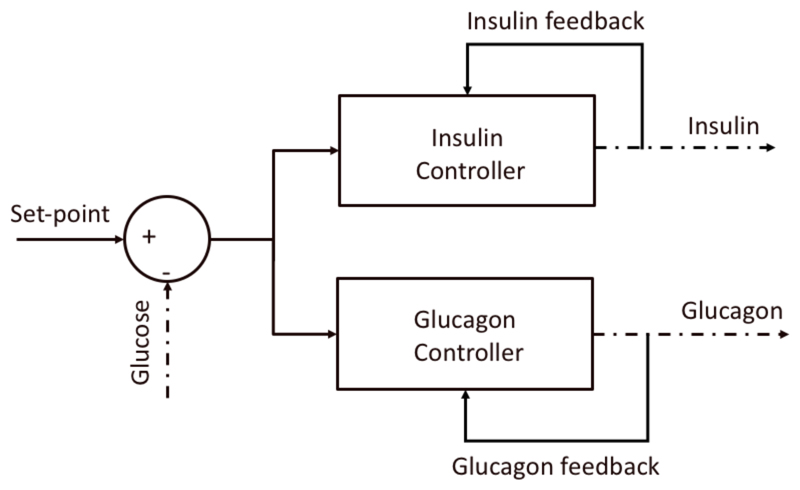
To date, most bihormonal closed-loop systems for glucagon and insulin delivery have been based on two independent controllers (e.g. MPC+PD [Russell 2014], PID+PID [Jacobs 2014] [Taleb 2016]) (Figure 3). However, it is well known that the secretion of these two hormones in the body is closely interconnected through potentiation of insulin secretion by plasma glucagon levels and a suppression of glucagon secretion by plasma insulin levels [Wasserman 2009].
Figure 3.
Graphical representation of the bihormonal control strategy where the two controllers are completely independent.
In this work, we present a novel biologically inspired bihormonal closed-loop control strategy that accounts for such coordination.
2. Methods
Although the inter-relation between insulin and glucagon secretion is known to be highly complex [Wasserman 2009], this work focuses on accounting for the potentiation effect of insulin secretion by plasma glucagon levels. The rationale behind considering such interaction in a closed-loop system is to anticipate the glucose increase after glucagon secretion and therefore minimize a rebound in hyperglycemia.
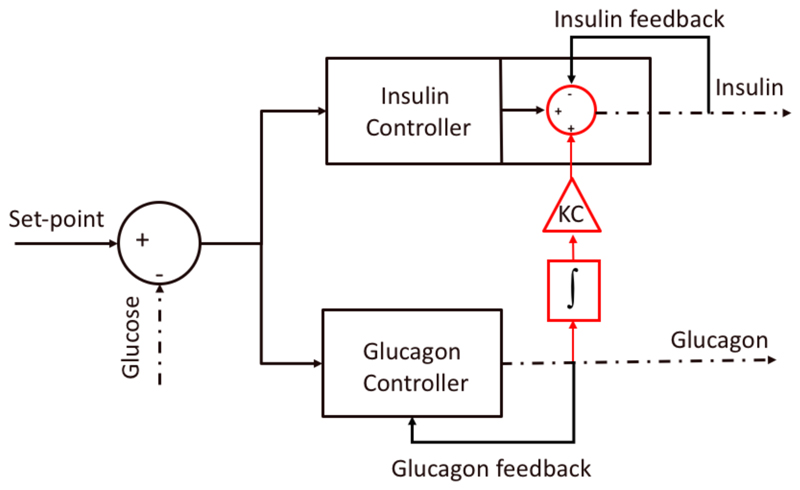
To account for such effect, the insulin delivered due to the potentiation effect by plasma glucagon levels is proportional to the delivered glucagon. More specifically, glucagon is integrated from the time it is started being delivered to the time its delivery stops. Then, the resulting glucagon dose is multiplied by a correction factor (KC) (Figure 4). This can be expressed as
| (1) |
where InsulinGN is the insulin delivered due to the glucagon potentiation, Glucagon is the glucagon delivered by the glucagon controller, t0 is the time glucagon starts being delivered to prevent hypoglycemia, tn is the time glucagon stops and KC is a correction factor defined as
| (2) |
where ISF is the insulin sensitivity factor, GSF is the glucagon sensitivity factor and K is a tuning gain. Note that, unlike the ISF, the glucagon sensitivity factor is not a commonly used parameter in diabetes management practice. However, this parameter can be obtained in the same way ISF is obtained, i.e. measuring the glucose increase in fasting conditions after the administration of a standardized glucose dose.
Figure 4.
Graphical representation of the bihormonal control strategy incorporating the potentiation effect of insulin secretion by plasma glucagon levels.
Then, the total insulin sent to the pump is expressed as
| (3) |
where Insulin0 is the insulin proposed by the controller (e.g. PID) and InsulinFB is the insulin feedback term implemented in many of existing controllers [Doyle 2014].
For evaluation purposes, an updated version of Imperial College Artificial Pancreas (ICAP), also referred to as Bio-inspired Artificial Pancreas (BiAP), controller was employed for insulin delivery. For the sake of simplicity, the existing controller in the ICAP was selected for glucagon delivery. It is important to note that proposed coordination strategy is independent of the employed controllers and can be generalized for any artificial pancreas system.
The Imperial College Artificial Pancreas Controller
The Imperial College Artificial Pancreas (ICAP) controller, also referred to as Bio-inspired Artificial Pancreas (BiAP), has been previously in silico [Herrero 2012] and clinically validated [Reddy 2014, Reddy 2015]. ICAP uses a pancreatic insulin secretion model [Pedersen 2010] as a core component to emulate the behavior of a healthy β-cell. In this work, such model has been updated with a more recent one [Riz 2014] that was proven to provide better performance in simulation studies, as well as to reduce the computational complexity of the controller.
Similar to most of the existing glucose controllers, ICAP incorporates an insulin feedback term [Doyle 2014] to avoid insulin stacking by compensating for delays associated with subcutaneous insulin delivery, and a feedforward strategy consisting of a pre-meal insulin bolus calculator [Doyle 2014] to tackle the perturbation introduced by meal intake.
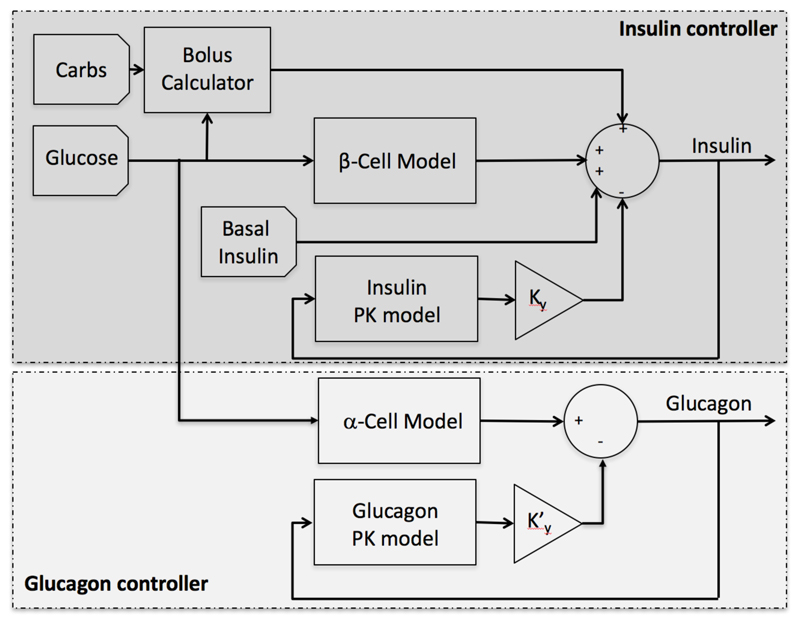
The employed glucagon controller uses the same secretion model employed in the insulin controller and a glucagon feedback term to avoid glucagon stacking associated with the subcutaneous delivery. Figure 5 shows a schematic diagram of the proposed controller.
Figure 5.
Block diagram of the non-coordinated ICAP controller, where inputs are the amount of ingested carbohydrates, the glucose concentration from a continuous glucose sensor, and the basal insulin rate for a given subject, and the output in the insulin dose to be delivered by the insulin pump.
The insulin controller is described by the equation
| (4) |
where SR is the pancreatic insulin secretion above basal secretion; SRb is the basal insulin secretion, which is set to the subject’s basal insulin profile; and Bolus is a pre-meal insulin bolus calculated as
| (5) |
where Carbs is the amount of ingested carbohydrates, ICR is the patient specific insulin to carbohydrate ratio, Gsp is the glucose set-point and ISF is the patient specific insulin sensitivity factor.
The insulin feedback term KyI is proportional (Ky) to the plasma insulin estimation I computed using the insulin pharmacokinetic [Hovorka 2004] model
| (6) |
| (7) |
| (8) |
where, ke is the first order decay rate for insulin in plasma, u subcutaneous insulin infusion rate, VI is the distribution volume of plasma insulin, tmaxI is the time-to-maximum insulin absorption, S1 and S2 are a two-compartment chain representing absorption of subcutaneously administered insulin.
As described in [Riz 2014], the pancreatic insulin secretion (SR) above basal secretion (SRb) is assumed proportional (m) to the amount X of readily releasable insulin in the beta-cells
| (9) |
The change in the insulin amount in the ready releasable pool (RRP) X results from the balance between the insulin secretion rate, the provision Y of insulin refilling the readily releasable pool, and recruitment of readily releasable insulin XD
| (10) |
where XD is responsible for the first phase of secretion and is assumed to be proportional to the rate of increase of glucose via the constant parameter KD and expressed as
| (11) |
In this work, the conditional statement in Equation (11) regarding the sign of the glucose derivative was eliminated. The reason for this modification is that delays in insulin absorption and glucose sensing due to the subcutaneous route make reducing insulin delivery when glucose is dropping desirable in order to minimize hypoglycemia.
The provision Y generates the slower second phase of insulin secretion and is controlled by glucose according to the equation
| (12) |
where Gb represents the basal value of glucose, and α and β are parameters.
Parameter β is employed as a personalized tunable gain proportional to the subject’s insulin sensitivity factor (ISF) used to overcome inter-subject variability.
To minimize hypoglycemia, a simple low-glucose insulin suspend (LGS) mechanism was incorporated which reduces basal insulin delivery (SRb) to 50% if the glucose falls below a predefined threshold (100 mg/dl) and suspends the insulin delivery if it falls below a second lower predefined threshold (80mg/dl).
The employed glucagon controller uses the same secretion and pharmacokinetic model structure used in the insulin controller, but with different parameters (see Table 1). The glucagon controller is described by the equation
| (13) |
where SR’ is the pancreatic glucagon secretion above basal secretion and Ky′N is proportional (Ky) to the plasma glucagon estimation (N) computed using the same pharmacokinetic model used for insulin absorption [Herrero 2013].
Table 1.
Tuning parameters employed for the insulin and glucagon controllers.
| Parameter | Insulin controller | Glucagon controller |
|---|---|---|
| m | 0.5 | 0.5 |
| α | m | m |
| β (U per mg/dl and mg per mg/dl) | 0.0215/ISF | 0.0039/GSF (adults) 0.005/GSF (adolescents and children) |
| KD (min) | β·45 | β·30 |
| Gb (mg/dl) | 117 | 117 |
| Ky | 50 | 10 |
| ke (min-1) | 0.138 | 0.1 |
| tmax (min) | 54 | 30 |
| V (dl) | 12 | 12 |
Since delays in glucagon absorption are significantly smaller than delays in insulin absorption, Equation (11) was kept as in the original model proposed by Riz et al. [Riz 2014]. For simulation purposes, all the differential equations of the model were discretized using Euler method with an integration step of one minute.
Controllers tuning
Controller parameters were fixed to the same value except parameters β (β′ for the glucagon controller), which was used to personalize the controller to each individual (see Table 1). These two parameters were then correlated to the insulin sensitivity factor (ISF) and the glucagon sensitivity factor (GSF) of the subject in order to provide an easy way to tune the controller. With such configuration, both single-hormone controllers (i.e. insulin and glucagon controllers) were manually tuned in a non-coordinated way to achieve the best possible glycemic outcome over one-week scenario. In particular, two standard glycemic metrics were employed for such purpose; maximizing the percentage time in target range [70,180] mg/dl and minimizing the percentage time below target 70 mg/dL [Maahs 2016].
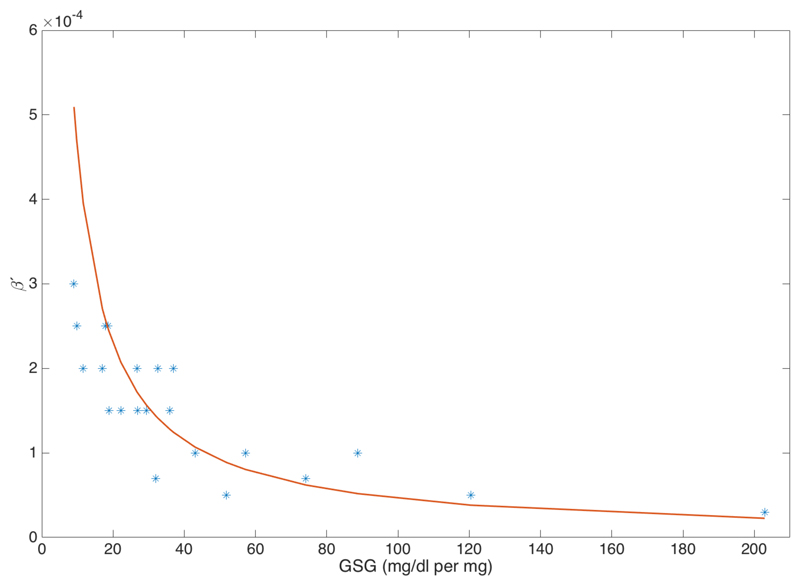
Figure 5 shows a graphical representation of the correlation GSF vs. β′ (β′=0.046*GSF, R2=0.85).
Figure 5.
Graphical representation of the correlation GSF vs. β′
It is important to note that the tuning of the insulin and glucagon controllers was exactly the same for both the non-coordinated and coordinated strategies.
Table 1 shows the parameters for the insulin and glucagon controllers. The parameters for the insulin absorption model were taken from [Hovorka 2004]. The parameters for the plasma absorption models with plasma glucagon absorption model were obtained by identifying the pharmacokinetic model using mean population subject from the UVa-Padova T1DM simulator (v3.2). Finally, the coordination gain was set to K = 2.5.
In Silico Evaluation under intra-day variability
The UVa-Padova T1DM simulator (v3.2) [Kovatchev 2009] was used to evaluate the proposed coordinated bihormonal closed-loop control strategy. A virtual cohort of 10 adults, 10 adolescents and 10 children, plus their corresponding average subject, were used for this purpose.
The chosen basal insulin infusion rates were the ones provided by the simulator. The selected CGM and insulin pump models were the Dexcom G4 and Deltec Cozmo.
Intra-day variability was introduced to the simulator by modifying some of the parameters of the model described in [Dalla Man 2007]. In particular, meal variability was emulated by introducing meal-size variability (CV=10%), meal-time variability (STD=20) and uncertainty in the carbohydrate estimation (uniform distribution between -30% and +40%) [Brazeau 2013]. Variability of meal absorption rate (kabs) and carbohydrate bioavailability (f) were considered to be ±30% and ±10% respectively. To emulate intra-day meal variability, the 11 meals corresponding to each cohort were randomly assigned at each meal intake. Intra-subject variability in insulin absorption model parameter (kd, ka1, ka2) was assumed ±30% [Haidar 2013]. Insulin sensitivity parameters (Vmx, Kp3) were assumed to vary along the day following the sinusoidal pattern
| (14) |
where p(t) is the corresponding time varying parameter (i.e. Vmx or kp3); p0 is the default parameter value in the simulator; and RND is a randomly uniformly generated number between 0 and 1. The selected daily pattern of carbohydrate doses was 7am (50g), 1pm (80g), 5pm (30g), 8pm (60g).
Physical exercise was simulated using the model introduced by Schiavon et al. [Schiavon 2013]. Although not being very realistic for most people with type 1 diabetes, a daily exercise at 15:00h (STD=20min), intensity of 50% VO2max (CV=10) and a duration of 60 minutes (CV=10) was employed for this purpose.
The following standard glycemic control metrics [Maahs 2016] were selected for comparison purposes: mean blood glucose (BG); percentage time in target ranges [70,140] and [70,180] mg/dl (%inT); percentage time below target (%<70); percentage time above targets (%>140 and %>180); standard deviation (STD); risk index (RI); low blood glycemic index (LBGI); high blood glycemic index (HBGI); daily average of insulin delivered in units of insulin (INSULIN); and daily average of glucagon delivered in mg (GLUCAGON). A two-week scenario was used to compare the closed-loop insulin-only strategy (IO), the coordinated bihormonal controller (CO) and its non-coordinated counterpart (NC).
3. Results
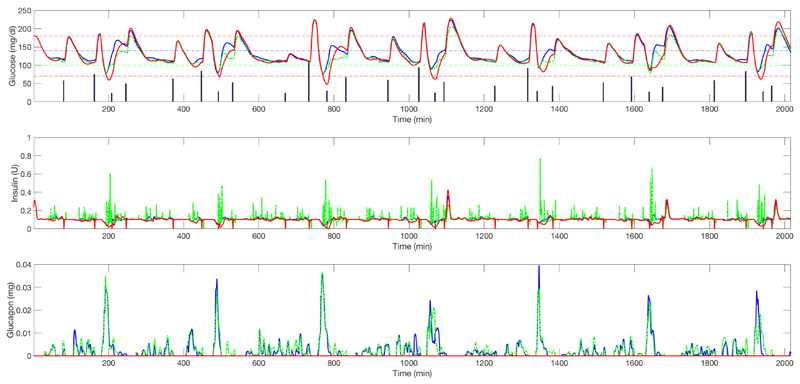
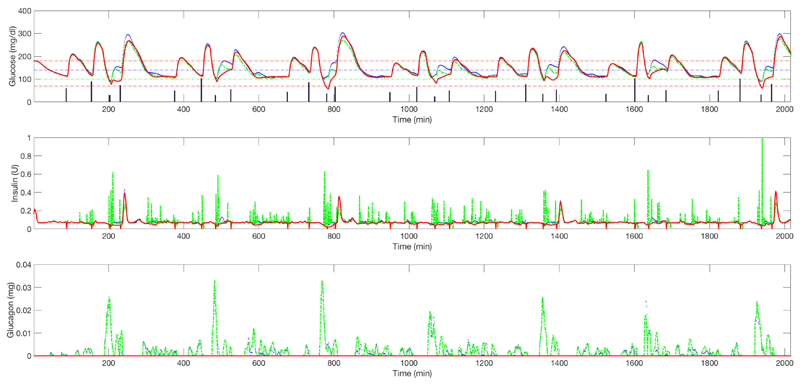
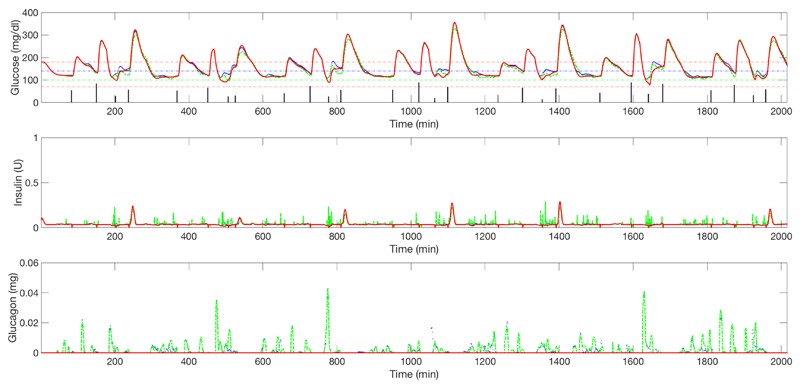
Table 2, Table 3 and Table 4 show, respectively, the results corresponding to the 10 adults, 10 adolescents, and 10 children, plus the corresponding average subject, for the closed-loop insulin-only strategy (IO), the non-coordinated bihormonal control (NC), and its coordinated counterpart (CO). Figure 6, Figure 7 and Figure 8 show the mean plasma glucose, insulin delivery and glucagon delivery corresponding to the three evaluated strategies, for the adult, adolescent and children cohort, respectively. Note that only one week of data has been displayed in order to enhance visualization.
Table 2.
Results corresponding to 10 adults plus the average adult subject. Symbol “*” indicates statistical significance (p<0.01) with respect to the closed-loop insulin only therapy (IO) and symbol “‡” indicates statistical significance (p<0.01) with respect to the non-coordinated hormonal control (NC). A double symbol (e.g. “‡‡”) indicated statistical significance of p<0.05.
| Glucose mg/dl |
%IN [70,140] mg/dl |
%<70 mg/dl |
%>140 mg/dl |
%IN [70,180] mg/dl |
%>180 mg/dl |
|
|---|---|---|---|---|---|---|
| IO | 131.8±5.9 | 58.7±6.3 | 5.3±2.1 | 35.8±5.3 | 81.1±6.0 | 13.5±5.5 |
| NC | 136.03±6.8* | 61.37±6.5* | 1.53±1.0* | 37.09±6.4 | 84.53±5.7* | 13.93±5.8 |
| CO | 130.0±5.9*‡ | 66.75±5.8*‡ | 1.79±1.5* | 31.4±6.0*‡ | 88.1±4.7*‡ | 10.0±4.9*‡ |
| STD mg/dl |
RI | LBGI | HBGI | INSULIN U per day |
GLUCAGON mg per day |
|
|---|---|---|---|---|---|---|
| IO | 42.7±7.3 | 4.6±1.3 | 1.6±0.7 | 2.9±1.0 | 41.2±9.2 | 0±0 |
| NC | 38.10±8.0* | 3.48±1.12* | 0.45±0.15* | 3.03±1.11 | 43.61±9.92* | 0.64±0.52* |
| CO | 35.44±6.89*‡ | 2.92±0.84*‡ | 0.56±0.24*‡‡ | 2.35±0.85*‡ | 44.99±10.25*‡ | 0.70±0.53*‡ |
Table 3.
Results corresponding to 10 adolescents plus the average adolescent. Symbol “*” indicates statistical significance (p<0.01) with respect to the closed-loop insulin only therapy (IO) and symbol “‡” indicates statistical significance (p<0.01) with respect to the non-coordinated hormonal control (NC). A double symbol (e.g. “‡‡”) indicated statistical significance of p<0.05.
| Glucose mg/dl |
%IN [70,140] mg/dl |
%<70 mg/dl |
%>140 mg/dl |
%IN [70,180] mg/dl |
%>180 mg/dl |
|
|---|---|---|---|---|---|---|
| IO | 150.4±13.3 | 46.4±7.3 | 5.0±4.1 | 48.5±5.8 | 67.9±9.0 | 27.0±8.1 |
| NC | 158.4±10.2* | 45.3±4.3 | 1.2±0.9* | 53.3±4.1* | 69.4±6.3 | 29.2±6.6* |
| CO | 150.9±12.4‡ | 49.7±5.1‡ | 1.9±1.8* | 48.3±5.9‡ | 73.1±7.5*‡ | 24.9±8.3‡ |
| Sth mg/dl |
RI | LBGI | HBGI | INSULIN U per day |
GLUCAGON mg per day |
|
|---|---|---|---|---|---|---|
| IO | 59.7±10.0 | 8.2±3.1 | 2.0±2.4 | 6.1±2.2 | 31.1±7.3 | 0±0 |
| NC | 56.7±9.1 | 7.1±1.8 | 0.4±0.2* | 6.6±1.9* | 33.2±7.9* | 0.50±0.35* |
| CO | 53.2±9.8**‡ | 6.2±1.8**‡ | 0.6±0.5*‡‡ | 5.6±2.1‡ | 35.0±8.3*‡ | 0.6±0.55*‡ |
Table 4.
Results corresponding to 10 children plus the average children. Symbol “*” indicates statistical significance (p<0.01) with respect to the closed-loop insulin only therapy (IO) and symbol “‡” indicates statistical significance (p<0.01) with respect to the non-coordinated hormonal control (NC). A double symbol (e.g. “‡‡”) indicated statistical significance of p<0.05.
| Glucose mg/dl |
%IN [70,140] mg/dl |
%<70 mg/dl |
%>140 mg/dl |
%IN [70,180] mg/dl |
%>180 mg/dl |
|
|---|---|---|---|---|---|---|
| IO | 163.3±8.9 | 44.6±6.39 | 3.12±2.61 | 52.2±7.66 | 65.3±5.39 | 31.5±6.40 |
| NC | 166.5±8.7* | 45.0±6.6 | 0.78±0.78* | 54.1±7.1* | 66.8±5.86* | 32.3±6.26 |
| CO | 162.4±8.7*‡ | 47.7±6.7*‡ | 1.16±1.05* | 51.0±7.2‡ | 68.18±5.38* | 30.6±5.76‡ |
| STD mg/dl |
RI | LBGI | HBGI | INSULIN U per day |
GLUCAGON mg per day |
|
|---|---|---|---|---|---|---|
| IO | 68.9±6.32 | 8.92±1.34 | 0.94±0.78 | 7.98±1.43 | 17.45±3.78 | 0±0 |
| NC | 65.3±6.3* | 8.31±1.45* | 0.25±0.15* | 8.05±1.50 | 17.9±3.79* | 0.44±0.64* |
| CO | 65.3±7.4* | 7.98±1.44*‡ | 0.38±0.24*‡ | 7.59±1.46*‡ | 18.3±3.76*‡ | 0.56±0.78*‡ |
Figure 6.
Upper graph: average plasma glucose (adult cohort) for closed-loop insulin-only therapy (red solid line) vs. un-coordinated bihormonal controller (blue solid line) vs. its coordinated counterpart (green dashed line) (one week). Vertical bars represent the meals. Middle graph: corresponding insulin delivery without considering the meal boluses. Lower graph: corresponding glucagon delivery.
Figure 7.
Upper graph: average plasma glucose (adolescent cohort) for closed-loop insulin-only therapy (red solid line) vs. un-coordinated bihormonal controller (blue solid line) vs. its coordinated counterpart (green dashed line) (one week). Vertical bars represent the meals. Middle graph: corresponding insulin delivery without considering the meal boluses. Lower graph: corresponding glucagon delivery.
Figure 8.
Upper graph: average plasma glucose (children cohort) for closed-loop insulin-only therapy (red solid line) vs. un-coordinated bihormonal controller (blue solid line) vs. its coordinated counterpart (green dashed line) (one week). Vertical bars represent the meals. Middle graph: corresponding insulin delivery without considering the meal boluses. Lower graph: corresponding glucagon delivery.
When compared against the insulin-only strategy, both bihormonal strategies significantly reduce hypoglycemia in all cohorts. While the non-coordinated strategy slightly increases hyperglycemia, the coordinated strategy decreases it in the adult cohort and remains unchanged in the adolescent and children cohorts. When comparing the coordinated bihormonal control strategy against its uncoordinated counterpart, all the evaluated glycemic metrics show a statistically significant improvement, or remain unchanged, apart from the low blood glycemic index (LBGI), which slightly increases in all cohorts. Note that the improvements in the children cohort are more moderate than the ones in the adult and adolescent cohorts.
4. Conclusion
The proposed coordinated bihormonal control strategy, which accounts for the potentiation effect of insulin secretion by plasma glucagon levels, achieves a reduction in hyperglycemia without increasing hypoglycemia, when compared against an uncoordinated strategy. The improvement in glycemic control is achieved at expenses of delivering slightly more insulin and glucagon delivery, but this is not clinically significant.
The improvements seen in time in target and time above target suggest that the coordinated approach minimises rebound hyperglycaemia from glucagon administration while the similarities in time in hypoglycemia reflect that the glucagon controller is similarly effective in both arms of the in silico study.
It is important to highlight the simplicity of the tuning procedure, which only requires the insulin sensitivity factor and the glucagon sensitivity factor. Although the glucagon sensitivity is not currently used in diabetes management, it should become commonplace once the utilization of glucagon within artificial pancreas becomes standard.
The potentiation effect of insulin secretion by plasma glucagon levels is only one of coordination effects between insulin and glucagon secretion. The suppression of glucagon secretion by plasma insulin levels is another coordination which could be studied within a bihormonal controller. However, its benefit in an artificial pancreas using the subcutaneous route for delivery is less obvious.
Despite the significant uncertainty and variability used to carry out the in silico testing, a clinical trial is required to validate the proposed technique.
Acknowledgements
This project has been funded by the Wellcome Trust, the Spanish Ministry of Economy and Competitiveness (MINECO) through grant DPI2013-46982-C2-1-R and the EU through FEDER funds.
References
- [Brazeau 2013] .Brazeau AS, Mircescu H, Desjardins K, Leroux C, Strychar I, Ekoé JM, Rabasa-Lhoret R. Carbohydrate counting accuracy and blood glucose variability in adults with Type 1 diabetes. Diabetes Res Clin Pract. 2013;99(1):19–23. doi: 10.1016/j.diabres.2012.10.024. [DOI] [PubMed] [Google Scholar]
- [Dalla-Man 2007] .Dalla-Man C, Rizza RA, Cobelli C. Meal simulation model of the glucose-insulin system. IEEE Trans Biomed Eng. 2007;54(10):1740–1749. doi: 10.1109/TBME.2007.893506. [DOI] [PubMed] [Google Scholar]
- [Dalla-Man 2014] .Visentin R, Dalla Man C, Kudva YC, Basu A, Cobelli C. Circadian variability of insulin sensitivity: physiological input for in silico artificial pancreas. Diabetes Technol Ther. 2015;17(1):1–7. doi: 10.1089/dia.2014.0192. [DOI] [PMC free article] [PubMed] [Google Scholar]
- [DCCT 1991] .DCCT Research Group. Epidemiology of severe hypoglycemia in the Diabetes Control and Complications Trial. Am J Med. 1991;90:450–459. [PubMed] [Google Scholar]
- [Doyle 2014] .Doyle FJ, Huyett LM, Lee JB, et al. Closed-loop artificial pancreas systems: engineering the algorithms. Diabetes Care. 2014;37:1191–1197. doi: 10.2337/dc13-2108. [DOI] [PMC free article] [PubMed] [Google Scholar]
- [Ginsberg 2017] .Ginsberg BH, Klonoff DC, Crabtree VP. Meeting Report: The Fourth Artificial Pancreas Workshop: Testing and Adoption of Current and Emerging Technologies. J Diabetes Sci Technol. 2017 doi: 10.1177/1932296817699640. (In Press) [DOI] [PMC free article] [PubMed] [Google Scholar]
- [Haidar 2013] .Haidar A, Elleri D, Kumareswaran K, Leelarathna L, Allen JM, Caldwell K, Murphy HR, Wilinska ME, Acerini CL, Evans ML, Dunger DB, et al. Pharmacokinetics of insulin as part in pump-treated subjects with Type 1 diabetes: reproducibility and effect of age, weight, and duration of diabetes. Diabetes Care. 2013;36(10):E173–E174. doi: 10.2337/dc13-0485. [DOI] [PMC free article] [PubMed] [Google Scholar]
- [Herrero 2012] .Herrero P, Georgiou P, Oliver N, Johnston D, Toumazou C. A bio-inspired glucose controller based on pancreatic β-cell physiology. J Diabetes Sci Technol. 2012;6(3):606–615. doi: 10.1177/193229681200600316. [DOI] [PMC free article] [PubMed] [Google Scholar]
- [Herrero 2013] .Herrero P, Georgiou P, Oliver N, Reddy M, Johnston D, Toumazou C. A composite model of glucagon-glucose dynamics for in silico testing of bihormonal glucose controllers. J Diabetes Sci Technol. 2013 Jul 1;7(4):941–51. doi: 10.1177/193229681300700416. [DOI] [PMC free article] [PubMed] [Google Scholar]
- [Hovorka 2004] .Hovorka R, Canonico V, Chassin LJ, Haueter U, Massi-Benedetti M, Orsini Federici M, Pieber TR, Schaller HC, Schaupp L, Vering T, Wilinska ME. Nonlinear model predictive control of glucose concentration in subjects with type 1 diabetes. Physiol Mea. 2004;25(4):905–20. doi: 10.1088/0967-3334/25/4/010. [DOI] [PubMed] [Google Scholar]
- [Jacobs 2014] .Jacobs PG, El Youssef J, Castle J, Bakhtiani P, Branigan D, Breen M, Bauer D, Preiser N, Leonard G, Stonex T, Ward WK. Automated control of an adaptive bihormonal, dual-sensor artificial pancreas and evaluation during inpatient studies. IEEE Trans Biomed Eng. 2014;61(10):2569–81. doi: 10.1109/TBME.2014.2323248. [DOI] [PMC free article] [PubMed] [Google Scholar]
- [Kovatchev 2009] .Kovatchev BP, Breton M, Dalla-Man C, Cobelli C. In silico preclinical trials: a proof of concept in closed-loop control of Type 1 diabetes. J Diabetes Sci Technol. 2009;3(1):44–55. doi: 10.1177/193229680900300106. [DOI] [PMC free article] [PubMed] [Google Scholar]
- [Kropff 2016] .Kropff J, DeVries JH. Continuous Glucose Monitoring, Future Products, and Update on Worldwide Artificial Pancreas Projects. Diabetes Technol Ther. 2016 Feb;18(Suppl 2):S253–63. doi: 10.1089/dia.2015.0345. [DOI] [PMC free article] [PubMed] [Google Scholar]
- [Maahs 2016] .Maahs DM, et al. Outcome Measures for Artificial Pancreas Clinical Trials: A Consensus Report. Diabetes Care. 2016 Jul;39(7):1175–9. doi: 10.2337/dc15-2716. [DOI] [PMC free article] [PubMed] [Google Scholar]
- [Pedersen 2010] .Pedersen MG, Toffolo GM, Cobelli C. Cellular modeling: insight into minimal models of insulin secretion. Am J Physiol Endocrinol Metab. 2010;298(3):E597–601. doi: 10.1152/ajpendo.00670.2009. [DOI] [PubMed] [Google Scholar]
- [Reddy 2014] .Reddy M, Herrero P, El Sharkawy M, Pesl P, Jugnee N, Thomson H, Pavitt D, Toumazou C, Johnston D, Georgiou P, Oliver N. Feasibility study of a Bio-inspired Artificial Pancreas in adults with type 1 diabetes. Diabetes Technol Ther. 2014;16(9):10–17. doi: 10.1089/dia.2014.0009. [DOI] [PMC free article] [PubMed] [Google Scholar]
- [Reddy 2015] .Reddy M, Herrero P, El-Sharkawy M, Pesl P, Jugnee N, Pavitt D, Godsland IF, Alberti G, Toumazou C, Johnston DG, Georgiou P, et al. Metabolic Control with the Bio-inspired Artificial Pancreas in Adults With Type 1 Diabetes: A 24-Hour Randomized Controlled Crossover Study. J Diabetes Sci Technol. 2015;10(2):405–413. doi: 10.1177/1932296815616134. [DOI] [PMC free article] [PubMed] [Google Scholar]
- [Riz 2014] .Riz M, Pedersen MG, Toffolo GM, Haschke G, Schneider HC, Klabunde T, Margerie D, Cobelli C. Minimal modeling of insulin secretion in the perfused rat pancreas: a drug effect case study. Am J Physiol Endocrinol Metab. 2014;306(6):E627–34. doi: 10.1152/ajpendo.00603.2013. [DOI] [PubMed] [Google Scholar]
- [Russell 2014] .Russell SJ, El-Khatib FH, Sinha M, Magyar KL, McKeon K, Goergen LG, Balliro C, Hillard MA, Nathan DM, Damiano ER. Outpatient glycemic control with a bionic pancreas in type 1 diabetes. N Engl J Med. 2014;371:313–325. doi: 10.1056/NEJMoa1314474. [DOI] [PMC free article] [PubMed] [Google Scholar]
- [Schiavon 2013] .Schiavon M, Dalla-Man C, Kudva YC, Basu A, Cobelli C. In Silico Optimization of Basal Insulin Infusion Rate during Exercise: Implication for Artificial Pancreas. J Diabetes Sci Technol. 2013 Nov;7(6):1461–1469. doi: 10.1177/193229681300700606. [DOI] [PMC free article] [PubMed] [Google Scholar]
- [Taleb 2016] .Taleb N, Emami A, Suppere C, Messier V, Legault L, Ladouceur M, Chiasson JL, Haidar A, Rabasa-Lhoret R. Efficacy of single-hormone and dual-hormone artificial pancreas during continuous and interval exercise in adult patients with type 1 diabetes: randomised controlled crossover trial. Diabetologia. 2016;59(12):2561–2571. doi: 10.1007/s00125-016-4107-0. [DOI] [PubMed] [Google Scholar]
- [Wasserma 2009] .Wasserman David H. Four grams of glucose. Am J Physiol Endocrinol Metab. 2009;296:E11–E21. doi: 10.1152/ajpendo.90563.2008. [DOI] [PMC free article] [PubMed] [Google Scholar]


