Abstract
In plant breeding programs, screening for drought-tolerance is often a bottleneck. An experiment was conducted in the field and rainout shelters to: (1) identify physiological traits in breeding programs that can be used as criteria for selecting drought tolerance soybean genotypes [Glycine max (L.) Merr], (2) evaluate genotypic differences to drought tolerance, and (3) identify genotypes with superior drought tolerance. Sixteen genotypes were evaluated in split plot design under irrigated and drought conditions. Various physiological traits were measured in irrigated and drought stressed plants such as canopy temperature, root length, specific leaf weight, photosynthetic rate, chlorophyll, and epicuticular wax content. As compared with irrigated conditions, the percent reduction in mean soybean yield under rainout shelter was 40%. The mean yields of soybean genotypes ranged from 1162 kg/ha (NRC 12) to 2610 kg/ha (JS 335) under irrigated conditions, whereas, under water stress conditions, yields ranged from 852 kg/ha (Samrat) to 1654 kg/ha (EC 538828). Genotypes EC 538828, JS 97-52, EC 456548, and EC 602288 had better avoidance to drought than other genotypes. The superior drought tolerance of the four genotypes was related to their low canopy temperature, deep root system, and high values for root/shoot weight ratio, specific leaf weight, chlorophyll content, photosynthetic rate, epicuticular wax content, and Photosystem II (PSII) efficiency. Therefore, when genetic diversity of these physiological traits is established in breeding programs, these traits can be used as a selection criterion for selecting drought tolerant genotypes.
Electronic supplementary material
The online version of this article (10.1007/s12298-019-00665-5) contains supplementary material, which is available to authorized users.
Keywords: Drought stress, Phenotyping, Root traits, Seed yield, Soybean
Introduction
Drought is the most significant environmental stress for crop production worldwide (Tuberosa and Salvi 2006). Under rainfed conditions, occurrence of drought at one or more stages of crop growth is one of the most important constraints that limit soybean productivity (Cattivelli et al. 2008; Bhatia et al. 2014a, b; Jumrani and Bhatia 2015, 2018; Jumrani et al. 2018, 2017; Bhatia and Jumrani 2016). Unfortunately, the problem of drought is expected to further accentuate because of global climate change; predictions are that increased temperatures (increased evapotranspirative demand) will result in increased frequency and severity of drought episodes. Drought influences plants differently depending on the crop growth stage (vegetative or reproductive) at which it occurs (Lopez et al. 2003). In general, drought causes soybean yield loss of up to 40% (Specht et al. 1999; Le et al. 2012); however, it could be as high as 80% depending upon the intensity of drought and the growth stage (Oya et al. 2004; Dias et al. 2012; Bhatia et al. 2014b). Barring a few efforts, no systematic studies have been conducted to develop drought-tolerant soybean varieties in India. The lack of such efforts is due to complexities of drought and non-availability of proper screening facilities in India, though in recent years such modern phenotyping platforms facilities have been created in India such as at IARI, New Delhi and ICRISAT, Hyderabad, which are accessible to all public research organizations (Yordanov et al. 2000; Nagarathna et al. 2012). The use of physiological traits as indirect selection criteria for yield depends on their relative genetic correlation with yield and genotype-by-environment interaction. In breeding programs, when genetic diversity for a particular trait has been ascertained, relevance of that trait as a selection criterion needs to be determined. Identification of relevant physiological traits is time-consuming; however, if successful, the benefits are likely to be rewarding (Reynolds and Trethowan 2007).
Roots are the main organ responsible for mining of water from the soil. Root traits responsible for maintaining plant productivity under water-stress conditions, such as root length, root dry weight, and volume and number of lateral roots, are highly correlated to drought tolerance in soybean (Liu et al. 2005). During early vegetative growth, development of larger and deeper roots would help the plant to maintain turgor under drought conditions (Hirasawa et al. 1994). Canopy temperature is a useful criterion for identifying high-yielding genotypes under drought conditions (Araus et al. 2002; Araus 2003; Olivares Villegas et al. 2007). Canopy temperature is a function of transpiration cooling and is an indicator that explains the water relations in crops. Canopy temperature is used as screening tool for identifying drought-tolerant genotypes (Rashid et al. 1999). Chlorophyll concentration has been known to be linked with photosynthesis (Zobayed et al. 2005). Under drought stress, chlorophyll content of plant species has been shown to decrease or remain unchanged depending on the duration and intensity of stress (Kypoarissis et al. 1995). Therefore, a decrease in concentration of chlorophyll in plants could be a non-stomatal limiting factor under drought conditions; a high level of chlorophyll is indicative of drought tolerance (Kraus et al. 1995). Leaves having higher specific leaf weight usually have higher chlorophyll content and thereby enhance photosynthetic efficiency per unit leaf area as compared with leaves with lower specific leaf weight (Jumrani et al. 2017).
Photosynthesis in plants has been considered an important indicator of growth because of its significant relationship to productivity (Piao et al. 2008; Jumrani et al. 2017). Studies have shown that drought stress adversely affected photosynthesis and associated parameters (Menconi et al. 1995; Guenni et al. 2004). Reduction in gas exchange parameters under drought conditions could be attributed to stomatal or non-stomatal factors, such as decline in leaf expansion, premature leaf senescence, impaired photosynthetic machinery, reduction in electron transport, oxidation of chloroplast lipids, decline in synthesis of ATP and NADPH, stomatal closure, increase in intercellular CO2, changes in structure of light harvesting systems and proteins, carbon reduction cycle in the chloroplast and utilization of photosynthates (Allen and Ort 2001; Blum 2005; Samarah et al. 2009). High rate of photosynthesis and associated parameters are related to drought tolerance (Ashraf and Harris 2013). In recent years, chlorophyll fluorescence measurements have been used as a powerful tool to understand and quantify the non-stomatal inhibition (photochemical) of photosynthetic efficiency. Chlorophyll fluorescence techniques are used for screening of tolerant genotypes under abiotic stress conditions and it gives us valuable information about the imperfect energy dissipation and changes in the efficiency of photochemistry (Ohashi et al. 2006; Oukarroum et al. 2007; Ristic et al. 2007; Jumrani et al. 2017). The highest quantum yield of photosystem II (PSII) is expressed as the ratio of variable fluorescence to maximal chlorophyll fluorescence (Fv/Fm), which is a good indicator to evaluate photoinhibition of plants under abiotic stress conditions (Paknejad et al. 2007). Leaf cuticular waxes cover aerial plant surfaces, which help the plant to form protective barrier with its environment. Genetic variation in epicuticular wax content has been shown to exist in many crops, including soybean (Premachandra et al. 1994; Jenks et al. 1996; Kim et al. 2007).
Late arrival, uneven distribution and quantum of rainfall affect the productivity of many crops and the problem is expected to worsen in the future (IPCC 2013). To bring stability and sustainability to soybean production in the country, there is a need to develop drought tolerant soybean genotypes (Pennisi 2008). Therefore, identification of drought-tolerant genotypes is a major goal in any crop-breeding program, which requires a renewed emphasis on phenotyping for specific and well-defined physiological traits. Soybean is mainly grown under rainfed conditions and the climatic variability plays a critical role in determining its productivity. Despite drought being a major factor limiting soybean productivity, efficient breeding programmes is lacking for developing drought tolerant soybean genotypes. Therefore, the main objectives of this study were (1) to identify physiological traits that may be useful in improving drought tolerance in soybean breeding programs, (2) to evaluate differences in soybean genotypes to drought tolerance, and (3) to identify genotypes with superior drought tolerance.
Materials and methods
Experimental site and weather conditions
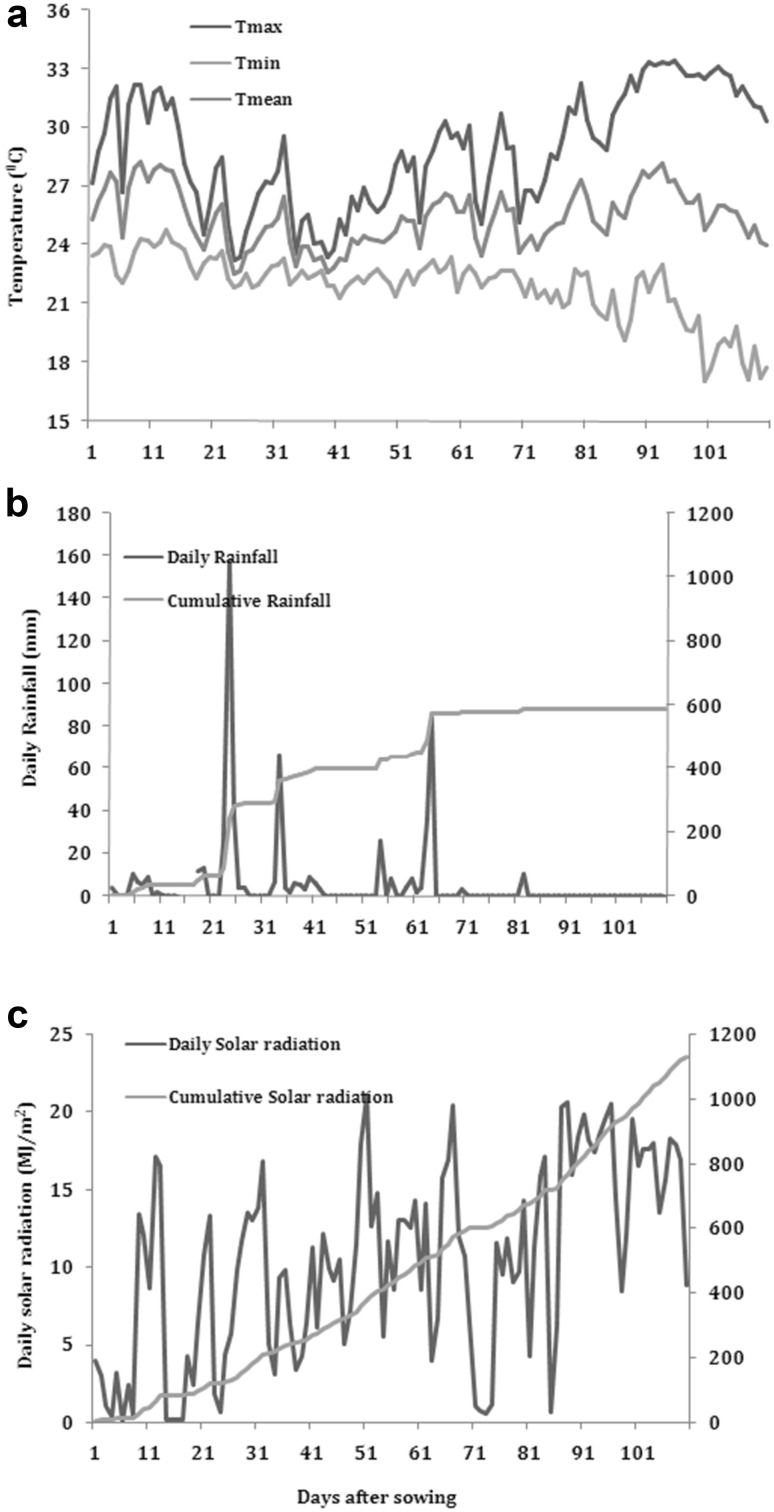
The experiment was conducted at ICAR-Indian Institute of Soybean Research, Indore (22.78°N, 75.88°E), Madhya Pradesh, India. The average weather conditions for the crop season (sowing till harvest) are given in Fig. 1. The mean daily temperatures during the crop season ranged from 22.5 to 28.2 °C, with an average value of 25.4 °C. The total rainfall during crop season was 587 mm and the cumulative solar radiation was 1131 MJ/m2.
Fig. 1.
Weather data a temperature, b rainfall and c solar radiation for growing season
Soil moisture content
The experimental soil belonged to sarol soil series (Fine, iso-hyperthermic, montmorillonitic, Typic Haplusterts) with 150 cm depth, high water-holding capacity (32–35%), and medium fertility. The soil is predominant in Smectite (66%) type of clay mineral followed by Illite (26%) and Kaolinite (7%). The soil moisture content was quantified at different depths using auger in water stress and irrigated conditions. Sampling for soil moisture content was done after 11, 42, 60, 77 and 90 days of sowing. The average soil moisture content was measured in different strata (15, 30, 60, 90 and 120 cm depth) of both irrigated plots and plots under rainout shelter. Following are the soil moisture characteristics; 0.33 bar-36.9%; 5 bar-25.2%; 15 bar-16.5%.
Field evaluation of soybean genotypes
Sixteen soybean genotypes (8 early and 8 late maturing) viz. JS 71-05, JS 95-60, NRC 7, EC 538828, NRC 12, Samrat, MACS 330, EC 456548, JS 335, JS 93-05, JS 97-52, Hardee, Punjab 1, EC 602288, NRC 2 and NRC 37 (details has been attached as supplementary file) were evaluated for drought in a split-plot design with three replications. The main plots consisted of irrigated and water stress treatments and subplots consisted of 16 genotypes. Under irrigated conditions, plot size for each genotype consisted of six rows, each of 5 m length. The recommended row-to-row and plant-to-plant distance was 45 cm and 5 cm, respectively, with a plant population of about 450,000 plants/ha. Water stress at the reproductive stage was created by growing the genotypes in two rainout shelters of 15 × 7 m size, one each for early and late-maturing genotypes (Fig. 2). In rainout shelters, each genotype was grown in a plot consisting of 3 rows, each of 3 m length, in three replications. To achieve this, the rainout shelters were kept open (unprotected from rain) till flowering and were irrigated. After flowering, the rainout shelters were activated so that plants were protected from rains. This resulted in gradual loss of soil moisture and severe drought conditions occurring 10–12 days after the plants reached R5 stage under rainout shelter. Both under irrigated and rainout shelter conditions, before planting, a recommended dose of fertilizers was applied and seeds of soybean genotypes were treated with Rhizobium japonicum and recommended fungicides. The control plants were kept free from any soil moisture stress by applying irrigations as and when required. At harvest maturity, plants from each plot (total 3 plots) were collected from irrigated and water-stress treatment and seed yield (kg/ha) per plot was calculated.
Fig. 2.
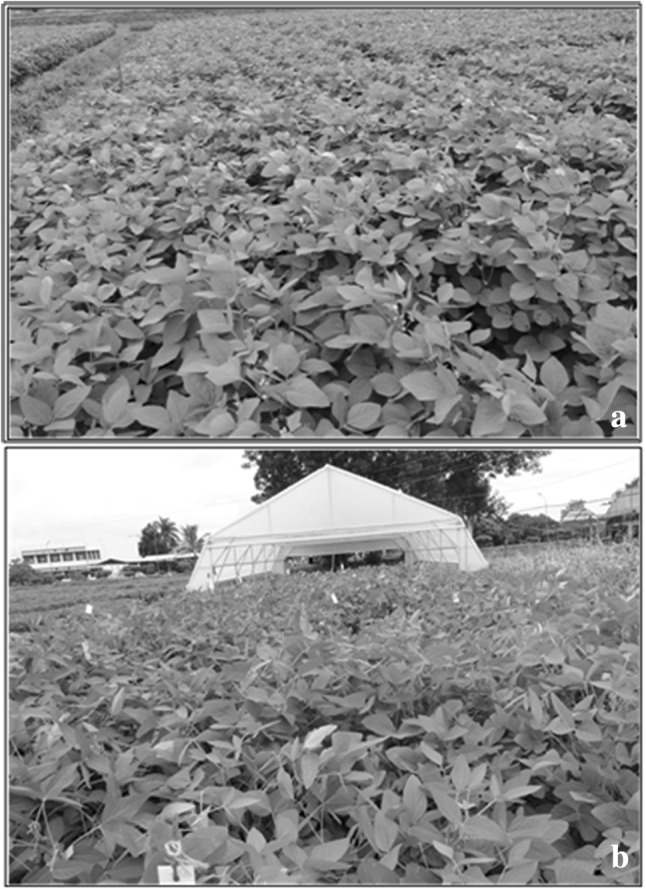
Photograph showing a irrigated conditions b rain out shelter
Root characteristics
To evaluate genotypes for their root characteristics, 16 genotypes were planted in 2 m tall 20 cm wide polyvinyl chloride (PVC) cylinders. These PVC cylinders were kept in the field under ambient conditions and plants were grown in them at the same time as the field experiment (irrigated and water stress treatment). Each pipe was filled with farm soil (black clay) and farmyard manure mixed in the ratio of 2:1. In all, there were 96 pipes, i.e., 6 pipes per genotype. The pipes were soaked with tap water 24 h before planting. Before sowing, a recommended dose of fertilizers was applied and the seeds were treated with fungicides, viz., bavistin and dithane M and inoculated with slurry of Rhizobium japonicum. Five seeds of uniform size were sown in each pipe. One week after sowing, thinning was done to keep one plant per pipe. The plants were irrigated daily to avoid water stress and appropriate measures were taken to keep the plants free from any biotic stresses. Plants were harvested at beginning of seed-fill stage (R5 stage). Roots were washed from the pipe and data on root length (tap and lateral roots) was recorded. Samples of root and shoot were dried in an oven at 70 °C for 72 h and dry weights were recorded.
Measurement of water potential
To monitor the water status of the plants, leaf water potential was measured daily in control and water stressed plants. Measurements were taken from youngest, fully expanded third leaf from the top in each treatment between 9.00 a.m. and 10.00 a.m. The leaf water potential was recorded using psychrometers (Wescor Inc, S, Logan, UT, USA) having eight C 52 sample chambers and a Psypro water potential data logger. Leaves were punched and the leaf discs were kept in the sample chamber for 30 min and then readings were recorded. (Water potential values of all the genotypes under water stress and irrigated conditions at different stages have been attached as a supplementary file).
Canopy temperature
Canopy temperature was recorded at R5 stage (initiation of seed fill stage) using a non-contact infrared thermometer (Palmer Wahl, model DHS115XEL). The thermometer was held in a south-facing direction such that the sensor viewed only the canopy (Guendouz et al. 2012) and was kept from sensing the soil surface. All the measurements of canopy temperature were made in three replications (5 plants/replication) in irrigated and water-stress treatment in late morning to early afternoon (cloudless period) (11.00–15.00 h).
SPAD chlorophyll meter reading (SCMR)
Non-destructive assessment of chlorophyll content was done by Single Photoelectric Analyzing Diode (SPAD) meter (Minolta chlorophyll meter SPAD-502, Spectrum Technologies, USA), which is based on leaf transmittance at 650 and 940 nm (Markwell et al. 1995). The readings were recorded on an intact fully expanded third leaf from top at R5 stage in irrigated and water-stress treatment in three replications (5 leaves/replication).
Specific leaf weight (SLW)
At R5 stage, leaf discs of 2 cm2 were taken from fully expanded third leaf from top in irrigated and water-stress treatment in three replications (5 leaves/replication) and oven dried at 70 °C for 72 h. The specific leaf weight (SLW) was calculated as SLW (g/cm2) = leaf dry weight/leaf area.
Measurements of net photosynthetic rate and chlorophyll fluorescence
At R5 stage, five plants from each genotype were selected in the field and photosynthetic gas exchange and chlorophyll fluorescence were measured in fully expanded third leaf from the top in irrigated and water-stress treatment in three replications (5 leaves/replication) using portable photosynthesis system (LI-6400 XT, LI-COR, Lincoln, NE, USA). A leaf was fitted into leaf chamber and gas exchange measurements were made at ambient CO2 concentration (390–400 μmol CO2 mol−1 air) and PAR of 1000 µmol m−2s−1 between 10.00 and 12.00 a.m. Chlorophyll fluorescence parameters were recorded in the fully expanded third leaf from the top (dark-adapted leaf for ~ 30 min) using LI-6400 XT portable photosynthesis system equipped with 6400-40 leaf chamber fluorometer.
Epicuticular wax
Epicuticular wax content was extracted and quantified from an intact fully expanded third leaf from top at R5 stage in irrigated and water-stress treatments in three replications (5 leaves/replication) using a colorimetric method (Ebercon et al. 1976; Mamrutha et al. 2010). Freshly harvested leaf was immersed for 15 s in 30 mL redistilled chloroform by holding the petiole. The extract was filtered and the chloroform was evaporated to dryness at 70 °C in water bath. To the extracted waxes, 5 mL of acidic potassium dichromate reagent was added (prepared by dissolving 20 g of potassium dichromate in 1 L of H2SO4 and boiled for half an hour) and the samples were heated for 30 min at 100 °C. After cooling, 12 mL of deionized water was added to each sample and allowed for color development. The optical density of the samples was measured at 590 nm. Total leaf surface wax amount was expressed as mg/dm2 by recording the leaf area.
Statistical analysis
Analysis of variance was carried out via MSTATC software according to split-plot design, with soil moisture as main plots and genotypes as sub-plots. The means of main effects and interaction of genotypes with soil moisture treatment were tested using the least significant difference (LSD) at P ≤ 0.05 (Bhatia and Jumrani 2016). The association of observed yield under irrigated and water deficit conditions in 16 genotypes (n = 14) with various physiological traits in three replications was determined by computing the correlation coefficients (r) and regression coefficients (R2).
Results and discussion
Soil moisture content
In irrigated plots, the soil moisture was adequate throughout the crop growth period. Because of irrigations applied, whenever there was a significant gap between rainfall events, the soil moisture in 15 cm depth was slightly higher as compared to other soil depths. The soil moisture in 15 cm soil zone ranged from 27.5 to 29.2%. In other zones (30, 45, 60, 90 and 120 cm), the soil moisture content ranged from 25.5 to 29%. In contrast, there was substantial reduction in soil moisture content in different soil zones due to water stress imposed under rainout shelters. In rainout shelter wherein early maturing soybean genotypes were planted, the soil moisture was more or less similar to irrigated plots during the first sampling (11 DAS). As the plots under rainout shelter was protected from rainwater till 35 days after sowing by switching on the rainout shelter, a significant reduction in moisture content in different soil zones was observed in the subsequent samplings. The loss of water was more severe from upper soil zones as compared to lower zones. The soil moisture in 15 cm zone reduced to 27.0, 19.0, 14.0 and 12.1% while in 30 cm zone, it was reduced to 25.0, 21.0, 17.7 and 15.5% at samplings carried out at 42, 60, 77 and 90 days after sowing, respectively. In the deeper zones, the depletion was not that severe and soil moisture in 120 cm depth was 27% after 42 and 60 days, 26.2% after 77 days and 23.6% after 90 days of sowing. Similarly, in the rainout shelter wherein late maturing soybean genotypes were planted, the protection from rainwater began only after 45 DAS and therefore, the soil moisture was more or less similar to irrigated plots until second sampling (42 DAS). Subsequently, the soil moisture depleted in similar way as in the case of rainout shelter in which, early maturing genotypes were planted. However, the degree of water depletion particularly in deeper zone was slightly more in rainout shelter in which late maturing genotypes were planted as compared to the one in which early maturing genotypes were planted due to longer roots in late maturing genotypes.
Evaluation of genotypes for drought tolerance
Seed yield
Results of present study clearly indicated that soybean yield is significantly influenced by soil moisture. The soybean yields were significantly higher (2134 kg/ha) under irrigated conditions as compared with water-stress conditions (1282 kg/ha). The water stress at reproductive stage led to decline in seed yield that ranged from 20 to 62% (Table 1). There was a significant interaction between soil moisture treatment and genotypes, which indicated significant difference in the performance of soybean genotypes under irrigated and water-stress conditions. Under irrigated conditions, JS 335 had the highest (2610 kg/ha) and NRC 12 had the lowest seed yield (1662 kg/ha) (Table 1). On the other hand, the highest yield under water stress condition was observed in EC 538828 (1654 kg/ha) and the lowest in Samrat (852 kg/ha). Percent decline in seed yield under soil moisture deficit as compared with irrigated conditions was among the lowest in genotypes EC 538828 (20%), EC 456548 (28%), EC 602288 (31%), and JS 97-52 (33%). The percent reduction in rest of the genotypes ranged from 34% (Hardee) to as high as 62% (NRC 37). The data also revealed that the skewness and kurtosis were non-significant, indicating that the results followed a normal distribution.
Table 1.
Interactive effect of soil moisture treatment on seed yield of soybean genotypes
| Genotypes (G) | Seed yield (kg/ha) | |||
|---|---|---|---|---|
| Soil moisture treatment (SM) | ||||
| Irrigated | Water stress | Mean | Reduction* (%) | |
| JS 71-05 | 2411 ± 15ab | 1519 ± 33a | 1965A | − 37 |
| JS 95-60 | 2283 ± 33ab | 1400 ± 29abcd | 1841ABC | − 39 |
| NRC 7 | 2231 ± 75abc | 1459 ± 77ab | 1845ABC | − 35 |
| EC 538828 | 2058 ± 75bcd | 1654 ± 43a | 1856ABC | − 20 |
| NRC 12 | 1662 ± 60d | 1095 ± 40bcdef | 1378EF | − 34 |
| Samrat | 2146 ± 165abcd | 852 ± 160f | 1499DE | − 60 |
| MACS 330 | 1681 ± 47d | 897 ± 77f | 1289F | − 47 |
| EC 456548 | 2010 ± 16bcd | 1450 ± 48abc | 1730BC | − 28 |
| JS 335 | 2610 ± 170a | 1303 ± 22abcde | 1957A | − 50 |
| JS 93-05 | 2221 ± 127abc | 1397 ± 14abcd | 1809ABC | − 37 |
| JS 97-52 | 2256 ± 98ab | 1514 ± 7a | 1885ABC | − 33 |
| Hardee | 2297 ± 176ab | 1515 ± 9a | 1906AB | − 34 |
| Punjab 1 | 1710 ± 95 cd | 1051 ± 105cdef | 1381EF | − 39 |
| EC 602288 | 2096 ± 41abcd | 1453 ± 14ab | 1774ABC | − 31 |
| NRC 2 | 2036 ± 12bcd | 1022 ± 176def | 1529DE | − 50 |
| NRC 37 | 2438 ± 125ab | 924 ± 75ef | 1681CD | − 62 |
| Mean | 2134A | 1282B | − 40 | |
| Skewness | 0.0131 (ns) | |||
| Kurtosis | − 0.7575 (ns) | |||
| LSD (P ≤ 0.05) | ||||
| G | 130.9 | |||
| SM | 172.6 | |||
| G × SM | 244.0 | |||
*Average reduction in seed yield in water stress plants as compared to irrigated conditions. Values are means of three replicates ± SE; values followed by the same small letter in vertical comparison are not significantly different at P = 0.05 using Fisher least significant difference. Values followed by the same capital letter in both horizontal and vertical comparison are also not significantly different at P = 0.05
Association of yield with physiological traits
An attempt was made to understand the association of various physiological traits with drought tolerance in soybean.
Root study
Drought adaptation requires combination of several phenological (Nguyen et al. 1997), morphological (Fukai and Cooper 1995) physiological, biochemical and molecular traits (Chopra and Sinha 1998). Roots are the main organ responsible for water mining from the soil and therefore, root traits such as root lengths, root dry weight, root volume and root/shoot weight ratio play an important role in providing tolerance to drought in soybean (Hirasawa et al. 1994; Liu et al. 2005; Serraj et al. 2011). Plants can cope up with drought conditions by developing a longer tap root which helps to mine water from deeper soil zones (Subbarao et al. 1995; Wu and Cosgrove 2000; Kashiwagi et al. 2005). An attempt was made to study the root characteristics of soybean genotypes, which were evaluated for drought tolerance using PVC pipes under irrigated conditions (Fig. 3). Genotypes differed significantly in all the root characteristics for which observations were recorded. The mean tap root length of the genotypes was 130 cm, which ranged from 44 to 202 cm (Table 2). Among the genotypes, largest tap root length was observed in Hardee (202 cm), followed by JS 97-52 (190 cm) and EC 602288 (170 cm). The smallest root length was observed in MACS 330 (44 cm) (Fig. 4). The mean length of longest lateral root among the genotypes was 119 cm, with a range of 45 cm to 197 cm (Table 2). Similar to the tap root length, the largest lateral root length was observed in Hardee (197 cm), followed by JS 97-52 (184 cm) and EC 602288 (153 cm) and the minimum was in MACS 330 (45 cm). Similar to root length, wide variability was observed for root dry weight. Mean root dry weight was 7.73 g/pl, which ranged from 0.8 to 21.6 g/pl. Among the genotypes, JS 97-52 showed the largest root weight (21.6 g/pl), whereas, it was 16.3 g/pl for Hardee and 14.9 g/pl for EC 602288. The genotypes with small roots length also showed low root dry weight; e.g., MACS 330 (0.8 g/pl) and Samrat (2.0 g/pl). To calculate the root/shoot weight, at the time of sampling (R5 stage), shoot dry weight was also recorded. Mean shoot dry weight was 29.7 g/pl, which ranged from 7.6 to 61.2 g/pl. Mean value of root to shoot weight ratio was 0.26, which ranged from 0.10 to 0.35 (Table 2). The genotypes that showed relatively high root to shoot weight ratio were Hardee, JS 97-52, EC 538828 (0.35), NRC 7, JS 71-05 (0.33) and EC 602288 (0.32). As against this, root/shoot weight was low in MACS 330 (0.10) and NRC 37 (0.12). Thus, better root architecture aids the plant to mine water from a deep soil, which helped the plants to survive under water stress conditions. Among genotypes, MACS 330, an early maturing genotype had the shortest root length and lowest root/shoot weight ratio, which may explain the vulnerability of this genotype to drought conditions despite being early maturing type. Similarly, genotypes, which showed high reduction in seed yield under water deficit conditions also showed poor root characteristics, indicating that root characteristics played an important role in imparting tolerance to drought in soybean. The skewness and kurtosis among the different root characteristics except for root weight were non-significant indicating that the parameters followed a normal distribution.
Fig. 3.
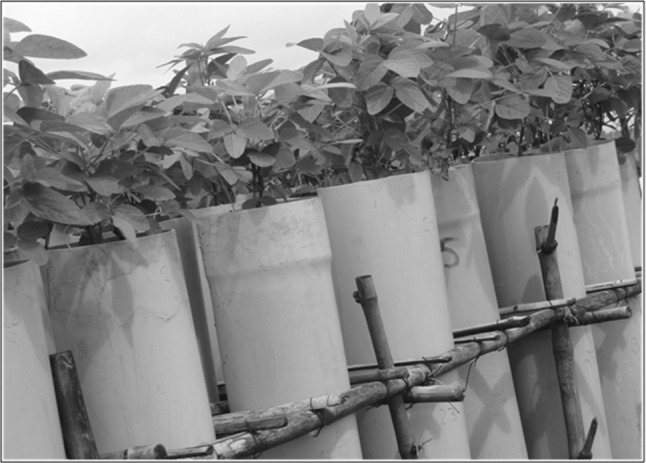
Photograph showing PVC pipes under which plants were grown for root parameters
Table 2.
Root characteristics of soybean genotypes evaluated for drought tolerance
| Genotypes | Tap root length (cm) | Lateral root length (cm) | Shoot weight (g) | Root weight (g) | Root/shoot weight ratio |
|---|---|---|---|---|---|
| JS 71-05 | 156 ± 3.8abcd | 113 ± 12.0bcdef | 16.6 ± 0.1efg | 5.5 ± 0.2cde | 0.33 ± 0.01a |
| JS 95-60 | 140 ± 5.8bcde | 70 ± 2.9fg | 11.7 ± 0.3g | 3.1 ± 0.0def | 0.26 ± 0.01cd |
| NRC 7 | 145 ± 5.8bcd | 125 ± 5.0bcde | 16.8 ± 1.2efg | 5.5 ± 0.1cde | 0.33 ± 0.03a |
| EC 538828 | 145 ± 5.8bcd | 120 ± 5.0bcdef | 15.8 ± 0.6 fg | 5.5 ± 0.2 cde | 0.35 ± 0.02a |
| NRC 12 | 119 ± 13.9cdef | 99 ± 9.3def | 36.1 ± 0.9bc | 7.3 ± 0.2cd | 0.20 ± 0.01e |
| Samrat | 64 ± 3.0gh | 75 ± 2.9efg | 11.6 ± 0.6g | 2.0 ± 0.1ef | 0.17 ± 0.00e |
| MACS 330 | 443 ± 0.58h | 45 ± 0.3g | 7.6 ± 0.7g | 0.8 ± 0.2f | 0.10 ± 0.02a |
| EC 456548 | 135 ± 30.1cdef | 103 ± 12.0cdef | 17.6 ± 1.6defg | 5.3 ± 0.5ce | 0.30 ± 0.01abc |
| JS 335 | 110 ± 5.8defg | 115 ± 2.8bcdef | 29.5 ± 0.9cde | 8.1 ± 0.5c | 0.28 ± 0.02bcd |
| JS 93-05 | 145 ± 5.8bcd | 163 ± 9.3ab | 26.2 ± 0.4cdef | 7.0 ± 0.3cd | 0.27 ± 0.01cd |
| JS 97-52 | 190 ± 2.9ab | 184 ± 3.0a | 61.2 ± 0.9a | 21.6 ± 1.1a | 0.35 ± 0.02a |
| Hardee | 202 ± 7.3a | 197 ± 6.7a | 47.2 ± 5.7b | 16.3 ± 2.8b | 0.35 ± 0.03a |
| Punjab 1 | 132 ± 11.1cdef | 129 ± 9.6bcd | 39.4 ± 5.1bc | 8.6 ± 0.2c | 0.22 ± 0.02de |
| EC 602288 | 170 ± 11.6abc | 153 ± 26.0abc | 46.1 ± 0.7b | 14.9 ± 0.8b | 0.32 ± 0.02ab |
| NRC 2 | 90 ± 5.8efgh | 118 ± 13.0bcdef | 30.5 ± 0.2 cd | 6.2 ± 0.4cde | 0.20 ± 0.01e |
| NRC 37 | 85 ± 3.0fgh | 100 ± 7.7def | 61.6 ± 0.2a | 7.2 ± 0.2 cd | 0.12 ± 0.00f |
| Mean | 130 | 119 | 29.7 | 7.7 | 0.26 |
| Skewness | − 0.2656 (ns) | 0.3326 (ns) | 0.6642 (s) | 1.4096 (s) | − 0.4605 (ns) |
| Kurtosis | − 0.6922 (ns) | − 0.3932 (ns) | − 0.7001 (ns) | − 1.6941 (s) | − 0.4377 (ns) |
| LSD (P ≤ 0.05) | 28.5 | 28.4 | 7.48 | 2.41 | 0.054 |
Values are means of three replicates ± SE; values followed by the same small letter in vertical comparison are not significantly different at P = 0.05 using Fisher least significant difference
Fig. 4.
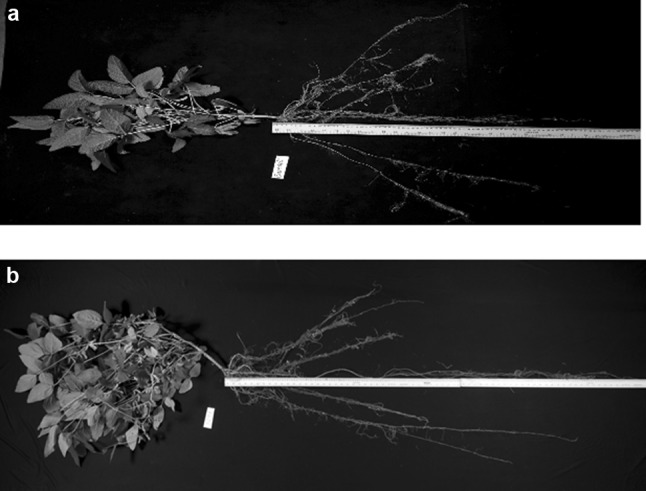
Photograph showing variation among genotypes for root length a Samrat b JS 97-52
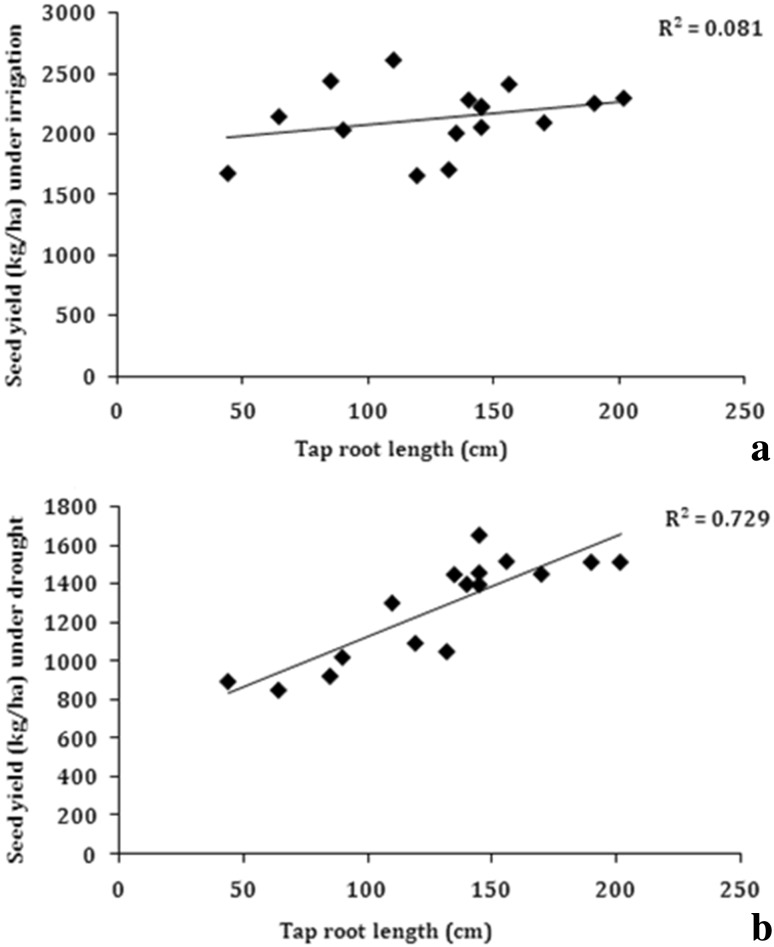
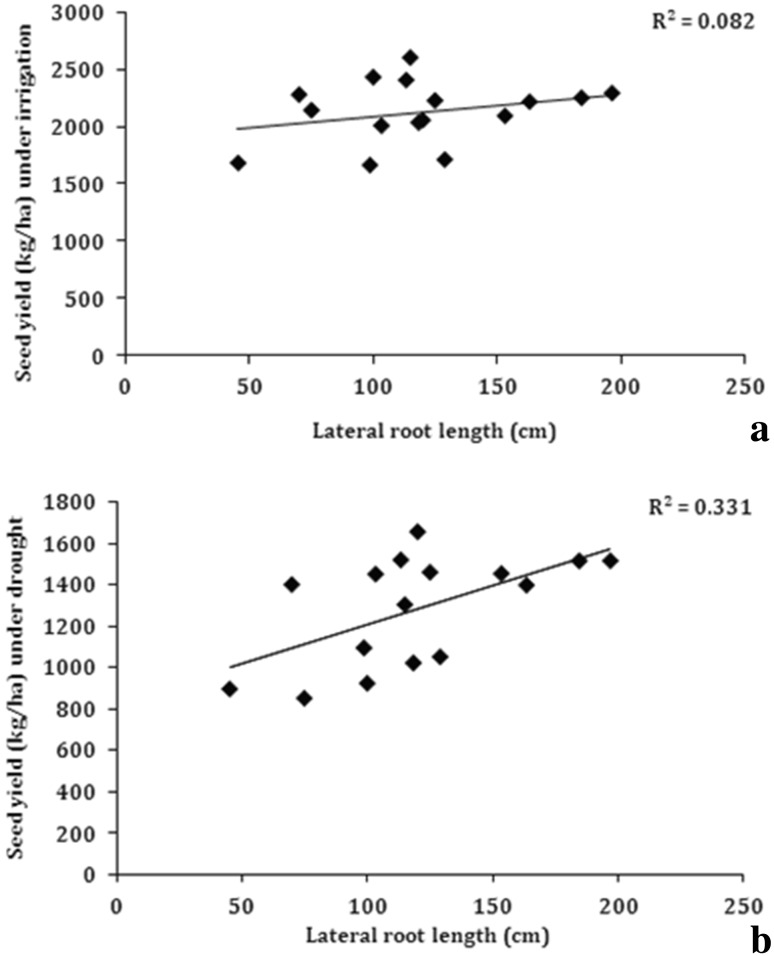
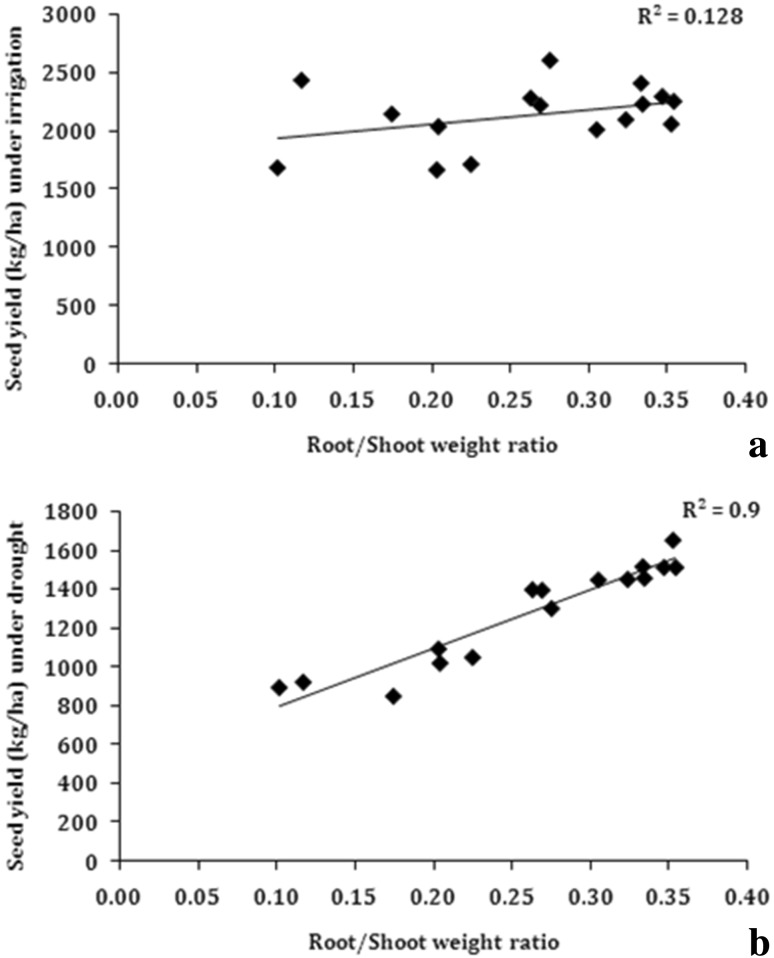
To understand the role of root traits in determining the yield, the observed traits were plotted against seed yield obtained under soil moisture deficit conditions in rainout shelters. Under water stress conditions, a significant positive and linear association between seed yield and tap root length (R2 = 0.73) was observed among the studied genotypes (Fig. 5). The association of seed yield with lateral root length was also significant (R2 = 0.331) (Fig. 6), but the association was much weaker as compared to that for tap root length. The strongest relationship of seed yield under drought was observed with root/shoot weight (R2 = 0.90) (Fig. 7). These associations clearly indicate that under water stress conditions, tap root length plays a major role in determining the seed yield in soybean. The results clearly indicated that genotypes which had longer tap roots were able to mine water and produce better seed yield as compared to genotypes, which had shallow tap roots. The root to shoot weight ratio is an indication of relatively more dry matter partitioning to roots and the genotypes, which had deeper tap roots also showed higher root/shoot weight. Consequently, the root/shoot weight was more strongly correlated with seed yield in soybean under water stress conditions. Interestingly, none of the root traits were found to be correlated with seed yield under irrigated conditions (Tables 3 and 4). This was mainly because under irrigated conditions, there is sufficient moisture in all the soil strata and consequently, all the genotypes whether having shallow or deeper roots could mine water required for the growth and hence, roots did not play any significant role in determining the yield under irrigated conditions. Hence, the taproot length and root/shoot weight ratio appears to be an important contributor in determining seed yield under drought and these traits can be used to identify drought tolerant soybean genotypes.
Fig. 5.
Correlation of tap root length with seed yield a irrigated conditions, b water stress under rainout shelter (n = 14)
Fig. 6.
Correlation of lateral root length with seed yield a irrigated conditions, b water stress under rainout shelter (n = 14)
Fig. 7.
Correlation of root/shoot weight ratio with seed yield a irrigated conditions, b water stress under rainout shelter (n = 14)
Table 3.
Correlation coefficients (r) among different physiological traits under irrigated conditions
| Yield | Tap root length | Lateral root length | Root/shoot weight | Canopy temperature | SPAD value | Specific leaf weight | Photosynthesis ratio | Fv/Fm | Wax content | |
|---|---|---|---|---|---|---|---|---|---|---|
| Tap root length | 0.29 | |||||||||
| Lateral root length | 0.29 | 0.82** | ||||||||
| Root/shoot weight | 0.36 | 0.89** | 0.67** | |||||||
| Canopy temperature | − 0.73** | − 0.47 | − 0.51* | − 0.52* | ||||||
| SPAD value | 0.67** | 0.44 | 0.24 | 0.48 | − 0.58* | |||||
| Specific leaf weight | 0.68** | 0.30 | 0.41 | 0.30 | − 0.45 | 0.54* | ||||
| Photosynthesis | 0.78** | 0.35 | 0.22 | 0.40 | − 0.64** | 0.92** | 0.46 | |||
| Fv/Fm ratio | 0.82** | 0.42 | 0.25 | 0.53* | − 0.66** | 0.91** | 0.59* | 0.92** | ||
| Wax content | 0.47 | 0.70** | 0.56* | 0.66** | − 0.69** | 0.42 | 0.42 | 0.34 | 0.43 |
*,**Significant at P = 0.05 and P = 0.01, respectively
Table 4.
Correlation coefficients (r) among different physiological traits under water stress condition given in rainout shelters
| Yield | Tap root length | Lateral root length | Root/shoot weight | Canopy temperature | SPAD value | Specific leaf weight | Photosynthesis ratio | Fv/Fm | Wax content | |
|---|---|---|---|---|---|---|---|---|---|---|
| Tap root length | 0.85** | |||||||||
| Lateral root length | 0.58* | 0.82** | ||||||||
| Root/shoot weight | 0.95** | 0.89** | 0.67** | |||||||
| Canopy temperature | − 0.88** | − 0.85** | − 0.61* | − 0.90** | ||||||
| SPAD value | 0.88** | 0.66** | 0.45* | 0.84** | − 0.85** | |||||
| Specific leaf weight | 0.90** | 0.82** | 0.66** | 0.93** | − 0.86** | 0.88** | ||||
| Photosynthesis | 0.93** | 0.80** | 0.59* | 0.91** | − 0.88** | 0.90** | 0.92** | |||
| Fv/Fm ratio | 0.90** | 0.75** | 0.42 | 0.87** | − 0.86** | 0.90** | 0.90** | 0.85** | ||
| Wax content | 0.81** | 0.77** | 0.55* | 0.81** | − 0.83** | 0.82** | 0.81** | 0.83** | 0.81** |
*,** Significant at P = 0.05 and P = 0.01, respectively
Canopy temperature
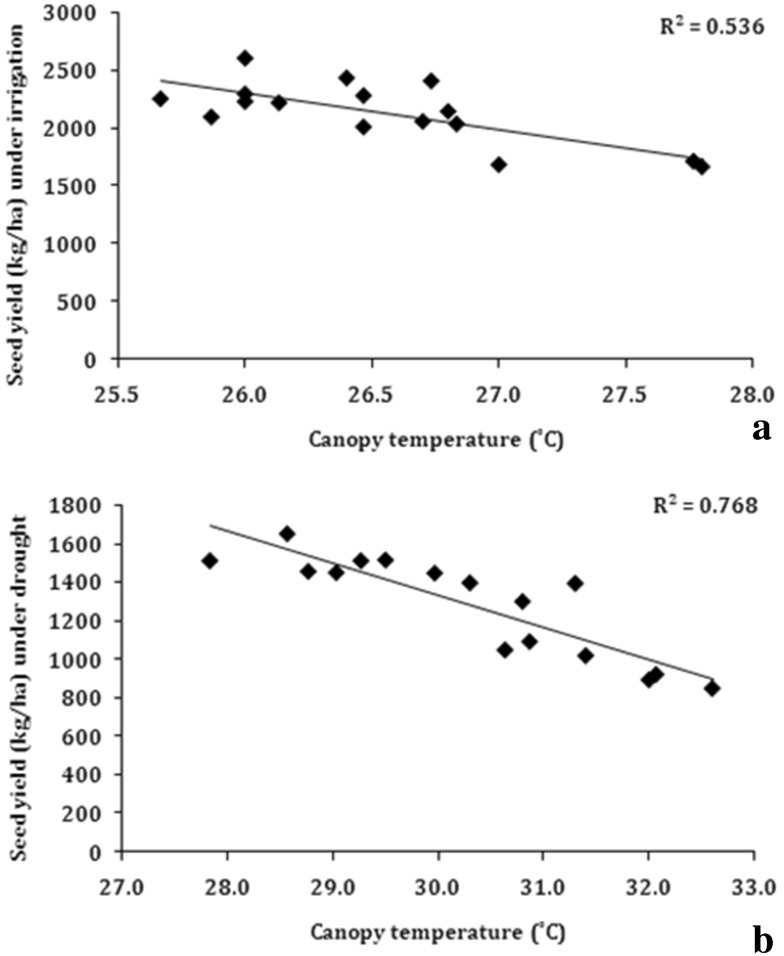
Another trait, which is also associated with deep root system and ability of plants to mine more water for transpiration is canopy temperature. The primary response of plants under water stress is to close the stomata, which restricts the transpiration rate that leads to rise in canopy temperature. It has been reported that, under water limited condition, those genotypes which has lower canopy temperature will use more of the accessible water in the soil to keep their canopy cooler (Bhatia et al. 2014a). Canopy temperature of the 16 soybean genotypes was measured in irrigated and water stress (at water potential − 2.0 MPa) conditions at R5 stage. When the seed yield under water-stress conditions was regressed over canopy temperature of these genotypes, significant negative linear association was observed (R2 = − 0.77) (Fig. 8). This indicated that genotypes with low canopy temperature tended to give more yield under water-stress conditions. Though not as strong as with water stress conditions, the seed yield under irrigated conditions also showed negative linear relationship with canopy temperature (R2 = − 0.54) (Fig. 8). Even though enough soil moisture was available under irrigated conditions, the transpiration water loss surpassed the absorption of water by the roots and resulted in short mid-day water stress condition in soybean. Therefore, the maintenance of canopy temperature even under irrigated conditions by some genotypes could reflect their ability to maintain the balance between water loss through transpiration and availability of water to leaves either through water absorption by the roots or by stomatal mechanisms.
Fig. 8.
Correlation of canopy temperature with seed yield a irrigated conditions, b water stress under rainout shelter (n = 14)
Chlorophyll content (SPAD value)
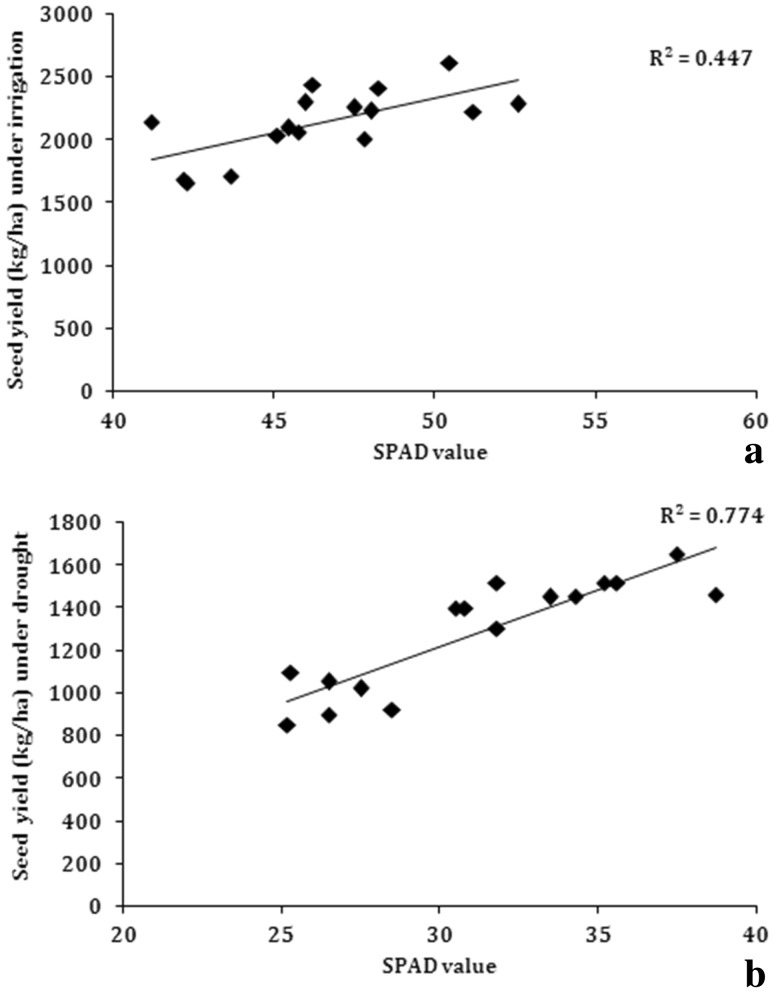
SPAD value is directly proportional to amount of chlorophyll present in the leaves. Under irrigated and water stress conditions when the yield was regressed over SPAD value of these genotypes, a significant positive linear relationship was observed. Association of SPAD value with seed yield under water-stress conditions (R2 = 0.77) and under irrigated conditions (R2 = 0.45) was significant and positive (Fig. 9). This indicated that genotypes with high chlorophyll content tended to give more yield under water stress condition.
Fig. 9.
Correlation of SPAD value with seed yield a irrigated conditions, b water stress under rainout shelter (n = 14)
Specific leaf weight
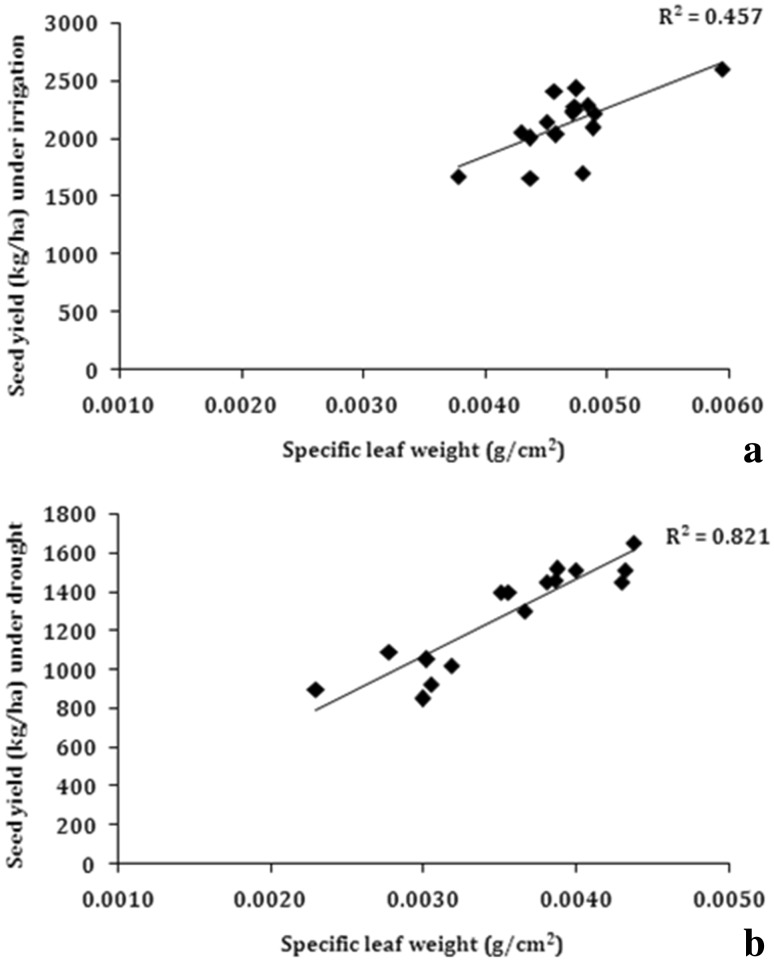
When plants are subjected to water deficit, loss in leaf water content occurs leading to decline in leaf area expansion (Alves and Setter 2004). The dry matter accumulation, yield and photosynthetic efficiency is directly associated with the specific leaf weight. The specific leaf weight has been reported to be associated with drought tolerance possibly indicating thicker leaves help in leaf water conservation (Nautiyal et al. 2008). A significant positive association was observed between specific leaf weight and seed yield, both under water stress (R2 = 0.82) and irrigated (R2 = 0.46) conditions (Fig. 10). Thus, higher yielding genotypes under drought also had higher specific leaf weight.
Fig. 10.
Correlation of SLW with seed yield a irrigated conditions, b water stress under rainout shelter (n = 14)
Leaf photosynthesis
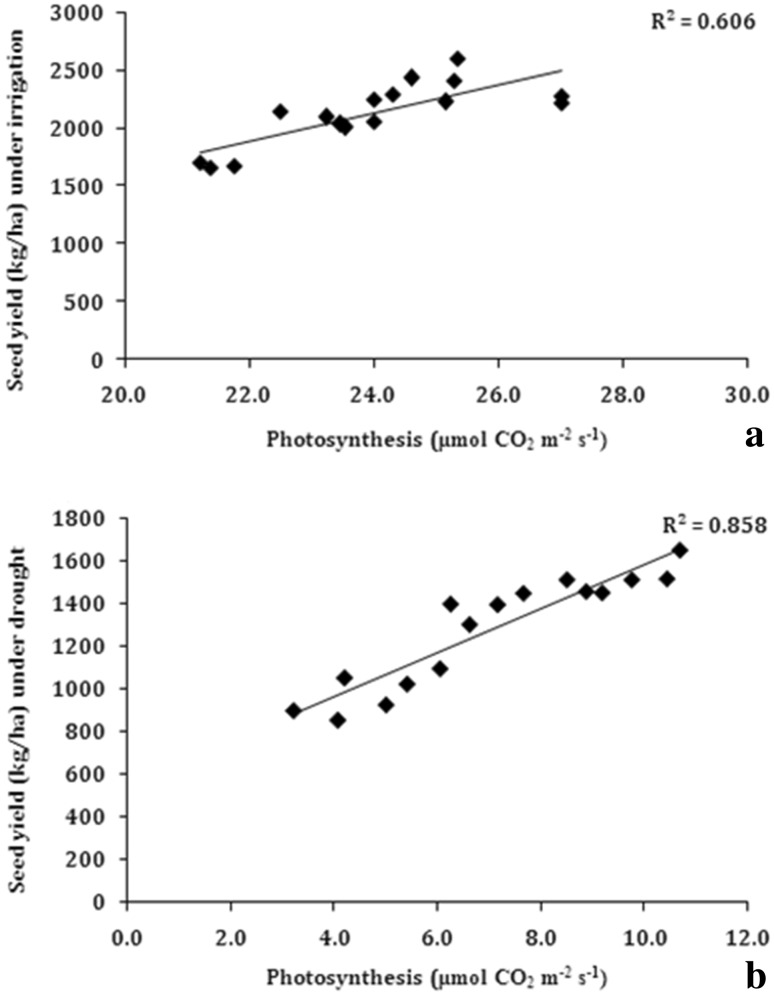
Both non-stomatal and stomatal factors are reported to play different roles in regulation of photosynthesis under drought (Flexas et al. 2004; Singh and Reddy 2011). However, stomatal closure plays a dominant role in gaseous exchange during water stress conditions (Cornic 2000; De Souza et al. 2005). There exists large genotypic differences in rate of photosynthesis in response to soil moisture stress (Ray and Sinclair 1997; Vadez and Sinclair 2001; Hufstetler et al. 2007; Nautiyal et al. 2012). Soil water deficit affects plant chlorophyll, photosynthesis, growth and productivity and therefore has received major focus in studies identifying genotypes tolerant to drought. Attempts were made to know the effect of soil moisture on leaf net photosynthesis in soybean genotypes. The rate of leaf photosynthesis was recorded in soybean genotypes at leaf water potential of ~ − 2.0 MPa after the imposition of water stress in rainout shelter along with the plants grown under irrigated condition at leaf water potential ~ − 0.5 MPa. A significant positive association was observed between leaf photosynthesis and seed yield, both under water stress (R2 = 0.86) and irrigated (R2 = 0.61) conditions (Fig. 11). Thus, genotypes with higher yield both under drought and irrigated conditions had higher rates of photosynthesis.
Fig. 11.
Correlation of leaf photosynthesis with seed yield a irrigated conditions, b water stress under rainout shelter (n = 14)
Fv/Fm ratio
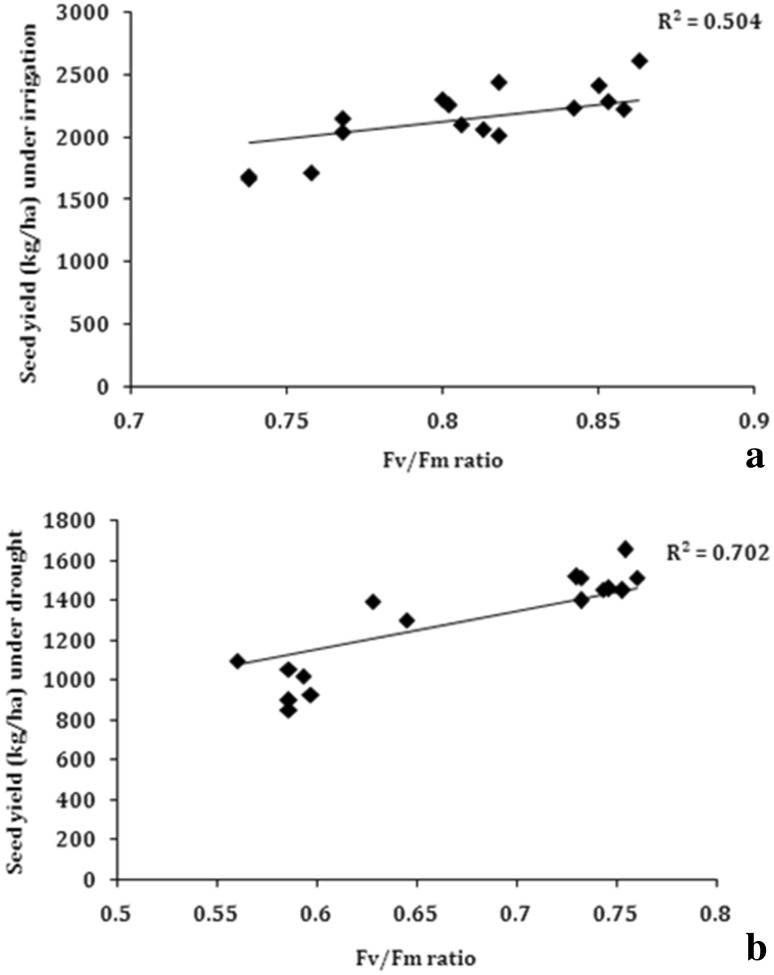
The Fv/Fm ratio is related to the maximum efficiency of PS II. The results showed that Fv/Fm was less reduced in genotypes in which yield was high as compared to low yielding genotypes under water-stress conditions. A significant positive association was observed between Fv/Fm ratio and seed yield, both under irrigated (R2 = 0.50) and water stress (R2 = 0.70) conditions (Fig. 12).
Fig. 12.
Correlation of Fv/Fm ratio with seed yield a irrigated conditions, b water stress under rainout shelter (n = 14)
Epicuticular wax content
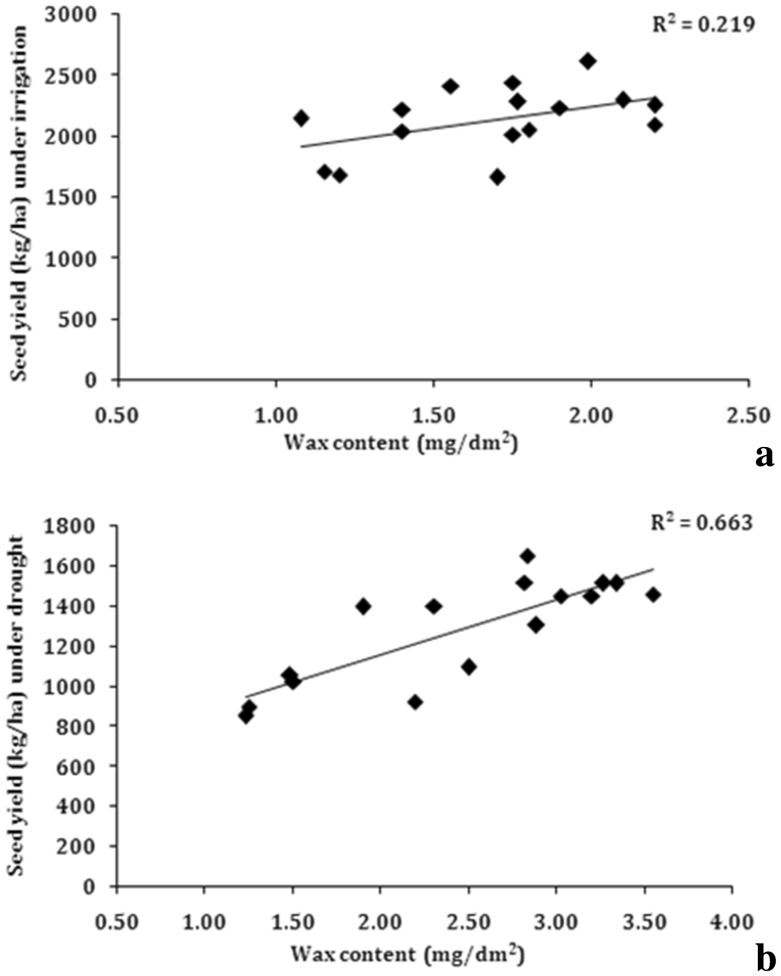
The leaf cuticle controls plant water loss and epicuticular waxes are known to regulate the quantity of water lost via transpiration. In the study, differences in the amount of leaf cuticular waxes in 16 soybean genotypes were observed. Wax content was estimated in leaves of plants under irrigated and water stress conditions. A positive association was observed across genotypes between seed yield and epicuticular wax content under water stress conditions in rainout shelters (R2 = 0.66) (Fig. 13). No relationship was observed under irrigated conditions between wax content and seed yield.
Fig. 13.
Correlation of wax content with seed yield a irrigated conditions, b water stress under rainout shelter (n = 14)
Correlation among the measured parameters
Besides association with seed yield, it was also determined whether under irrigated and water stress conditions, a certain physiological trait is correlated with other drought-tolerant traits. To understand the role of these physiological traits in imparting drought tolerance, their interrelationship was studied (Tables 3 and 4). Many of these parameters were found to have strong correlation with each other, particularly under water-deficit conditions. Under soil moisture deficit, the canopy temperature was found to be significantly correlated (Table 4) with other root characteristics, particularly with root/shoot weight (r = − 0.90**), taproot (r = − 0.85**) and lateral root length (r = − 0.61*), indicating that genotypes having longer roots were able to mine more water, leading to maintenance of canopy temperature. Similarly, longer roots were also positively associated with root/shoot weight (r = 0.89**), indicating that genotypes with longer roots had higher degree of root/shoot weight. Hence, root characteristics appeared to be an important factor determining the capacity to withstand drought in soybean genotypes. In plants, which were grown under water stress conditions, the rate of photosynthesis was negatively associated with canopy temperature (r = − 0.88**) and positively with root/shoot weight (r = 0.91**), taproot length (r = 0.80**), length of lateral roots (r = 0.59*), SPAD value (r = 0.90**) and SLW (r = 0.92**), indicating that cooler canopy temperatures and relatively more opened stomata helped in maintaining high photosynthetic rate (Table 4). Thus, higher rates of photosynthesis could be maintained under soil moisture deficit conditions by genotypes having low canopy temperature, thicker leaves and high chlorophyll content. The ratio of Fv/Fm was also correlated with canopy temperature (r = − 0.86**), SPAD value (r = 0.90**), SLW (r = 0.90**) and photosynthesis (r = 0.85**), indicating that genotypes which had high Photosystem II stability under drought conditions had low canopy temperature, high photosynthesis, SLW and chlorophyll content. Epicuticular wax content was also significantly associated with other physiological traits, such as taproot length (r = 0.77**), canopy temperature (r = − 0.83**), SPAD value (r = 0.82**), SLW (r = 0.81**) and photosynthesis (r = 0.83**) (Table 4). The genotypes which were identified as drought tolerant can be utilized for the development of superior genotypes that would be utilized in breeding programs. It is clear from the study that by monitoring various physiological traits, drought tolerant genotypes can be identified. Therefore, physiological traits presented in the study after their establishment can be used as simple selection criteria under drought conditions for identifying the soybean genotypes for better yield.
Conclusions
Drought is one of the main abiotic stresses that limit the production of soybean. Hence, a systematic breeding program to develop drought tolerant soybean genotypes is needed. In order to do so, there is a need to accurately describe the environment and to understand the physiological, biochemical and molecular changes related with drought in soybean. The use of physiological traits as indirect selection criteria for yield depends on their relative genetic correlation with yield and genotype-environment interaction. In the present study, the root characteristics particularly tap root length showed a strong positive association with seed yield under water stress conditions. The genotypes with longer tap root were able to mine water at lower soil strata where water was available and helped the genotype such as EC 538828 to better adapt to water stress condition. The tap root length in turn was positively associated with other physiological characters studied such as photosynthesis, Fv/Fm ratio and SLW and showed negative association with canopy temperature. Hence, these parameters can be used to identify genotypes showing drought tolerance. Breeding approaches are only successful when these traits are properly defined relative to the target environment, growth stage and their contribution to crop productivity. In breeding programs, when genetic diversity for a particular trait has been ascertained, relevance of that trait as a selection criterion needs to be determined. Identification of relevant physiological traits is bit difficult; however, if it is successful, the profits are likely to be rewarding. Thus, identification of physiological traits for drought tolerance would go far way in developing soybean genotypes better adapted to current as well as future climatic scenarios.
Electronic supplementary material
Below is the link to the electronic supplementary material.
Acknowledgements
The authors acknowledge funding for this work from Indian Council of Agricultural Research.
Footnotes
Publisher's Note
Springer Nature remains neutral with regard to jurisdictional claims in published maps and institutional affiliations.
References
- Allen DJ, Ort DR. Impact of chilling temperatures on photosynthesis in warm climate plants. Trends Plant Sci. 2001;6:36–42. doi: 10.1016/S1360-1385(00)01808-2. [DOI] [PubMed] [Google Scholar]
- Alves AAC, Setter TL. Response of cassava leaf area expansion to water deficit: cell proliferation, cell expansion and delayed development. Ann Bot. 2004;94:605–613. doi: 10.1093/aob/mch179. [DOI] [PMC free article] [PubMed] [Google Scholar]
- Araus JL. Breeding cereals for Mediterranean conditions: ecophysiological clues for biotechnology applications. Ann Appl Biol. 2003;142:129–141. doi: 10.1111/j.1744-7348.2003.tb00238.x. [DOI] [Google Scholar]
- Araus JL, Slafer MP, Reynolds MP, Royo C. Plant breeding and drought in C3 cereals: What should we breed for? Ann Bot. 2002;89:925–940. doi: 10.1093/aob/mcf049. [DOI] [PMC free article] [PubMed] [Google Scholar]
- Ashraf M, Harris PJC. Photosynthesis under stressful environments: an overview. Photosynthetica. 2013;51:163–190. doi: 10.1007/s11099-013-0021-6. [DOI] [Google Scholar]
- Bhatia VS, Jumrani K. A maximin–minimax approach for classifying soybean genotypes for drought tolerance based on yield potential and loss. Plant Breed. 2016;136:691–700. doi: 10.1111/pbr.12414. [DOI] [Google Scholar]
- Bhatia VS, Jumrani K, Pandey GP. Developing drought tolerance in soybean using physiological approaches. Soybean Res. 2014;12:1–19. [Google Scholar]
- Bhatia VS, Jumrani K, Pandey GP. Evaluation of the usefulness of senescing agent potassium iodide as a screening tool for tolerance to terminal drought in soybean. Plant Knowl J. 2014;3:23–30. [Google Scholar]
- Blum A. Drought resistance, water use efficiency and yield potential are they compatible, dissonant, or mutually exclusive? Aus J Agric Res. 2005;56:1159–1168. doi: 10.1071/AR05069. [DOI] [Google Scholar]
- Cattivelli L, Rizza F, Badeck FW, Mazzucotelli E, Mastrangelo AM, Francia E, Mare C, Tondelli A, Stanca AM. Drought tolerance improvement in crop plants: an integrated view from breeding to genomics. Field Crop Res. 2008;115:1–14. doi: 10.1016/j.fcr.2007.07.004. [DOI] [Google Scholar]
- Chopra RK, Sinha SK. Prospects of success of biotechnological approaches for improving tolerance to drought stress in crop plants. Curr Sci. 1998;74:25–34. [Google Scholar]
- Cornic G. Drought stress inhibits photosynthesis by decreasing stomatal aperture: not by affecting ATP synthesis. Trend Plant Sci. 2000;5:187–188. doi: 10.1016/S1360-1385(00)01625-3. [DOI] [Google Scholar]
- De Souza CR, Maroco JP, dos Santos TP, Rodrigues ML, Lopes C, Pereira JS, Chaves MM. Control of stomatal aperture and carbon uptake by deficit irrigation in two grapevine cultivars. Agric Ecosyst Environ. 2005;106:261–274. doi: 10.1016/j.agee.2004.10.014. [DOI] [Google Scholar]
- Dias FG, Borges ACN, Viana AAB, Mesquita RO, Romano E, Grossi de Sa MF, Nepomuceno AL, Loureiro ME, Ferreira MA. Expression analysis in response to drought stress in soybean: shedding light on the regulation of metabolic pathway genes. Genet Mol Biol. 2012;35:222–232. doi: 10.1590/S1415-47572012000200004. [DOI] [PMC free article] [PubMed] [Google Scholar]
- Ebercon A, Blum A, Jordan WR. A rapid colorimetric method for epicuticular wax content of sorghum leaves. Crop Sci. 1976;17:179–180. doi: 10.2135/cropsci1977.0011183X001700010047x. [DOI] [Google Scholar]
- Flexas J, Bota J, Loreto F, Cornic G, Sharkey TD. Diffusive and metabolic limitations to photosynthesis under drought and salinity in C3 plants. Plant Biol. 2004;6:269–279. doi: 10.1055/s-2004-820867. [DOI] [PubMed] [Google Scholar]
- Fukai S, Cooper M. Development of drought resistant cultivars using physio morphological traits in rice. Field Crop Res. 1995;40:67–86. doi: 10.1016/0378-4290(94)00096-U. [DOI] [Google Scholar]
- Guendouz A, Guessoum S, Maamari K, Benidir M, Hafsi M. Canopy temperature efficiency as indicators for drought tolerance in Durum Wheat (Triticum Durum Desf.) in semiarid conditions. J Agric Sustain. 2012;1:23–38. [Google Scholar]
- Guenni O, Baruch Z, Marín D. Responses to drought of five Brachiaria species. II. Water relations and leaf gas exchange. Plant Soil. 2004;258:249–260. doi: 10.1023/B:PLSO.0000016555.53797.58. [DOI] [Google Scholar]
- Hirasawa T, Tanaka K, Miyamoto D, Takai M, Ishihara K. Effects of pre flowering soil moisture deficit on dry matter production and eco physiological characteristics in soybean plants under drought conditions during grain filling. Jpn J Crop Sci. 1994;63:721–730. doi: 10.1626/jcs.63.721. [DOI] [Google Scholar]
- Hufstetler EV, Boerma HR, Carter TE, Earl HJ. Genotypic variation for three physiological traits affecting drought tolerance in soybean. Crop Sci. 2007;47:25–35. doi: 10.2135/cropsci2006.04.0243. [DOI] [Google Scholar]
- IPCC . Summary for policymakers. In: Stocker TF, Qin D, Plattner GK, Tignor M, Allen SK, Boschung J, Nauels A, Xia Y, Bex V, Midgley PM, editors. Climate change: the physical science basis. Cambridge and New York: Contribution of Working Group I to the Fifth Assessment Report of the Intergovernmental Panel on Climate Change Cambridge University Press; 2013. [Google Scholar]
- Jenks MA, Rashotte AM, Tuttle HA, Feldmann KA. Mutants in Arabidopsis thaliana altered in epicuticular wax and leaf morphology. Plant Physiol. 1996;110:377–385. doi: 10.1104/pp.110.2.377. [DOI] [PMC free article] [PubMed] [Google Scholar]
- Jumrani K, Bhatia VS. Combined effect of high day and night time temperatures and water deficit stress on phenology, growth, photosynthesis, yield and seed quality in soybean. Int J Trop Agric. 2015;33:3637–3643. [Google Scholar]
- Jumrani K, Bhatia VS. Impact of combined stress of high temperature and water deficit on growth and seed yield of soybean. Physiol Mol Biol Plants. 2018;24:37–50. doi: 10.1007/s12298-017-0480-5. [DOI] [PMC free article] [PubMed] [Google Scholar]
- Jumrani K, Bhatia VS, Pandey GP. Impact of elevated temperatures on specific leaf weight, stomatal density, photosynthesis and chlorophyll fluorescence in soybean. Photosynth Res. 2017;131:333–350. doi: 10.1007/s11120-016-0326-y. [DOI] [PubMed] [Google Scholar]
- Jumrani K, Bhatia VS, Pandey GP. Screening soybean genotypes for high temperature tolerance by in vitro pollen germination, pollen tube length, reproductive efficiency and seed yield. Ind J Plant Physiol. 2018;23:77–90. doi: 10.1007/s40502-018-0360-1. [DOI] [Google Scholar]
- Kashiwagi J, Krishnamurthy L, Upadhyaya HD, Krishna H, Chandra S, Vadez V, Serraj R. Genetic variability of drought-avoidance root traits in the mini-core germplasm collection of chickpea (Cicer arietinum L.) Euphytica. 2005;146:213–222. doi: 10.1007/s10681-005-9007-1. [DOI] [Google Scholar]
- Kim SK, Park SH, Kim DR, Kenks MA. Influence of water deficit on leaf culticular wax of soybean [Glycine max (L.) Merr.] Int Plant Sci. 2007;168:307–316. doi: 10.1086/510496. [DOI] [Google Scholar]
- Kraus TE, Mckersie BD, Fletcher RA. Paclobutrazole induced tolerance of wheat leaves to paraquat may involve antioxidant enzyme activity. J Plant Physiol. 1995;145:570–576. doi: 10.1016/S0176-1617(11)81790-6. [DOI] [Google Scholar]
- Kypoarissis A, Petropoulun Y, Manetas Y. Summer survival of leaves in a softleaved shrub (Phlomisfruticosa L., Labiatae) under Mediterranean field conditions: avoidance of photo-inhibitory damage through decreased chlorophyll contents. J Exp Bot. 1995;46:1825–1831. doi: 10.1093/jxb/46.12.1825. [DOI] [Google Scholar]
- Le D, Nishiyama T, Watanabe R, TanakaY Seki M, Ham M, Le H, et al. Differential gene expression in soybean leaf tissues at late developmental stages under drought stress revealed by genome-wide transcriptome analysis. PLoS ONE. 2012;7:e49522. doi: 10.1371/journal.pone.0049522. [DOI] [PMC free article] [PubMed] [Google Scholar]
- Liu F, Anderson MN, Jacobson SE, Jensen CR. Stomatal control and water use efficiency of soybean (Glycine max L. Merr.) during progressive soil drying. Environ Exp Bot. 2005;54:33–40. doi: 10.1016/j.envexpbot.2004.05.002. [DOI] [Google Scholar]
- Lopez CG, Banowetz GM, Peterson CJ, Kronstad WE. Dehydrin expression and drought tolerance in seven wheat cultivars. Crop Sci. 2003;43:577–582. doi: 10.2135/cropsci2003.0577. [DOI] [Google Scholar]
- Mamrutha HM, Mogili T, Lakshmi KJ, Rama N, Kosma D, Udayakumar M, Jenks MA, Nataraja KN. Leaf cuticular wax amount and crystal morphology regulate post-harvest water loss in mulberry (Morus species) Plant Physiol Biochem. 2010;48:690–696. doi: 10.1016/j.plaphy.2010.04.007. [DOI] [PubMed] [Google Scholar]
- Markwell J, Osterman J, Mitchell J. Calibration of the Minolta SPAD-502 leaf chlorophyll meter. Photosynth Res. 1995;46:467–472. doi: 10.1007/BF00032301. [DOI] [PubMed] [Google Scholar]
- Menconi M, Sgherri CLM, Pinzino C, Navari-Izzo F. Activated oxygen production and detoxification in wheat plants subjected to a water deficit program. J Exp Bot. 1995;46:1123–1130. doi: 10.1093/jxb/46.9.1123. [DOI] [Google Scholar]
- Nagarathna TK, Shadakshari YG, Ramakrishna Parama VR, Jagadish KS, Puttarangaswamy KT. Examination of root characters, isotope discrimination, physiological and morphological traits and their relationship used to identify the drought tolerant sunflower (Helianthus annuus L.) genotypes. Helia. 2012;56:1–8. doi: 10.2298/HEL1256001N. [DOI] [Google Scholar]
- Nautiyal PC, Rajgopal K, Zala PV, Pujari DS, Basu M, Dhadhal BA, Nandre BM. Evaluation of wild Arachis species for abiotic stress tolerance: I. Thermal stress and leaf water relations. Euphytica. 2008;159:43–57. doi: 10.1007/s10681-007-9455-x. [DOI] [Google Scholar]
- Nautiyal PC, Ravindra V, Rathnakumar AL, Ajay BC, Zala PV. Genetic variations in photosynthetic rate: pod yield and yield components in Spanish groundnut cultivars during three cropping seasons. Field Crops Res. 2012;125:83–91. doi: 10.1016/j.fcr.2011.08.010. [DOI] [Google Scholar]
- Nguyen H, Babu RC, Blum A. Breeding for drought resistance in rice: physiology and molecular genetics considerations. Crop Sci. 1997;37:1426–1434. doi: 10.2135/cropsci1997.0011183X003700050002x. [DOI] [Google Scholar]
- Ohashi Y, Nakayama N, Saneoka H, Fujita K. Effects of drought stress on photosynthetic gas exchange, chlorophyll fluorescence and stem diameter of soybean plants. Biol Plant. 2006;50:138–141. doi: 10.1007/s10535-005-0089-3. [DOI] [Google Scholar]
- Olivares Villegas JJ, Reynolds MP, McDonald GK. Drought adaptive attributes in the Seri/Babaxhexaploid wheat population. Funct Plant Biol. 2007;34:189–203. doi: 10.1071/FP06148. [DOI] [PubMed] [Google Scholar]
- Oukarroum A, Madidi SE, Schansker G, Strasser RJ. Probing the responses of barley cultivars (Hordeum vulgare L.) by chlorophyll a fluorescence OLKJIP under drought stress and re-watering. Environ Exp Bot. 2007;60:438–446. doi: 10.1016/j.envexpbot.2007.01.002. [DOI] [Google Scholar]
- Oya T, Nepomuceno AL, Farias JRB, Tobita S, Ito O. Drought tolerance characteristics of Brazilian soybean cultivars—evaluation and characterization of drought tolerance of various Brazilian soybean cultivars in the field. Plant Prod Sci. 2004;7:129–137. doi: 10.1626/pps.7.129. [DOI] [Google Scholar]
- Paknejad F, Majidi Heravan E, Nourmohammadi GH, Siyadat A, Vazan S. Effects of drought stress on filling the grain of wheat cultivar. Iran J Agric Sci. 2007;1:138–148. [Google Scholar]
- Pennisi E. The blue revolution, drop-by-drop, gene by gene. Science. 2008;320:171–173. doi: 10.1126/science.320.5873.171. [DOI] [PubMed] [Google Scholar]
- Piao S, Ciais P, Friedlingstein P, et al. Net carbon dioxide losses of northern ecosystems in response to autumn warming. Nature. 2008;451:49–52. doi: 10.1038/nature06444. [DOI] [PubMed] [Google Scholar]
- Premachandra GS, Hahn DT, Axtell JD, Joly RJ. Epicuticular wax load and water use efficiency in bloomless and sparse-bloom mutants of Sorghum bicolor L. Environ Exp Bot. 1994;34:293–301. doi: 10.1016/0098-8472(94)90050-7. [DOI] [Google Scholar]
- Rashid A, Stark JC, Tanveer A, Mustafa T. Use of canopy temperature measurements as a screening tool for drought tolerance in spring wheat. J Agron Crop Sci. 1999;182:231–237. doi: 10.1046/j.1439-037x.1999.00335.x. [DOI] [Google Scholar]
- Ray JD, Sinclair TR. Stomatal closure of maize hybrids in response to soil drying. Crop Sci. 1997;37:803–807. doi: 10.2135/cropsci1997.0011183X003700030018x. [DOI] [Google Scholar]
- Reynolds MP, Trethowan RM (2007) Physiological interventions in breeding for adaptation to abiotic stress. In: Spiertz JHJ, Struik PC, van Laar HH (eds) Scale and complexity in plant systems research, gene–plant–crop relations. Wageningen UR Frontis Series, vol 21, pp 129–146
- Ristic Z, Bukovnik U, Prasad PVV. Correlation between heat stability of thylakoid membranes and loss of chlorophyll in winter wheat under heat stress. Crop Sci. 2007;47:2067–2073. doi: 10.2135/cropsci2006.10.0674. [DOI] [Google Scholar]
- Samarah NH, Alqudah AM, Amayreh JA, McAndrews GM. The effect of late terminal drought stress on yield components of four barley cultivars. J Agron Crop Sci. 2009;195:427–441. doi: 10.1111/j.1439-037X.2009.00387.x. [DOI] [Google Scholar]
- Serraj R, McNally KL, Slamet-Loedin I, Kohli A, Haefele SM, Atlin G, Kumar A. Drought resistance improvement in rice: an integrated genetic and resource management strategy. Plant Prod Sci. 2011;14:1–14. doi: 10.1626/pps.14.1. [DOI] [Google Scholar]
- Singh SK, Reddy KR. Regulation of photosynthesis, fluorescence, stomatal conductance and water-use efficiency of cowpea (Vigna unguiculata L.Walp) under drought. J Photochem Photobio. 2011;105:40–50. doi: 10.1016/j.jphotobiol.2011.07.001. [DOI] [PubMed] [Google Scholar]
- Specht JE, Hum DJ, Kumudini SV. Soybean yield potential—a genetic and physiological perspective. Crop Sci. 1999;39:1560–1570. doi: 10.2135/cropsci1999.3961560x. [DOI] [Google Scholar]
- Subbarao GV, Johansen C, Slinkard AE, Nageswara Rao RC, Saxena NP, Chauhan YS. Strategies for improving drought tolerance in grain legumes. Crit Rev Plant Sci. 1995;14:469–523. doi: 10.1080/07352689509701933. [DOI] [Google Scholar]
- Tuberosa R, Salvi S. Genomics based approaches to improve drought tolerance of crops. Trends Plant Sci. 2006;11:405–412. doi: 10.1016/j.tplants.2006.06.003. [DOI] [PubMed] [Google Scholar]
- Vadez V, Sinclair TR. Leaf ureide degradation and N2 fixation tolerance to water deficit in soybean. J Exp Bot. 2001;52:153–159. [PubMed] [Google Scholar]
- Wu Y, Cosgrove DJ. Adaptation of roots to low water potentials by changes in cell wall extensibility and cell wall proteins. J Exp Bot. 2000;51:1543–1553. doi: 10.1093/jexbot/51.350.1543. [DOI] [PubMed] [Google Scholar]
- Yordanov I, Velikova V, Tsonev T. Plant responses to drought, acclimation, and stress tolerance. Photosynthetica. 2000;38:171–186. doi: 10.1023/A:1007201411474. [DOI] [Google Scholar]
- Zobayed S, Afreen F, Kozai T. Temperature stress can alter the photosynthetic efficiency and secondary metabolite concentrations in St. John’s Wort. Plant Physiol Biochem. 2005;43:977–984. doi: 10.1016/j.plaphy.2005.07.013. [DOI] [PubMed] [Google Scholar]
Associated Data
This section collects any data citations, data availability statements, or supplementary materials included in this article.


