

Abstract
Across the world, healthcare costs are projected to continue to increase, and the pressure on the healthcare system is only going to grow in intensity as the rate of growth of elderly population increases in the coming decades. As an example, when people age one possible condition that they may experience is sleep-disordered breathing (SDB). SDB, better known as the obstructive sleep apnea (OSA) syndrome, and associated cardiovascular complications are among the most common clinical disorders. The gold-standard approach to accurately diagnose OSA, is polysomnography (PSG), a test that should be performed in a specialist sleep clinic and requires a complete overnight stay at the clinic. The PSG system can provide accurate and real-time data; however, it introduces several challenges such as complexity, invasiveness, excessive cost, and absence of privacy. Technological advancements in hardware and software enable noninvasive and unobtrusive sensing of vital signs. An alternative approach which may help diagnose OSA and other cardiovascular diseases is the ballistocardiography. The ballistocardiogram (BCG) signal captures the ballistic forces of the heart caused by the sudden ejection of blood into the great vessels with each heartbeat, breathing, and body movement. In recent years, BCG sensors such as polyvinylidene fluoride film-based sensors, electromechanical films, strain Gauges, hydraulic sensors, microbend fiber-optic sensors as well as fiber Bragg grating sensors have been integrated within ambient locations such as mattresses, pillows, chairs, beds, or even weighing scales, to capture BCG signals, and thereby measure vital signs. Analysis of the BCG signal is a challenging process, despite being a more convenient and comfortable method of vital signs monitoring. In practice, BCG sensors are placed under bed mattresses for sleep tracking, and hence several factors, e.g., mattress thickness, body movements, motion artifacts, bed-partners, etc. can deteriorate the signal. In this paper, we introduce the sensors that are being used for obtaining BCG signals. We also present an in-depth review of the signal processing methods as applied to the various sensors, to analyze the BCG signal and extract physiological parameters such heart rate and breathing rate, as well as determining sleep stages. Besides, we recommend which methods are more suitable for processing BCG signals due to their nonlinear and nonstationary characteristics.
Keywords: Ballistocardiogram, Vital signs, Nonintrusive monitoring, Signal processing
Introduction
Ballistocardiography (BCG) is a noninvasive technique for creating a graphical representation of the heartbeat-induced repeated motions of the human body. These repeated motions happen due to the rapid acceleration of blood when it is ejected and moved in the great vessels of the body during periods of relaxation and contraction, known as diastole and systole, respectively. In other words, BCG can provide information about the overall performance of the circulatory system; this is because BCG measures the mass movements, i.e., the mass of the circulating blood and the heart during the cardiac cycle [1]. During atrial systole, when the blood is ejected into the great vessels, the center of mass of the body moves towards the head of the body. In the other direction, as the blood moves towards the peripheral vessels and concentrates further away from the heart in the peripheral vessels, the center-of-mass moves towards the feet (Fig. 1b). This shift comprises several components as a result of cardiac activity, respiration, and body movements. This shifting of the center of mass of the body generates the BCG waveform since the blood distribution changes during the cardiac cycle [5]. More than 100 years ago, BCG did not prove its functionality, and it did not start to be used in routine tasks for a few general reasons as follows. First, there had been insufficient standard measurement methods, i.e., different methods had resulted in slightly different signals. Second, the exact physiologic origin of the BCG waveform had not been well-understood. Furthermore, there had been insufficient clear guidelines for interpretation of the results, and therefore the medical community was unwilling to take risks. Third, there had been a dominant focus on some clinical diagnostic, for example, myocardial infarction, angina pectoris, coronary heart disease; these applications need a high level of specificity and reliability that the BCG had not reached at that time. Fourth, there had not yet been the emergence of ultrasound and echocardiography methods that swiftly overhauled BCG and related methods for noninvasive cardiac and hemodynamic diagnostic [6].
Fig. 1.

a Example of a typical BCG signal with letters used to designate the waves. The arrow indicates the position of the beginning of the electrical ventricular systole (QRS. complex of the electrocardiogram). Image adapted from [1–3], b Aortic arch and force vectors coming from blood ejection by the left ventricle. Image adapted from [4]
At present, BCG has received a lot of interest thanks to the information technology revolution, including hardware technology as well as software and services. We can embed BCG sensors in ambient environments without the need for medical staff presence. Consequently, it has an outstanding impact on current e-health systems. Ultimately, BCG helps reduce checkups’ stress and patient emotion and attention responses. Fig. 1a shows an example of a typical BCG signal, while Fig. 2 shows an example of a typical electrocardiogram signal. The BCG wave-forms may be grouped into three main groups, i.e., the pre-systolic (frequently disregarded), the systolic and the diastolic as given in Table 1. The I and J waves are also quoted as ejection waves [1]. We have discussed to this extent, the definition, formal limitations, and nomenclature of ballistocardiography. The formal constraints were mainly due to the complexity of the used system and misinterpretation of the obtained signals and its deformations. The field of ballistocardiography has been revived as a result of the numerous technological advancements, such as recent advances in microprocessor design. All in all, ballistocardiography can be very useful in several applications such as monitoring of cardiac function and performance in addition to the tracking of sleep- and sleep-disordered breathing [8, 9]. One of the most prominent features of ballistocardiography is the accessibility and ready-availability, which allows us to deploy the system in users’ homes without affecting the users’ privacy and daily activities.
Fig. 2.
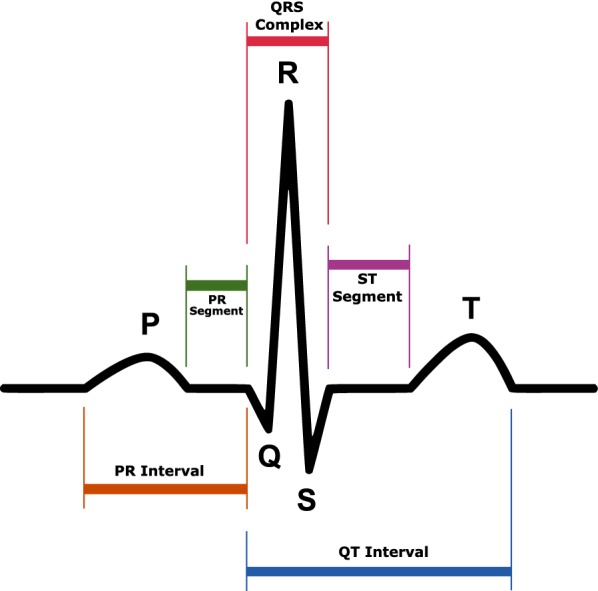
Example of a typical electrocardiogram signal
Table 1.
| Pre-systolic group | |
| F wave: (rarely seen) head-ward wave preceding G, related to pre-systolic events, not an after-vibration. | |
| G wave: small foot-ward wave which at times precedes the H wave. | |
| Systolic waves | |
| H wave: head-ward deflection that begins close to the peak of the R wave, maximum peak synchronously or near the start of ejection. | |
| I wave: foot-ward deflection that follows the H wave, occurs early in systole. | |
| J wave: largest head-ward wave that immediately follows the I wave, occurs late in systole. | |
| K wave: foot-ward wave following J, occurs before the end of systole. | |
| Diastolic waves | |
| L and N waves: two smaller head-ward deflections which usually follow K. | |
| M wave: foot-ward deflection between L and N. | |
| Smaller subsequent waves may be visible and are named in sequence. |
Healthcare systems worldwide are struggling with significant challenges, i.e., rapid growth in the aging population, an increased number of people with chronic and infectious diseases, rising costs, and inefficiencies in health-care systems. Healthcare providers are seeking novel noninvasive solutions that can improve the quality of healthcare for the patient while maintaining the cost of the service provided, and this is where ballistocardiography can play a significant role in improving the quality of life of the population. It is worth mentioning that BCG signal’s morphology varies between and within subjects and it highly depends on the measurement device as well as the subject’s postures, i.e., sleeping or sitting. As a result, BCG signal processing is a very challenging task for researchers.
One example of a ballistocardiogram-based sensor is Murata; the Murata sensor uses an ultra-sensitive accelerometer to capture the bed’s vibrations generated by a subject’s heart rate, respiration, and body movement. A microcontroller is used to process the information, providing heart rate, breathing, heart rate variability, and stroke volume measurements, and bed status indication [10].
Microelectromechanical (MEMS) gyroscope sensor is another attractive device that can measure the angular ballistograph signal that is indicative of rotational movement of a chest of a subject [11]. The added value of the angular motion is that it is not disturbed by gravity, which makes the measurement approximately independent of the position or posture of the monitored subject. “The external angular motion of the chest is orders of magnitude larger than what one would expect from the mere extent of the heart rotation and the ratio between the size of the heart and the diameter of the human chest. The detection of the angular motion is also relatively insensitive to the location of the sensor regarding the heart” [12].
There are several algorithms for analyzing and interpreting cardiorespiratory signals obtained from in-bed based sensors. In sum, these algorithms can be broadly grouped into three categories: time-domain algorithms, frequency-domain algorithms, and wavelet-domain algorithms. A summary of these algorithms is given below to highlight which class of algorithms we will use in our analysis.
First, time-domain algorithms are mainly focused on detecting local maxima or local minima using a moving window, and therefore finding the interval between the dominant J-peaks of ballistocardiogram signal. However, this approach has many limitations because of the nonlinear and nonstationary behavior of the ballistocardiogram signal. The implication is that the ballistocardiogram signal does not display consistent J-peaks, which can frequently occur in the case of overnight, in-home monitoring, particularly with frail elderly. Additionally, its accuracy will be undoubtedly affected by motion artifacts.
Second, frequency-domain algorithms do not provide information about interbeat intervals. Nevertheless, they can provide information about heart rate variability. This process is usually done by taking the fast Fourier transform or the inverse Fourier transform of the logarithm of the estimated spectrum, i.e., cepstrum of the signal using a sliding window. After that, the dominant frequency is obtained in a particular frequency range. The limitation of these algorithms is that the peak in the spectrum may get expanded and multiple peaks may appear, which might cause a problem in the measurement of vital signs.
Lastly, wavelet-domain algorithms aim to decompose the signal into different components; hence we can select the part which shows an agreement with the vital signs. In other words, the chosen section contains only information about the heart cycles or respiratory cycles, respectively. Interbeat intervals can be found easily by applying a simple peak detector. An empirical mode decomposition is an alternative approach to wavelet decomposition, and it is also a very suitable approach to cope with nonlinear and nonstationary signals such as cardiorespiratory signals.
A recent study by the authors [13] presented a comparative study using wavelet transform, cepstrum, fast Fourier transform, and autocorrelation function for heart rate measurement using ballistocardiogram signals. These signals were collected from 50 subjects in a sitting position in which an optical fiber sensor was located in the headrest of a massage chair. The quantitative analysis of this study concluded that the wavelet transform analysis can cope with the nonlinear and nonstationary characteristics of the signals, and so it provided close results to the reference ECG device. Furthermore, a very recent study by Suliman et al. [14] have shown the superiority of the wavelet analysis-based method proposed by Sadek et al. [15] over other existing peak-detection methods.
Apart from the algorithms mentioned above, machine learning approaches [16, 17] have been implemented for measuring heartbeats. However, manual labeling of training data can become quite a restrictive property. Furthermore, the training step should be repeated whenever the data collection protocol has been changed.
The contribution of this review paper is to introduce the types of sensors that are being currently used for BCG signal data acquisition and to provide a comprehensive review along with pros and cons, of the algorithms for analyzing and interpreting BCG signals. The algorithms can be used to extract vital information such as the heartbeat, respiration, and body movements from the BCG signal. The sensors presented include piezoelectric polyvinylidene sensors (Sect. 2), electromechanical film sensors (Sect. 3), pneumatic sensors (Sect. 4), strain Gauges (Sect. 5), hydraulic sensors (Sect. 6), microbend fiber-optic sensors as well as fiber Bragg grating sensors (Sect. 7). A variety of signal processing algorithms are reviewed. These algorithms are applied for analyzing the BCG signal and extracting physiological parameters such as heart rate and breathing rate, as well as determining sleep stages. We also recommend which methods are more suitable in each case, since the BCG signal poses unique challenges due to its nonlinear and nonstationary characteristics.
Piezoelectric polyvinylidene fluoride-based sensors
Technical information
The piezoelectric effect is the ability of some materials to produce an electric charge in response to applied mechanical stress. Polyvinylidene fluoride (PVDF) is an exciting piezoelectric material and is usually developed as a fragile and easily bent film. If a pressure force is applied to the film, it creates a mechanical bending and a shifting of positive and negative charge centers in the film, which then results in an external electrical field. The charge generated from PVDF is proportional to the applied pressure. Therefore, PVDF is one of the suitable candidates for detecting the small fluctuations generated by different body parts [18]. We can derive the output voltage generated by the PVDF as stated below:
| 1 |
Where q denotes the number of charges induced in different directions; the unit is , defines the piezoelectric coefficient matrix. i.e., the amount of the charge produced when the unit force applies to the material and is the unit force applied to an area ; the unit is () (Fig. 3).
Fig. 3.
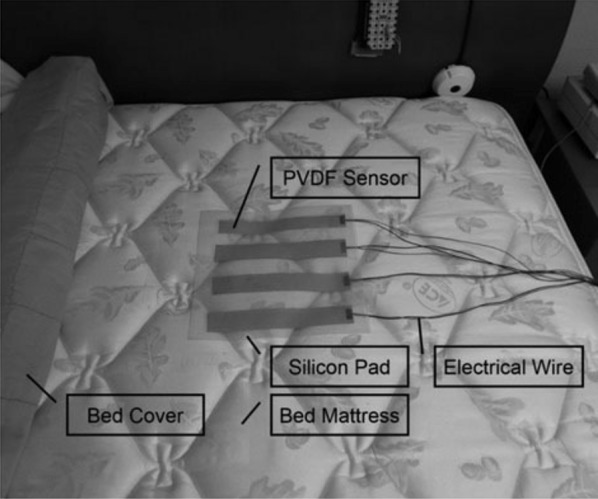
An example of a PVDF sensor consisting of a array. Image adapted from [19]
Data analysis
Wang et al. [20] proposed to use a PVDF piezopolymer film sensor for unconstrained detection of respiration rhythm and pulse rate. The film sensor was placed under the bed-sheet at the location of the thorax to obtain the variations of the pressure on the bed attributable to respiratory movement and heartbeats. The authors used the wavelet multiresolution decomposition to compute the respiration rate and heart rate. The output of the respiratory inductance plethysmography (RIP) and electrocardiography (ECG) were used as a reference for respiration and heartbeat, respectively. The objective of the wavelet analysis was to decompose the raw signal into low-frequency components and high-frequency components. Next, the component presenting a good agreement with either the respiratory movement or the heartbeat was selected. Afterward, the respiratory rate was computed directly based on a time-varying adaptive threshold. On the other hand, the heartbeat component was first squared to rectify it into unipolar, and then the envelope of the rectified signal was calculated using a moving average smoothing algorithm. Lastly, a time-varying adaptive threshold was also applied to the smoothed envelope to compute the heart rate. It should be noted that heart rate detection was very challenging because the pressure variations attributable to heartbeat on the bed were very weak, and the shape of the signal was not always uniform. Another study was proposed by Wang et al. [21] to detect respiration rhythm and pulse rate of premature infants using PVDF sensor array. The system was tested in the clinical environment on five premature infants (1 male and four females). The primary challenge of the proposed method was constant body movement of the infants and the weakness of the heartbeat vibration.
Niizeki et al. [22] suggested using a PVDF sensor array for unconstrained monitoring of respiration and heart rate. The sensor array consisted of eight PVDF cable sensors, and they were horizontally integrated with a textile sheet on a bed surface covering the upper half of the body. The cardiorespiratory signals, i.e., BCG and respiration were obtained using infinite impulse response digital filters. After extracting the cardiorespiratory signals, an optimal sensor selection search routine was applied to select the most appropriate sensor. The selection criterion was based on the magnitude of the power spectrum density (PSD). The autocorrelation functions of the cardiac and respiratory signals were computed using 5-s and 15-s time segments for heartbeat and respiration, respectively. The outputs of the autocorrelation functions were smoothed and differentiated using a Savitzky-Golay (5 adjacent points) algorithm, and finally, the heart rate and respiration rate were computed by measuring the intervals between the peaks for the respective autocorrelation functions. A fixed threshold was used to determine if the subject changes posture during the measurement, in which the output from the PVDF cables was disturbed to a large extent. A charge-coupled device (CCD) camera was used to record the image of the body position during posture change as a time stamp. The proposed system was tested against thirteen healthy male subjects whose ages ranged from 21 to 49 years. ECG and pneumotachometer for measuring respiratory flow were used as a reference during the study. The study consisted of two phases, i.e., short-term recording for 10 min and an overnight study for 2 h. For the overnight recording, only seven subjects were involved. The proposed system had some limitations in particular susceptibility to motion artifacts caused by the subject movements that might have led to the misidentification of the peak for autocorrelation functions.
Paalasmaa and Ranta [23] applied an unsupervised learning approach on ballistocardiogram signals to compute heartbeat. The ballistocardiogram signals were collected from three subjects using a piezoelectric pressure sensor over 5 h of recording. Initially, feature vectors were extracted from the signal at possible heartbeat positions, i.e., the local maxima of the signal. Then, a complete-link clustering was applied to the feature vectors to look for a cluster with the highest density. The positions of the feature vectors of the densest cluster were found to match real heartbeat positions in the signal. An angular dissimilarity measure was adopted since it omits the differences in feature vector amplitudes. The sensor was located close to the patient’s upper body so that it can adequately register cardiac activity.
Paalasmaa et al. [24] introduced a sleep tracking web application, which was based on measurements from a piezoelectric film sensor placed under the mattress topper. The raw data coming from the sensor was sent to a web server for analysis and extracting information. This information includes heart rate, respiration, sleep staging, and stress reactions. The heart rate was computed by creating a heartbeat template using complete-link clustering [23], then the heart rate intervals were detected by selecting those intervals that minimize a predetermined residual error. The sleep staging was carried out by utilizing heart rate variation, respiration variation, and activity information. The proposed approach was validated against a 40-patient group at a sleep clinic. The added value of this work is the suitability of the system for long-term monitoring of sleep and the web application for sleep analysis at home. A more comprehensive study was introduced by Paalasmaa et al. [25] to compute heart rate from ballistocardiogram signals acquired with a piezoelectric film sensor. At first, a model for the heartbeat shape was adaptively deduced from the signal using a hierarchical clustering approach. Afterward, interbeat intervals were identified by detecting positions where the heartbeat shape best matches the signal. The proposed method was verified with overnight recordings from 46 subjects in different settings, i.e., sleep clinic, home, single bed, and a double bed.
Chen et al. [26] advised to use four piezoelectric sensors to detect heart rate and respiration. One sensor was placed under the pillow, whereas the other three were placed under the mattress close to the back, hip, and calf level positions. The data was collected from five healthy subjects at the age of twenties during a 2-h’s nap in a sleep lab. ECG and nasal thermistor signal were employed as heart rate and respiration references. Heart rate and respiration were computed based on the multiresolution analysis of the wavelet decomposition in which the Cohen–Daubechies–Feauveau biorthogonal wavelet was selected as the basis function to design the decomposition and reconstruction filters. The 6th level approximation waveform was similar to the respiratory rhythm, while a combination of the 4th and 5th scale coefficients were found to be suitable for heart rate detection. The authors were able to measure both vital signs from the four positions. However, the overall optimal position was found in the back. That makes sense because the more the sensor is closer to the thorax, the more accurate the recovered signals are.
A wheelchair-based system for monitoring the cardiac activity of its user was proposed by Pinheiro et al. [27]. The signals were collected from piezoelectric film sensors and micro-electromechanical systems accelerometers installed in the seat and backrest of the chair. The system also included photoplethysmography (PPG) sensors in the armrests. The data from the sensors were sent via Wi-Fi to a laptop with a data acquisition board for more in-depth analysis. ECG recordings were used to validate the proposed system. The system was tested in different situations, namely unmoving wheelchair, tiled floor motion, and treadmill tests. In the last two conditions, the ballistocardiogram signals collected from the piezoelectric sensors were corrupted entirely by motion artifacts. On the other hand, the accelerometer was much more insensitive to wheelchair motion. The analysis was done on seven subjects using the fast Fourier transform. Subsequently, the prominent peak was selected within a specific frequency range for heart rate estimation. In summary, getting informative ballistocardiogram signals from the piezoelectric sensors in a motion situation was almost impossible. However, it was more convenient to get informative signals from the accelerometers and the PPG sensors.
A multichannel approach was proposed by Kortelainen et al. [28] to extract heart rate and respiration information using eight PVDF sensor channels located in the upper position of the bed. The heart rate was estimated by averaging the signal channels in the frequency domain, in which a sliding time window was utilized to compute the cepstrum of each signal channel. However, the respiratory rate was calculated from the first principal component of a principal component analysis (PCA) model applied to the low-pass filtered bed sensor signal. The assumption was that the first primary component would give the signal with the maximum variance, and as a result, shall improve the sensitivity for the extraction of the respiration. Twenty-eight patients were recruited for the study, and they were suspected of having diverse kinds of sleep problems. Frequency domain averaging was better than simple averaging over all the sensor channels. The extracted information, i.e., heart rate, respiration, and movement might have been used for further sleep analysis.
The same pressure bed sensor assembly with eight PVDF sensors was applied for sleep apnea detection in [29]. Two methods computed the respiratory signal. The first method was to implement a Hilbert transform to the bed sensor signal and then to smooth the signal with a low-pass filter. The second method was similar to Kortelainen et al. [28] by adopting the PCA approach. At last, the amplitude baseline of the respiratory signal was estimated as the mean value of the previous 100 s. An apnea event was detected if the ratio with the baseline was less than a selected percentage threshold value for at least 10 s. The authors applied their methodology to twenty-five patients out of twenty-eight patients recruited in [28]. The system showed a good agreement with the reference polysomnography. However, the authors used the simplified, reduced respiratory amplitude index (RRAI) instead of the standard apnea-hypopnea index (AHI). In another study, Brüser et al. [30] have implemented three different methods using the same sensor set to measure the heart rate in a nonintrusive way. Initially, the heart rate was computed using a sliding window cepstrum analysis [28]. Secondly, the heart rate was computed using a Bayesian fusion approach, in which three estimators were calculated from each sensor channel such as adaptive-window autocorrelation, adaptive-window average magnitude difference function, and maximum amplitude pairs. For each channel, these three estimator outputs were then combined using a Bayesian fusion method to obtain an overall estimate. In other words, Bayesian fusion approach was applied to 24 estimates. Finally, the heart rate was estimated based on the approach mentioned above, for each channel separately. In general, the multichannel based approaches improved the robustness of heartbeat interval estimation over a single sensor. More specifically, Bayesian-based method slightly outperformed the cepstrum-based method.
Martin-Yebra et al. [31] extracted heart rate variability indices from ballistocardiogram signals and then evaluated their correlation with electrocardiogram-derived ones. The ballistocardiogram signals were acquired by a piezoelectric 3D-force plate in supine and standing positions, in a group of 18 healthy subjects (11 females). For each position, the data collection was performed for 5 min. Furthermore, subjects were asked to stay quiet to avoid any motion artifacts. The ballistocardiogram waves, i.e., (H, I, J, K) were detected by synchronizing ballistocardiogram signals with ECG signals. Although the proposed approach provided a good match with the reference ECG, it is tough to generalize this approach for real-life deployment as the data collection was conducted for a short time, and the detection part was achieved by adapting information from the ECG signals.
Katz et al. [32] measured cardiac interbeat intervals using a contact-free piezoelectric sensor placed beneath the mattress under the tested subjects. The data was collected from 25 home sleep recordings of 14 healthy subjects in a two-in-bed setting. The authors applied three algorithms to the collected ballistocardiogram signals as follows. First, interbeat intervals were found by decomposing the signal into multiple components using an empirical mode decomposition filter and then locating the candidate peaks within a localized search area. Second, after locating potential interbeat intervals, a binomial logistic regression model was applied to classify each interbeat interval into one out of three groups based on morphological properties of the ballistocardiogram signal. Finally, an additional algorithm was implemented to get discrete interbeat interval distribution maps during the night recording, considering interbeat interval data from overlapping 15 min windows. The preceding three algorithms demonstrated the effectiveness of the proposed system for heart rate variability analysis. Sela et al. [33] used the same piezoelectric sensor to detect left ventricular ejection for ten subjects (6 males and four females), where the lower body of each subject was enclosed in a negative pressure chamber. The negative pressure chamber regulates and controls the blood pressure of the participants. This study demonstrated the ability of the system to identify internal bleeding condition among patients at risk, namely individuals after an accident or surgical operation.
Alvarado-Serrano et al. [34] measured beat-to-beat heart rate from subjects sitting in a typical office chair. The authors used a piezoelectric sensor fixed to the bottom side of the seat to collect ballistocardiogram signals from seven subjects (5 males and two females). Continuous wavelet transform with splines was implemented to detect beat-to-beat intervals in which an optimal scale was selected to reduce noise and mechanical interference. Thenceforth, learning and decision phases where applied to the selected scale to detect potential J-peaks. In the learning phase, the first four heartbeats in the ballistocardiogram signal were found to define initial thresholds, search windows, and interval limits. The learned parameters were then utilized to determine the next heartbeat and were readopted after each heartbeat detected to adhere to the heart rate and signal-amplitude changes. Liu et al. [35] proposed a similar study. However, two PVDF film sensors were installed in the seat cushion and foot insole.
Choe and Cho [36] used a piezoelectric sensor installed between a bed-frame and a mattress for unconstrained monitoring of heart rate. The data was collected from 7 male subjects sleeping in a supine sleeping position where the sensor was placed under the subject’s back. In total, they collected ballistocardiogram signals for about 5 h from all subjects, in which subjects were not moving during data acquisition. The data was first smoothed using a moving mean absolute deviation; then the J-peaks were detected within a specific search region using an adaptive thresholding technique. The authors achieved satisfactory results with the reference ECG. However, this method may not be applicable in real-life applications because the data was not collected in a normal sleep sitting and the motion artifacts were not considered as well. Table 2 summarizes the unconstrained monitoring of vital signs using PVDF-based sensors. After exploring the various approaches employed to analyze the piezoelectric-based BCG signals, the ensuing section will discuss the different strategies used to analyze electromechanical-film based BCG signals.
Table 2.
Summary of unconstrained monitoring of vital signs using PVDF-based sensors
| Method | Subjects (M, F) | Deployment | Duration | Outcome | |
|---|---|---|---|---|---|
| Wang et al. [20] | WT | N/A | Lab | N/A | HR, RR |
| Wang et al. [21] | WT | 5 P. Infants (2 M and 3 F) | Hospital | 10 Min | HR, RR |
| Niizeki et al. [22] | ACF | 13 M | Home | 10 Min, 2 Hrs | HR, RR |
| Paalasmaa and Ranta [23] | CLC | 3 N/A | Lab | 330 Min | HR |
| Paalasmaa et al. [24] | CLC, TM | 40 N/A | Sleep clinic | Overnight | HR, RR |
| Paalasmaa et al. [25] | CLC, TM | 60 N/A | Sleep clinic, Home | Overnight | HR |
| Chen et al. [26] | WT | 5 N/A | Lab | 2 Hrs | HR, RR |
| Pinheiro et al. [27] | FREQ | 21 N/A | Wheelchair | 5 Min | HR |
| Kortelainen et al. [28] | CEP, PCA | 6 N/A, 15 M, 13 F | Hospital | Overnight | HR, RR |
| Guerrero et al. [29] | PCA | 15 M, 13 F | Hospital | Overnight | Apneas |
| Brüser et al. [30] | ACF, MAP, AMDF | 15 M, 13 F | Hospital | Overnight | HR |
| Martín-Yebra et al. [31] | ECG Sync | 17 M, 11 F | Lab | 5 Min | HRV |
| Katz et al. [32] | EMD | 14 N/A | Home | Overnight | HR |
| Sela et al. [33] | N/A | 6 M, 4 F | Lab | 84 Min | LVET |
| Alvarado-Serrano et al. [34] | CWT | 5M, 2 F | Chair | 100 Sec | HR |
| Liu et al. [35] | Adaptive TH | 7 M | Lab | 45 Min | HR |
| Choe and Cho [36] | CWT | 6 N/A | Lab | 67 Min | HR |
WT wavelet transform, N/A not available, P. Infants premature infants, M male, F female, HR heart rate, HRV heart rate variability, RR respiratory rate, ACF autocorrelation function, Min minutes, Hrs hours, Sec seconds, CLC complete-linkage clustering, TM template matching, FREQ frequency, CEP cepstrum, PCA principal component analysis, MAP maximum amplitude pairs, AMDF adaptive-window average magnitude difference function, ECG Sync electrocardiogram synchronization, EMD empirical mode decomposition, TH threshold, CWT continuous wavelet transform, Lab laboratory, LVET left ventricular ejection time
Electromechanical film-based sensors
Technical information
The electromechanical film (EMFi) material is a plastic film that can transform mechanical energy into an electrical signal and the other way around. Basically, it is a flexible and thin bi-axially oriented polypropylene film covered with enduringly polarized and electrically conductive layers. EMFi has a static charge reaching hundreds of Volts. When a pressure is applied to the film, a charge is created on its electrically conductive surfaces, and this charge can be measured as a current or voltage signal, usually with a charge amplifier. As a result, the EMFi serves as a sensitive motion sensor [37]. A related point to consider is that the sensitivity of the EMFi material is an order of magnitude better than the one acquired by piezo materials. Moreover, due to the high intrinsic resistance and bubble structure, the charge perseveres for a long time. That being said, a side effect is that storing or employing the sensors in temperatures higher than 50 °C deteriorates the material (Fig. 4).
Fig. 4.
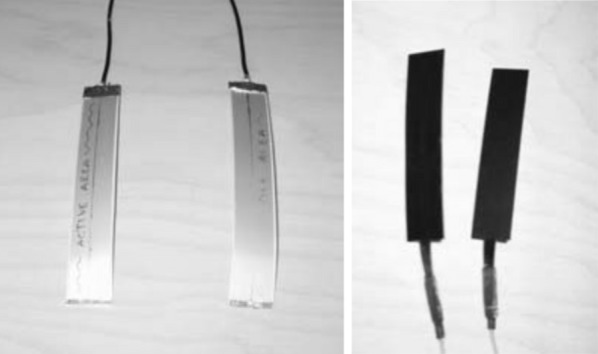
Two examples of Emfi strips. Image adapted from [37]
Data analysis
Alametsä et al. [37] suggested using EMFi sensors for obtaining ballistocardiogram signals from certain places of the body. The authors installed EMFi sensors in a chair and smaller pieces in a few positions on the body (arm, leg, and chest). The ballistocardiogram signals were collected from a few people, and the duration of the recordings was relatively short. This study demonstrated the potential of the EMFi material in monitoring the changes in cardiac function. In another study, Koivistoinen et al. [38] evaluated the ability of the EMFi sensors for measuring ballistocardiogram signals. The authors installed two EMFi sensors in the seat and backrest of a normal chair, and the data was collected from two young subjects (1 male and one female) for 5 min. After visual inspection versus the reference ECG, it was found that the acquired waveforms are in close agreement with those reported in the literature. Equivalent results were also reported by Junnila et al. [39, 40], which presented the suitability of the EMFi sensors for extracting ballistocardiogram signals.
Koivistoinen et al [41] developed a smart mattress to detect interbeat intervals in a nonintrusive way from six male subjects. The mattress consisted of 160 EMFi electrodes distributed throughout the mattress that enabled signal acquisition from multiple locations. Two methods were implemented to detect interbeat intervals, i.e., a pulse method and an adaptive window cepstrum method. In the former, signals from all channels were high pass filtered and then squared. After that, these squared values were averaged between all channels, and the result was low-pass filtered. Finally, the beginning of each heart rate was tracked in the generated pulse train signal. In the latter, the window length of the cepstrum was selected using the pulse based method as the first estimator of the heart beats. Then, signals from all channels were averaged in the frequency domain. Interpolation was used to detect more accurate location for the selected cepstrum maximum value. Moreover, the motion artifacts were eliminated based on the signal variance using a sliding time window. Although the cepstrum-based method provided better results than the pulse based method, its computational efficiency was not as good as the adaptive window method.
Aubert et al. [42] adopted a single EMFi sensor to provide heart rate, breathing, and an activity index representing body movements. The recommended system was validated utilizing data collected from 160 subjects (58 males and 102 females) for a total of 740 h. Part of the data was collected in a sleep laboratory from patients (i.e., sleep apnea, insomnia, and other sleep disorders), who underwent full polysomnography and the rest of the data was collected at home from healthy subjects. Body movements were first isolated from the sensor data based on the signal amplitudes and energy, and their time derivatives. After that, heart rate was measured using a sliding window autocorrelation method, in which the optimal window length had to span 3 to 5 consecutive beats. The respiratory rate was estimated based on the local peaks, troughs, and zero-crossings, constrained to rules ensuring physiological validity in terms of duration and amplitude. Across the 160 subjects, the vital signs were computed over epochs of 30 s, and the average values were computed and compared to the reference ECG and thorax belt, respectively. The recommended system achieved satisfactory results compared to the reference devices.
Kärki and Lekkala [43] used EMFi and PVDF sensors in the measurements of heart rate and respiration. The objective of the study was to determine if there were differences between the results of both sensors. ECG was used as a reference for heart rate and a thermistor for respiration rate. Heart rate and respiration were measured using power spectral density (PSD). The two sensors were embedded inside a textile pocket, and the pocket itself was integrated into clothing. They were positioned underneath a commercial heart rate belt on the left side of the sternum. Preliminary results showed that both sensors provided reliable results in the measurements of heart and respiration rates. However, the PSD was not robust enough because the peak in the spectrum might get wider and multiple peaks might appear. Kärki and Lekkala [44] proposed another study to determine heart rate with EMFi and PVDF materials. The EMFi and PVDF sensors were grouped to form a single structure. The data was collected from 10 subjects (5 males and five females) over 60 s recording (sitting and supine positions), where the sensor structure was placed under the legs of a chair and bed. These preliminary results demonstrated that the heart rate could be measured at home just by sitting on a chair or lying in a bed.
Pinheiro et al. [45] introduced a low-cost system to measure blood pressure variability and heart rate variability. A single EMFi sensor was installed in the seat of a normal office chair to measure ballistocardiogram signals while a finger PPG was used to estimate arterial oxygen saturation (SpO2). For validation, ECG was acquired using three chest leads. Using LabVIEW, heart rate and heart rate variability were determined by an adaptive peak detection algorithm. The pulse arrival time was estimated as the time difference between ECG and PPG maximum peaks. When considering BCG-PPG relation, the I-valley (Fig. 1a) was the reference. The designed system was appraised using data collected from five healthy volunteers over 10 min of recording. The preliminary study demonstrated that heart rate variability could be measured using the correlation between BCG and PPG. The PSD was exploited to measure the heart rate. In another study, Pinheiro et al. [46] collected ballistocardiogram signals by placing an EMFi sensor in the backrest of a wheelchair, beneath the lining. Two modulation-based schemes were carried out for heart estimation, i.e., a sliding power window and an all-peak detector. The objective was to find all local maxima and local minima, then a spline interpolation and a moving power window were employed to compute a modulating signal. Finally, a fast Fourier transform was applied to the output of each method to measure the average heart rate from the signal’s fundamental frequency. This system was evaluated using data gathered from six normal subjects (4 males and two females) for 125 s.
Brüser et al. [47] proposed an unsupervised approach to determine inter-beat intervals using an EMFi sensor. The sensor was fixed underneath a thin foam overlay which was then located on top of the mattress of a typical bed. The system was evaluated on over-night recordings from 33 individuals (14 males and 19 females). Three estimators were implemented, namely autocorrelation function, average magnitude difference function, Maximum amplitude pairs to compute the local interval length using a sliding time window. Ideally, this window contained two events of interest. Two thresholds constrained the values of the local interval length, i.e., Tmin and Tmax. The body movements were detected based on the maximum amplitude range of each time-window. The information from the three estimators was then applied to a probabilistic Bayesian method to estimate the inter-beat intervals continuously. Although the proposed method achieved very satisfactory results, the main limitation existed in the implicit hypothesis that two successive heart beats in the BCG have an unknown but similar morphology. This assumption may not always hold.
In a similar study, Zink et al. [48] used an EMFi sensor to detect heartbeat cycle length in patients suffered from atrial fibrillation and sinus rhythm. The sensor was placed under the bed-sheet and data was collected from 22 patients (15 male and seven female) during and after cardioversion. Cardioversion is a medical procedure that returns a normal heart rhythm in people with certain types of abnormal heartbeats, namely arrhythmias. In another study, Zink et al. [49] employed the EMFi sensor to measure heartbeat in patients suffered from sleep-disordered breathing. Twenty-one patients (19 males, two females) were recruited for the study and underwent standard full-night polysomnography. A quality-index was proposed based on the three estimators discussed in [47] that allowed to identify segments with artifacts and to exclude them from the analysis automatically. The proposed system provided a good correlation of beat-to-beat cycle length detection with simultaneously recorded ECG.
Pino et al. [50] used two EMFi sensors installed in the seat and backrest of a normal chair to measure heart rate. Ballistocardiogram data were collected from 54 individuals, where 19 were measured in a laboratory (1 min) and the rest in a hospital waiting room (2 min). Firstly, empirical mode decomposition and wavelet analysis were (Deabuchie 6) implemented to reconstruct ballistocardiogram signal. Secondly, the J-peaks of the ballistocardiogram signal was detected using a length transform analysis. The body movements were eliminated using a moving time window. Then, for each time-window two thresholds were computed, i.e., and , if was greater than , the current window was marked as a body movement. Wavelet analysis was preferred to reconstruct the signal as it produced a higher effective measurement time. A similar approach was also proposed by Pino et al. [51]. However, they increased the size of the dataset to 114 people, of whom 21 were gathered in a school (2 min), 42 in homes (2 min), and 51 in a hospital waiting area. It is difficult to assess the robustness of this system because the data was collected in a short time and a controlled environment as well.
In a recent study, Alametsä and Viik [52] presented the stability of ballistocardiogram signal for 12 years, on which the data was gathered from a single person in a sitting position using EMFi sensors. Several other signals were recorded as well, such as ECG, an ankle pulse signal, and the carotid pulse signal from the neck near the carotid artery. All measurements lasted about 2 to 3 min with a sampling frequency of 500 Hz. In conclusion, ballistocardiogram research may be recommended to examine long-term changes in heart operation and to reveal variations in it. Table 3 summarizes the unconstrained monitoring of vital signs using the EMFi-based sensors. After investigating the diverse approaches employed to analyze the electromechanical film-based BCG signals, the subsequent section will discuss the different strategies used to study pneumatic based-BCG signals.
Table 3.
Summary of unconstrained monitoring of vital signs using EMFi-based sensors
| Method | Subjects (M, F) | Deployment | Duration | Outcome | |
|---|---|---|---|---|---|
| Kortelainen and Virkkala [41] | Visually | 1 M, 1 F | Lab | 5 Min | BCG |
| Kortelainen and Virkkala [41] | CEP | 6 M | Lab | Overnight | HR |
| Aubert and Brauers [42] | Adaptive TH, ACF | 58 M, 102 F | Sleep lab, Home | Overnight | HR, RR |
| Karki and Lekkala [43] | PSD | N/A | Lab | 60 Sec | HR, RR |
| Karki and Lekkala [44] | PSD | 5 M, 5 F | Lab | 30 Sec | HR, RR |
| Pinheiro et al. [45] | PSD | 5 N/A | Lab | 10 Min | HR, BP |
| Pinheiro et al. [46] | PSD | 4 M, 2 F | Lab | 125 Sec | HR |
| Brüser et al. [47] | ACF, MAP, AMDF | 14 M, 19 F | Clinic | Overnight | HR |
| Zink et al. [48] | ACF, MAP, AMDF | 15 M, 7 F | Hospital | N/A | HRV |
| Zink et al. [49] | ACF, MAP, AMDF | 19 M, 2 F | Hospital | Overnight | HR |
| Pino et al. [50] | EMD, WT, LT | 54 N/A | Lab, Hospital | 1 Min, 2 Min | HR |
| Pino et al. [51] | EMD, WT, LT | 114 N/A | Hospital, Home | 2 Min, 2 Min | HR |
WT wavelet transform, N/A not available, M male, F female, HR heart rate, RR respiratory rate, HRV heart rate variability, ACF autocorrelation function, Min minutes, Hrs hours, Sec seconds, CEP cepstrum, MAP maximum amplitude pairs, AMDF adaptive-window average magnitude difference function, EMD empirical mode decomposition, TH threshold, LT linear transform, PSD power spectral density, Lab laboratory
Pneumatic-based sensors
Technical information
The idea of the pneumatic system is to deploy a thin air-sealed cushion between the bed and mattress. After that, when a person rests in the bed, the forces originated because of the heartbeat, respiration, snoring and body movements affects the air in the cushion through the mattress. i.e., the air pressure in the cushion then changes in synch with these movements. These slight human movements cause pressure and so a super-sensitive pressure sensor can measure such variations in pressure [53, 54].
Data analysis
Watanabe et al. [55] used the pneumatic mentioned above system to measure heartbeat, respiration, snoring, and body movements in a noninvasive manner. The three bio-signals, namely heartbeat, respiration, and snoring were detected using a band-pass filter with different cutoff frequencies. After that, the windowed Fast Fourier transform algorithm was applied to measure heart rate and respiration. However, the relative magnitude of snoring was calculated by the standard deviation of the filtered snoring signal, and the relative magnitude of body movements was calculated as the standard deviation of the envelope of the sensor output signal. The authors validated the proposed system using data collected from 15 subjects (12 males and three females) over 15 nights. Preliminary results showed good agreement against reference devices, namely ECG, belt-type respirometer, and a snoring detection microphone. The body movements were identified and recorded by a CCD camera. In another study, Kurihara and Watanabe [56] acquired data from 10 subjects (20 s each) to measure heart rate and respiration. In this study, a condenser microphone was used as a reference for heart rate, respiration and signal-to-noise ratio. Validation results demonstrated that the pneumatic system was more susceptible to environmental noise, for example, opening and closing the door than the reference condenser microphone.
Chee et al. [57, 58] recommended to use a balancing tube between two air cells to improve the effectiveness of posture changes during data collection. The balancing tube with a high air resistance was aimed at equalizing the pressure of each air cell within a certain time constant. More precisely, it performed the role of a high-pass filter to eliminate body motion. The air-mattress system consisted of 19 air cells, in which measurements can be performed between any pair of cells. However, the authors collected data from the two cells situated on the back side of the chest and abdominal region. Signal was collected from a single subject laying on the air mattress where ECG and nasal airflow signal were collected simultaneously. Although the balancing tube helped eliminate body motion, it affected the sensitivity of the measurement. Heart rate was measured by finding the maximum peak of the BCG signal between the two R-R peaks of the ECG signal. On the other hand, the respiratory rate was measured by windowed fast Fourier transform, i.e., short-time Fourier transform (STFT). Preliminary results showed a good match against reference devices. Nevertheless, the proposed system might not be a preferred choice for large-scale deployment due to its complexity. In another study, Shin et al. [59] applied the same air mattress for uncontaminated measurement of heart rate and respiration. In which, a total of 13 healthy male subjects were involved in the validation study, i.e., 4 h of study. The authors measured the heart rate from the R-peaks of the ECG, while the respiratory rate was measured manually. Besides, the authors asked three subjects to simulate sleep apnea (breath-holding) five times each for 10 to 15 s. After that, the apneas were detected based on the variance of the respiratory signal with a moving window technique. Table 4 summarizes the unconstrained monitoring of vital signs using the pneumatic-based sensors. After investigating the different approaches used to analyze the pneumatic based-BCG signals, the following section will discuss the various strategies used to study strain Gauges based-BCG signals.
Table 4.
Summary of unconstrained monitoring of vital signs using Pneumatic-based sensors
| Method | Subjects (M, F) | Deployment | Duration | Outcome | |
|---|---|---|---|---|---|
| Watanabe et al. [55] | STFT | 12 M, 3 F | Lab | Overnight | HR, RR |
| Kurihara and Watanabe [56] | STFT | 10 N/A | Lab | 20 Sec | HR, RR |
| Chee et al. [57], Shin et al. [58] | ECG Sync, STFT | 1 N/A | Lab | N/A | HR, RR |
| Shin et al. [59] | ECG Sync, STFT | 13 M | Lab | 4 Hrs | HR, RR |
N/A not available, M male, F female, HR heart rate, RR respiratory rate, Min minutes, Hrs hours, Sec seconds, STFT short-time Fourier transform, ECG Sync electrocardiogram synchronization, Lab laboratory
Strain-gauge based sensors
Data analysis
Brink et al. [60] implemented four force sensors under bed-frames to unobtrusively record heartbeat, respiration activity, and body movements. Each force sensor consisted of a reflex light barrier sandwiched between two aluminum plates. When a force is applied to the sensor, the two aluminum plates are squeezed together slightly, and the distance between them decreases. The reflex light barrier senses the distance between the two plates and converts it into a voltage signal, which is analogous to the ballistic forces of the heart. This voltage signal is then pre-amplified and passed through a low-pass filter to eliminate ripple and noise. In this preliminary study, heartbeat and respiration were detected by finding local minima or maxima in the signal within a sliding window. For evaluating the robustness of the force sensors, the signals were acquired from four subjects (2 males and two females) and in different conditions, i.e., three types of single beds, three types of frames, two types of mattresses. In total, seventy-two conditions were evaluated. In each condition, subjects were asked to sleep in a relaxed prone position on the bed. The signals were collected during 5-min recording from the four force sensors. Additionally, ECG signals were also collected as a reference. Preliminary results showed that the proposed system could be an acceptable tool for automated and unattended sleep-data collection over a lengthy period (Fig. 5). Inan et al. [61] collected ballistocardiogram signals using strain gauges within a modified commercial scale. The signals were collected from twenty-one subjects (11 males and ten females), on which participants were asked to stand as quiet as possible on the scale for 45 s while BCG and ECG were concurrently recorded. In this study, the measured ballistocardiogram signals from all subjects closely resemble those reported in the literature. Besides, the system was able to provide beat-to-beat cardiac output monitoring. Additionally, ballistocardiogram measurements were found to be repeatable over 50 recordings collected from the same subject over three weeks. The proposed solution was more susceptible to motion artifacts because the signals were acquired in a standing position. Hence, it might not be suitable for older adults who cannot stand as tranquil on the scale to eliminate floor vibrations, Inan et al. [62] proposed a seismic sensor, i.e., geophone, located in proximity to the modified scale that served as the noise reference. An adaptive algorithm was then implemented to filter the output of this sensor and cancel the vibrations from the measured ballistocardiogram signal. Signals were collected from a healthy volunteer while another person stomped around the scale, hence producing increased floor vibrations. Furthermore, signals were also obtained from another volunteer standing inside a parked bus while the engine was functioning. This research established that ballistocardiogram recording is feasible in almost all environments, including ambulances and other transport vehicles, as long as the vibrations are not so significant to rail the electronics or lead to a distorted version of the ballistocardiogram force to be coupled to the scale.
Fig. 5.

Schematic drawing of a force sensor used for seismography recording. Image adapted from [60]
In the same way, Inan et al. [63] evaluated the electromyogram signal collected from the feet of the subject during ballistocardiogram recording as a noise reference for standing ballistocardiogram measurements. As the lower-body electromyogram signal can be obtained directly from the footpad of the modified scale, the proposed system is self-contained and can automatically eliminate motion artifacts. In another study, Wiard et al. [64] used a motion sensor instead of electromyogram sensors to record body motions and to serve as a noise reference. The added value of the motion sensor was to provide a minimum delay between the motion-related noise in the measured signal and the noise detected by the motion sensor. This minimum delay provided the time resolution needed to flag single heartbeat events, hence maximizing the refinement of the approach.
Brüser et al. [65] introduced an unsupervised learning approach to measuring heartbeat in a noninvasive manner. Ballistocardiogram signals were recorded by strain Gauges in a Wheatstone bridge configuration attached to the slat under the mattress of a hospital bed. A high-pass filter was applied to the raw data to remove low-frequency respiratory components. Next, a set of features, representing the structural morphology of the heartbeat, were extracted from a 30-second time segment. Afterward, the principal component analysis was applied to reduce the dimensionality of the feature vectors. Additionally, a k-means clustering algorithm was adopted to identify clusters of feature vectors. This training step resulted in a list of estimated heartbeat locations. The parameters obtained during the training step were thus manipulated to locate heartbeats in the remaining ballistocardiogram signal by merging the results of three independent indicator functions, i.e., cross-correlation, Euclidean distance, and heart valve signal. Finally, the estimated heartbeat locations were exploited to provide an improved list of beat-to-beat periods. Signals were captured from sixteen healthy subjects (9 males and seven females) for 30 min switching their positions every 7.5 min (left lateral, supine, right lateral, prone). This method produced good agreement with the reference ECG. However, the primary limitation was the training step as it had to be repeated whenever subjects enter the bed or adjust their posture concerning the ballistocardiogram sensor.
Nukaya et al. [66] provided a contact-free method for unobtrusive measuring of heartbeat, respiration, body movement, and position change. The authors collected the pressure data using four piezoceramics transducers set beneath bed supports. The proposed system was able to detect previous bio-signals without the need for a preamplifier, accordingly without any voltage source. This is because the sensing devices were distortion sensors that operate without an electrical power supply, i.e., they produce voltage according to the time derivative of the distortion.
Vehkaoja et al. [67] introduced dynamic pressure sensors for detecting heartbeat intervals of an individual sleeping on a bed. The pressure sensors were composed of EMFi material and located under the bed supports. In this study, individual heartbeats were not observed. However, the intervals at which the correlation between two successive signals segment maximized. Ballistocardiogram signals were collected from nine subjects (5 males, four females) during 1-h recording. The beat-to-beat intervals provided by this approach can be adopted in determining frequency domain of heart rate variability that is most frequently used in the assessment of sleep quality.
Lee [68] et al. proposed to use load cells, installed under bed supports, to measure heart rate and respiration for infants. Four infants (5 to 42 months) were involved in the study, and a total of 13 experiments were carried out between 10 to 178.8 min. Initially, heart rate and respiratory components were extracted using band-pass filters of various cutoff frequencies. For the heart rate component, a first-order differentiation filter was applied; thus a nonlinear transformation, i.e., a Shannon entropy was applied to the differentiated signal to obtain only positive peaks. Additionally, a moving average filter was employed to flatten out the spikes and noise bursts. At last, heart rate was measured by finding local peaks in an ideal signal. For the respiration component, as the band-pass filtered signal contained residual baseline drift, a detrending algorithm based on empirical mode decomposition was adopted to get rid of such unwanted trends. Similar to heart rate, local peaks were detected in the detrended signal, and therefore the respiratory rate was measured. A signal quality index was developed to choose the ideal signal out of the four load cells’ signals. The quality processing procedure was developed based on calculating a threshold value computed from an autocorrelation function and a power spectral density function. The proposed system achieved acceptable results compared to the reference ECG and respiratory belt. Table 5 summarizes the unconstrained monitoring of vital signs using the strain gauges-based sensors. After investigating the different approaches used to analyze the strain Gauges based-BCG signals, the following section will discuss the various strategies used to study hydraulic based-BCG signals.
Table 5.
Summary of unconstrained monitoring of vital signs using Pneumatic-based sensors
| Method | Subjects (M, F) | Deployment | Duration | Outcome | |
|---|---|---|---|---|---|
| Brink et al. [60] | SWM/M | 2 M, 2 F | Lab | 5 Min | HR, RR |
| Inan et al. [61] | ECG Sync | 11 M, 10 F | Lab | 45 Sec | HR |
| Bruser et al. [65] | PCA, K-means CCF, ED, HVS | 9 M, 7 F | Lab | 30 Min | HR |
| Vehkaoja et al. [67] | ACF | 5 M, 4 F | Lab | 1 Hrs | HR |
| Lee et al. [68] | SE, EMD, SWM/M | Infants (3 M, 1 F) | Home | 10 - 178.8 Min | HR, RR |
N/A not available, M male, F female, HR heart rate, RR respiratory rate, Min minutes, Hrs hours, Sec seconds, SWM/M sliding window minimum/maximum, ECG Sync electrocardiogram synchronization, PCA principal component analysis, CCF cross-correlation function, ED Euclidean distance, HVS heart valve signal, ACF autocorrelation function, SE Shannon entropy, EMD empirical mode decomposition, Lab laboratory
Hydraulic-based sensors
Technical information
The hydraulic bed sensor is composed of a transducer and a pressure sensor. The pressure sensor attached to the end of the transducer measures the vibration of the discharged hose. The pressure sensor provides a suitable range of 0 to 10 kPa, which is satisfactory to manipulate the range of pressures transferred from the weight of the body plus mattress through the hydraulic transducer while remaining sensitive enough to recognize low-amplitude variations such as the heartbeat (Fig. 6).
Fig. 6.
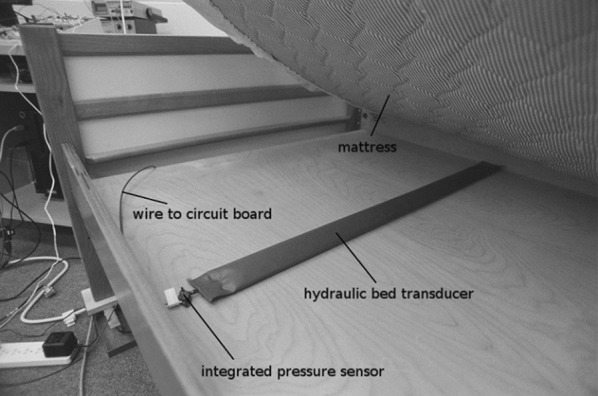
Example of a hydraulic sensor placed under a bed mattress; showing the transducer and the pressure sensor. Image adapted from [69]
Data analysis
For example, Heise et al. [70] designed a hydraulic based-sensor for free monitoring of heart rate and respiration. Preliminary data were collected from two individuals (1 male and one female). Participants were instructed to lie on a bed for approximately 10 min. During the 10 min, they were asked to lie on the back, on the right side, on the back again, on the left side, and on the back once more (2 min each position). In this preliminary research, the heartbeat signal was extracted by detecting the difference between the most negative and the most positive points within a moving window. After that, a low-pass filter was applied to reduce the effect of noise and smooth the signal. A fixed threshold was employed to detect body motion. Finally, the heart rate was measured by adopting the autocorrelation function. However, the respiratory rate was measured by low-pass filtering the signal and then subtracting the DC bias. Afterward, the zero-crossings were counted to provide the breaths per minute. Preliminary results approved that the hydroponic sensor was effective at extracting heart rate and respiration against the reference devices, namely a piezoresistive device worn on the subject’s finger and respiration band wrapped around the subject’s torso. In a different study, Heise et al. [69] have validated the sensor using data collected from five subjects (3 males and two females) and have confirmed stability of the signal processing algorithms using real and synthesized signals.
Rosales et al. [71] deployed four hydraulic transducers under the bed mattress, capturing signals from the upper part of the body to measure heart rate in a nonrestrictive way. Each transducer was connected to a pressure sensor to record the pressure forces applied to it. In this preliminary study, heartbeats were computed using a clustering-based approach as follows. Every 5 s, body motions were eliminated based on the variance of the transducers’ signal. Following body motions removal, the transducer’s signal was band-pass filtered to remove respiratory components and filtered once more using an average filter to smooth the signal before feature extraction. Afterward, three features were extracted from every 5-s time window based on the IJK points of the ballistocardiogram signal. Besides, the extracted features were classified into two groups using the k-means clustering algorithm. The first group, i.e., the smallest cluster was assigned to the heartbeat class. Then, the second group, i.e., the largest cluster was assigned to the non-heartbeat group. In conclusion, the heartbeats’ (J-peaks) locations were compared to a reference signal obtained from a piezoresistive device worn on the subject’s finger. Data were acquired from four subjects (2 males and two females) for 6 min (supine position). Although such a clustering-based approach might have provided excellent results, it may only apply to specific situations. Furthermore, for the presented method to be implemented in practical applications, the manually labeling effort necessary for adequately providing training data, is a restrictive property.
A similar study was proposed by Su et al. [72]. By contrast, however, in this case, the heart rate was measured using the Hilbert transform and the fast Fourier transform (30-s window). In this study, ballistocardiogram signals were acquired from five subjects (3 males and two females) during 2.5 min in a prone position. This approach provided a lower error rate compared with the windowed peak to peak deviation (WPPD) method introduced by Heise et al. [70]. Although results were consistent with the reference device, ballistocardiogram signals were assumed relatively stationary. This assumption is not always true because typically heartbeats are not uniform in time [73].
In another study, Lydon et al. [74] proposed a new algorithm to detect heart rate using the four hydraulic transducers. As a first step, a band-pass filter was implemented to remove the respiration component as well as high-frequency noise. Next, the data from the four transducers was separated into 0.3-s (30 samples) segments, and the short-time energy profiles were computed for each segment. As a result, four heart rate values were generated for each transducer by locating the local peaks. Moreover, a single heart rate value was selected based on the DC level of each transducer’s signal. Typically, a higher DC level in the obtained transducer’s signal means that the transducer makes better contact with the body and therefore, gives a more stable ballistocardiogram signal. Hence, the transducer with the highest DC level was chosen for heart rate measurement. Finally, outliers were eliminated by examining whether or not the estimated heart rate value was more than 15 beats/min from the moving average heart rate value. Validation data were collected from two groups, i.e., three subjects (2 males and one female) during 10 min of recording and four older adults (4 males) in a typical home environment. This approach provided slightly better results compared to the clustering-based approach provided by Rosales et al. [71].
To address the uncertainty inherent in a ballistocardiogram signal, arising for example, from the misalignment between training data and ground truth, an improper collection of the heartbeat by some transducers, Jiao et al. [75] applied the Extended Function of Multiple Instances (eFUMI) algorithm to ballistocardiogram signals generated by the four hydraulic sensors. The objective of the eFUMI was to learn a personalized concept of heartbeat for a subject in addition to several non-heartbeat background concepts. Following the learning step, heartbeat detection and heart rate estimation can be applied to test data. The limitation of this algorithm is the need for sufficient training data, which might not always be available.
Rosales et al. [76] applied the clustering-based approach [71] and the Hilbert transform approach [72] to ballistocardiogram signal collected from four male senior residents. The signals were collected from residents over a two to four months period under in-home living conditions. However, the analysis was done only over 5 min of original recordings. The Hilbert transform approach was able to produce more stable heart rate estimates compared to the clustering-based approach. The latter approach was more susceptible to motion artifacts. Table 6 summarizes the unconstrained monitoring of vital signs using the hydraulic-based sensors. After studying the different approaches used to interpret the hydraulic based-BCG signals, the following section will address the various strategies used to analyze fiber optic based-BCG signals.
Table 6.
Summary of unconstrained monitoring of vital signs using Hydraulic-based sensors
| Method | Subjects (M, F) | Deployment | Duration | Outcome | |
|---|---|---|---|---|---|
| Heise and Skubic [70] | WPPD | 1 M, 1 F | Lab | 10 Min | HR, RR |
| Heise et al. [69] | WPPD | 3 M, 2 F | Lab | 10 Min | HR, RR |
| Rosales et al. [71] | CA | 2 M, 2 F | Lab | 6 Min | HR |
| Su et al. [72] | HT | 3 M, 2 F | Lab | 2.5 Min | HR |
| Lydon et al. [74] | STE | 2 M, 1F 4M | Lab Home | 10 Min Overnight | HR HR |
| Jiao et al. [75] | eFUMI | 4 N/A | Lab | 10 Min | HR |
| Rosales et al. [76] | CA, HT | 4 M | Home | Overnight | HR |
N/A not available, M male, F female, HR heart rate, RR respiratory rate, Min minutes, Hrs hours, Sec seconds, WPPD windowed peak to peak deviation, CA clustering approach: HT Hilbert transform, STE short-time energy, eFUMI extended function of multiple instances, Lab laboratory
Fiber optic-based sensors
Technical information
In the existing literature, unobtrusive vital signs monitoring is achieved either by microbend fiber-optic sensors (MFOS) or fiber Bragg grating sensors (FBGS). First, the MFOS uses the light intensity modulation induced by microbending in multimode fibers as a transduction mechanism for detecting pressure, in which a graded-index multimode fiber is sandwiched between two layers of tuned grating structures that subject the fiber to mechanical perturbation when there is a pressure applied. The pressure causes the transmission modes in the multimode fiber to be coupled into the loss mode, reducing the amount of light received by the photodetector. Hence, the detected light is converted to current by the photodetector, which is, in turn, transformed into a voltage using a trans-impedance amplifier. [77–80]. Second, the FBG is an optical fiber that serves as a filter for a specific wavelength of light. The principle of the FBGS is to detect the reflected Bragg wavelength shift owing to changes in temperature, strain, or pressure [81, 82]. Fiber Bragg gratings are commonly used optical fiber sensors for measuring temperature and mechanical strain. However, contrary to the MFOS, the excessive cost of the interrogation systems is the most significant obstacle for their sizeable commercial application [83] (Fig. 7).
Fig. 7.
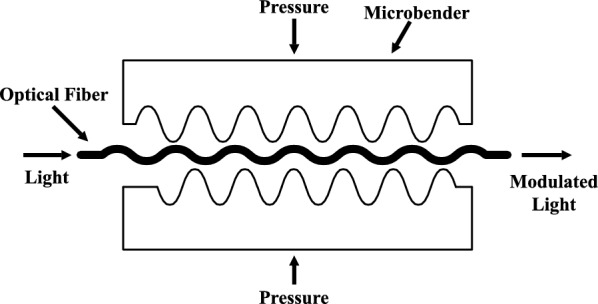
A cross section of the microbend fiber optic sensor. Image adapted from [84]
Data analysis
Chen et al. [85, 86] described the effectiveness of the MFOS for nonintrusive monitoring of heart rate and breathing rate. For heart rate, ballistocardiogram signals were gathered from several subjects in a sitting position and breathing normally. Preliminary results have proved that the ballistocardiogram waveforms closely corresponded to those reported in the existing literature. For breathing rate, nine volunteers were involved in the study in which respiratory signals were collected during sleep. The system has shown a good match with the respiratory reference device. Deepu et al. [87] introduced a smart cushion integrated with MFOS for real-time heart rate monitoring. The cushion can be placed on the seat or back of a chair for data collection. In this study, five subjects were involved, and signals were collected for 5-min durations. Several steps were applied to the cushion’s signals to measure the heart rate unobtrusively. Initially, low and high-frequency noises were suppressed using a band-pass finite impulse response (FIR) filter. Next, a cubing operation was applied to the filtered signal to enhance the amplitude swing while keeping the signal sign intact. Afterward, temporary upswing or downswing was removed by applying a moving average filter. Furthermore, the resultant signal was smoothed by utilizing the absolute value and averaging over a predefined time window. Finally, the J-peaks were recognized by using cone detection and comparing to an adaptive threshold. The proposed system achieved satisfactory results compared to the reference pulse oximetry device.
Chen et al. [88] studied the possibility of measuring blood pressure using ballistocardiography and photoplethysmography (PPG). The concept was to calculate the time delay between the peaks of the ballistocardiography and the corresponding PPG peaks. Ballistocardiogram signals were collected from five healthy subjects in a sitting position using a cushion integrated with MFOS, whereas PPG signals were collected from a finger pulse oximeter. Preliminary results showed that blood pressure might be measured using optical devices. However, the proposed approach was very challenging because it required a calibration procedure for each subject before measurement.
Lau et al. [89] evaluated the effectiveness of the MFOS for respiratory monitoring and respiratory gating in the setting of magnetic resonance imaging (MRI). Respiratory gating is the process of reducing cardiorespiratory artifacts by synchronizing magnetic resonance data acquisition to the cardiac or respiratory cycles. Unlike electrical sensors, fiber-optic sensors are immune to electromagnetic and radio-frequency interference. Twenty healthy subjects (10 males and ten females) were involved in the study, and they underwent T2-weighted half-Fourier single-shot turbo spin-echo MRI of the liver with synchronous breathing rate monitoring on a 1.5 Tesla magnetic resonance scanner. The breathing rate was detected by applying a band-pass filter and hence detecting local peaks in the time domain. This study presented that the MFOS were able to detect comparable breathing rate to the reference respiratory bellows and produce liver MRI images of good diagnostic quality compared to the navigator-acquired scans. Chen et al. [90] reported related results using data collected from eleven healthy subjects (6 males and five females) during MRI.
A similar study was provided by Dziuda et al. [91]. However, the authors used FBG sensors rather than MFOS. Three healthy volunteers (2 males and one female) were included in the study, and physiological data were collected for 95 min. Both heart rate and breathing rate were measured by finding local maxima after applying band-pass filters of different cutoff frequencies to the sensor data. Similar to the MFOS, the FBG sensor did not introduce any artifacts into MRI images. Furthermore, the system achieved comparable results to the reference devices, i.e., carbon electrodes and pneumatic bellows, respectively. Dziuda et al. [92–95] reported similar results using data collected during MRI examination.
Zhu et al. [96] demonstrated the effectiveness of the MFOS for unobtrusive measurement of heart rate in a headrest position. Three healthy individuals were enrolled in the study in which an optical sensor mat was placed on the headrest of a massage chair. The participants were instructed to complete a predefined series of tasks, i.e., rest, cognitive test battery, and a relaxing massage session. In this preliminary study, the analysis was done only during rest periods for a total of 6 min. A band-pass filter was applied to the sensor data to remove low-frequency respiratory signals. Afterward, heart rate was computed using a short-time Fourier transform. The proposed system achieved a relatively good agreement against the reference ECG.
Chen et al. [97] reported the results of using the MFOS in a clinical trial for unobtrusive monitoring of heart rate and respiration during sleep. During the study, data were collected from twenty-two subjects using the optical fiber sensor and also from the standard polysomnography as a reference. In the beginning, large body movements were eliminated using a moving time window. In which, a segment was identified as a body movement, if the difference between the maximum and the minimum in the moving window was larger than a fixed threshold. Next, respiratory and heartbeat components were separated from the sensor’s signals using band-pass filters of different cutoff frequencies. In the former, the signals were smoothed using a moving average filter, and hence the baseline was obtained by another moving-average filter of a larger window size. After subtracting the signals and the baseline, they were further smoothed using the Savitzky-Golay method. Finally, local peaks were detected, and the breathing rate was computed. In the latter, all local peaks of the heartbeat signals were detected, and heart rate was computed accordingly. Consequently, incorrect heart rate values were eliminated by applying a histogram-based method, in which the group with the highest occurrence was selected and reported as final heart rate results. Results were promising. However, the proposed approach was prone to motion artifacts.
Zhu et al. [98] proposed to measure heart rate using ballistocardiogram signals collected from the FBG sensor mat. The sensor mat consisted of three FBG sensor arrays or channels, and each array contained six sensors. The arrays were located under the pillow, upper chest, and lower chest. In this study, ten subjects were enrolled, and signals were collected for 20 min, of which 10 min were in the supine posture followed by 10 min of data collection in the sideways position. As a reference, ECG signals were collected along with the fiber-optic signals. The signal from each sensor array was transformed from the time domain into the cepstrum domain. After that, the signal from the six sensors of the same arrays was fused by employing cepstrum. Finally, the heart rate was measured from the fused signal by recognizing peaks in the cepstrum. This study demonstrated that the heart rate could be measured from distinct locations. However, the best results were achieved from sensor arrays at chest position. In another study, Zhu et al. [99] used the same system to compute the breathing rate, and the system was tested against twelve subjects.
Fajkus et al. [100] introduced to measure heart rate and respiration using FBG sensors encapsulated inside a polydimethylsiloxane polymer (PDMS). The FBG sensors were embedded within a thoracic elastic strap to record cardiorespiratory signals. In this preliminary analysis, the authors collected data from 10 individuals (6 males and four females) for a few minutes. Heart rate and breathing rate were detected by adopting two methods, i.e., identifying the periodic cycles in the time domain and applying the FFT to obtain the dominant frequency. The proposed system achieved comparable results to the reference ECG. However, it was susceptible to artifacts introduced by large body movements. In another study, Fajkus et al. [101] assessed the effectiveness of using FBG sensor encapsulated inside a PDMS and FBG sensor glued on a plexiglass pad for heart and respiratory rate monitoring. In this preliminary study, the authors collected data from 10 subjects (7 males and three females) and result shown that the FBG sensor encapsulated into PDMS was more accurate than FBG sensor encapsulated in plexiglass pad.
Chethana et al. [102] reported the use of FBG sensor for monitoring cardiac and breathing activities. Cardiorespiratory signals were collected from four subjects (2 males and two females) for 60 s, on which the FBG sensor was placed on the pulmonic area on the chest of the subjects. Results have been evaluated against an electronic stethoscope which recognizes and records sound pulses generated from the cardiac activity. Nedoma et al. [103] evaluated the effectiveness of the FBG sensor against fiber interferometric sensor for heart rate measurement. The former measured the heart rate through ballistocardiography, while the latter measured the heart rate through Phonocardiography. Cardiac signals were obtained from six individuals (3 males and three females) using the two sensors for 60 min. Primary results have shown that the fiber interferometric sensor was more accurate than the FBG sensor. Table 7 summarizes the unconstrained monitoring of vital signs using the fiber optic-based sensors.
Table 7.
Summary of unconstrained monitoring of vital signs using Fiber Optic-based sensors
| Method | Subjects (M, F) | Deployment | Duration | Outcome | |
|---|---|---|---|---|---|
| Chen et al. [86] | Visually | N/A | Lab | N/A | HR |
| Chen et al. [85] | Visually | 9 N/A | Lab | N/A | RR |
| Deepu et al. [87] | Peak Detector | 5 N/A | Lab | 5 Min | HR |
| Chen et al. [88] | PPG Sync | 5 N/A | Lab | N/A | BR |
| Lau et al. [89] | Peak Detector | 10 M, 10 F | MRI | N/A | RR |
| Chen et al. [90] | Peak Detector | 6 M, 5 F | MRI | N/A | HR, RR |
| Dziuda et al. [91] | Peak Detector | 2 M, 1 F | MRI | 95 Min | HR, RR |
| Dziuda et al. [93] | Peak Detector | 8 M, 4 F | MRI | 60 Min | HR, RR |
| Dziuda and Skibniewski [92] | Peak Detector | 1 M | MRI | 19 Min | HR |
| Krej et al. [95] | Peak Detector | 6 M, 2 F | MRI | 82 Min | HR |
| Zhu et al. [96] | STFT | 3 N/A | Lab | 6 Min | HR |
| Chen et al. [97] | Peak Detector | 22 N/A | Hospital | Overnight | HR, RR |
| Zhu et al. [98, 99] | CEPS | 10 N/A | Lab | 20 Min | HR, RR |
| Fajkus et al. [100] | Peak Detector, FFT | 6 M, 4 F | Lab | N/A | HR, RR |
| Chethana et al. [102] | Visually | 2 M, 2 F | Hospital | 1 Min | HR, RR |
| Nedoma et al. [103] | Peak Detector | 3 M, 3 F | Lab | 60 Min | HR, RR |
N/A not available, M male, F female, HR heart rate, RR respiratory rate, Min minutes, Hrs hours, Sec seconds, BP blood pressure, PPG Sync Photoplethysmography synchronization: STFT short-time Fourier transform, CEPS cepstrum, FFT fast Fourier transform, MRI magnetic resonance imaging, Lab laboratory
To come to an end, we presented in Table 8 some of the most common bed-based sensors that use ballistocardiography technology to monitor sleep as well as vital activities such as heart rate and breathing rate. These devices include Emfit QS, Beddit, Withings, Sleepace Reston, Beautyrest, and Juvo. Besides, we discussed the features associated with every device such as sensor type, interface, outputs, dimensions, power supply, and connectivity.
Table 8.
Examples of consumer bed-based sleep monitoring devices their features including sensor type, interface, outputs, dimensions, power supply, and connectivity
| Emft QS | Beddit | Withings | Sleepace Reston | Beautyrest | Juvo | |
|---|---|---|---|---|---|---|
| Breathing disturbances | ✗ | ✗ | ✓ | ✗ | ✗ | ✗ |
| Heart rate | ✓ | ✓ | ✓ | ✓ | ✓ | ✓ |
| Heart rate variability | ✓ | ✗ | ✗ | ✗ | ✗ | ✗ |
| Respiration | ✓ | ✓ | ✓ | ✓ | ✓ | ✓ |
| Sleep and wake-up time | ✓ | ✓ | ✓ | ✓ | ✓ | ✓ |
| Sleep efficiency | ✗ | ✓ | ✓ | ✗ | ✓ | ✗ |
| Sleep interruptions | ✓ | ✓ | ✓ | ✓ | ✓ | ✓ |
| Sleep score | ✓ | ✗ | ✓ | ✓ | ✓ | ✗ |
| Smart alarm | ✗ | ✓ | ✓ | ✓ | ✓ | ✗ |
| Snoring duration | ✗ | ✓ | ✓ | ✗ | ✗ | ✗ |
| Sleep stages | Deep, light and REM | Light, deep | Deep, light and REM | Light, deep | Deep, light and REM | ✗ |
| Sensor type | Electro mechanical film sensor | Piezoelectric force sensor | Piezoelectric force sensor | Piezoelectric force sensor | Piezoelectric force sensor | Microbend fiber optic |
| Interface | Web application | iOS app | iOS and android apps | iOS and android apps | iOS and android apps | iOS and android apps |
| Connectivity | Wi-Fi | Bluetooth | Bluetooth | Bluetooth | Wi-Fi | Wi-Fi |
| Power | Power adapter | Power adapter | Power adapter | Battery | Power adapter | Power adapter |
| Dimensions | Sensor: 6 56 cm Cable: 1.8 m | Sensor: 780 65 2 mm cable: 2.4 m | Sensor: 637 190 5 mm | Sensor: 34.6 2.6 0.08 in | Sensor: 3.5 3.2 1 in | Sensor: 20 50 0.5 cm |
These sensors are designed and packaged in a way to make them invisible to the subjects. For example, they can be easily integrated into ambient assisted living environments such as beds, pillows, chairs, or even in weighing scales [104]. In general, these sensors technology are preferred than those popular sensors (e.g., ECG) when are considering long-term (trend over time; early detection and intervention by sending alarms to family members or caregivers through well-designed user interfaces), mobile, convenient and cost-effective (aging-in-place; senior activity centers). However, in critical situations, gold-standard methods should be considered.
As we can see in Table 8, most of the existing products implement the piezoelectric technology for nonintrusive monitoring of vital signs (for example, Beddit, Withings, Sleepace Reston, and Beautyrest) which reflects the popularity and suitability of the piezoelectric material for measuring the tiny vibrations generated by the heart movements that is transmitted through the bed mattress. Another famous sleep tracker sensor employing a piezoelectric sensor is EarlySense. The system can report information about heart rate, respiration, snoring, coughing, and movement. A recent study showed a good agreement between EarlySense and the gold standard PSG for sleep staging [105]. Furthermore, the device provided promising results for sleep apnea detection [106].
On the one hand, there are some standard features that these sensors claim to measure such as heart rate, respiration, sleep and wake-up time, and sleep interruptions. There are several publications in the existing literature that can support these claims as we mentioned in previous sections.
On the other hand, insufficient publications are available in existing literature that can support other claims such as sleep efficiency (i.e., the portion of time in bed spent asleep before waking up), sleep score (i.e., summarizes your night’s sleep quality and quantity in a single number, it takes your sleep time, sleep efficiency, restfulness, snoring, and heart rate into account), smart alarm (i.e., to awaken the wearer at an optimal time within a time-window that ends in the final alarm setting) and sleep stages. For example, to get accurate results about the different stages of sleep, the patient should undergo a full-night sleep study or as known as polysomnography.
It seems that Emfit QS is the only device claiming to measure heart rate variability. Similarly, Withings is claiming to measure a breathing disturbance metric that can contribute to identifying abnormal sleep patterns such as apneas. A power supply is required for operating most of these sensors. However, Sleepace Reston is a battery powered. It worth mentioning that these sensors are only designed to monitor a single person overnight. However, the BeautyRest sleep tracker comes with two sensors, so couples can independently track their sleep.
These nonintrusive bed-based systems implemented very complex signals processing algorithms to eliminate motion artifacts, irrelevant heartbeats, and other sources that can degrade the signal’s quality. As a result, in the preceding section, we have provided how the output of bed-based sensors can be analyzed and interpreted to extract relevant physiological information such heart rate, breathing, and body movements for sleep interruptions. We conclude the paper in the next section.
Conclusion
This review provided the definition and the nomenclature of ballistocardiography. Besides, it discussed in detail the different sensing modalities reported in existing literature for nonintrusive monitoring of vital signs, namely heart rate, breathing rate, and body movements. These sensing modalities consisted of piezoelectric polyvinylidene fluoride sensors, electromechanical film sensors, pneumatic sensors, load cells, hydraulic sensors, and fiber-optic sensors. In general, the output of these sensors is a composite signal that is composed of cardiac activities, respiratory activities, and body movements. Hence, these three types of signals should be separated from each other so that vital signs can be measured. The separation process is usually performed by applying a band-pass filter of specific cutoff frequencies according to the signal of interest. In an alternate approach, the separation process can be accomplished by adopting a decomposition algorithm such as empirical mode decomposition algorithm and wavelet multiresolution analysis. It should be noted that vital signs cannot be detected during body movements and hence they should be eliminated before the measurement process. Following the separation process, i.e., obtaining cardiac signals and respiratory signals, several algorithms can then be implemented for the measurement of vital signs. As discussed in the paper, these algorithms include but are not limited to the simple peak detector, autocorrelation function, fast Fourier transform, cepstrum analysis, wavelet multiresolution analysis, empirical mode decomposition, power spectrum analysis, and clustering-based approaches. The clustering-based approaches are not very useful because the training step should be repeated whenever the data collection protocol has been changed. Moreover, the ballistocardiogram morphology varies between and within subjects, and the shape of the signal is highly dependent on the subject’s postures, i.e., sleeping or sitting. Furthermore, the raw signal is noisy and nonstationary due to body movement, induced respiratory efforts, and the characteristics of the sensing system itself. Based on this review, wavelet transform-based methods could be suitable candidates for analyzing bed-based BCG signals due to its adaptive decomposition ability to handle nonlinear and nonstationary signals. Also, it is very appropriate to subtract noise from the BCG signal. At last, to link this review paper with existing technologies, we have summarized some of the consumer BCG bed-based sensors. Additionally, we have briefed their several features and the superiority of one sensor compared to other sensors. To conclude, piezoelectric-based sensors are the most frequently used type of sensors for obtaining BCG bed-based signal.
Compliance with ethical standards
Conflicts of interest
The authors declare that they have no conflict of interest.
Ethical approval
This article does not contain any studies with human participants performed by any of the authors.
Footnotes
Publisher's Note
Springer Nature remains neutral with regard to jurisdictional claims in published maps and institutional affiliations.
Contributor Information
Ibrahim Sadek, Email: ibrahim_sadek@sutd.edu.sg.
Jit Biswas, Email: jit_biswas@sutd.edu.sg.
Bessam Abdulrazak, Email: bessam.abdulrazak@usherbrooke.ca.
References
- 1.Pinheiro E, Postolache O, Girão P. Theory and developments in an unobtrusive cardiovascular system representation: ballistocardiography. Open Biomed Eng J. 2010;4:201. doi: 10.2174/1874120701004010201. [DOI] [PMC free article] [PubMed] [Google Scholar]
- 2.Starr I, Schroeder HA. Ballistocardiogram. II. normal standards, abnormalities commonly found in diseases of the heart and circulation, and their significance. J Clin Investig. 1940;19(3):437. doi: 10.1172/JCI101145. [DOI] [PMC free article] [PubMed] [Google Scholar]
- 3.Starr I, Rawson A, Schroeder H, Joseph N. Studies on the estimation of cardiac output in man, and of abnormalities in cardiac function, from the heart‘s recoil and the blood‘s impacts; the ballistocardiogram. Am J Physiol Leg Content. 1939;127(1):1–28. doi: 10.1152/ajplegacy.1939.127.1.1. [DOI] [Google Scholar]
- 4.Eblen-Zajjur Antonio. A SIMPLE BALLISTOCARDIOGRAPHIC SYSTEM FOR A MEDICAL CARDIOVASCULAR PHYSIOLOGY COURSE. Advances in Physiology Education. 2003;27(4):224–229. doi: 10.1152/advan.00025.2002. [DOI] [PubMed] [Google Scholar]
- 5.Vogt E, MacQuarrie D, Neary JP. Using ballistocardiography to measure cardiac performance: a brief review of its history and future significance. Clin Physiol Funct Imaging. 2012;32(6):415–420. doi: 10.1111/j.1475-097X.2012.01150.x. [DOI] [PubMed] [Google Scholar]
- 6.Giovangrandi L, Inan OT, Wiard RM, Etemadi M, Kovacs GTA. Ballistocardiography—a method worth revisiting. In: 2011 annual international conference of the IEEE engineering in medicine and biology society, 2011. pp. 4279–4282.10.1109/IEMBS.2011.6091062. [DOI] [PMC free article] [PubMed]
- 7.Scarborough WR, Talbot SA, Braunstein JR, Rappaport MB, Dock W, Hamilton W, Smith JE, Nickerson JL, Starr I. Proposals for ballistocardiographic nomenclature and conventions: revised and extended. Circulation. 1956;14(3):435–450. doi: 10.1161/01.CIR.14.3.435. [DOI] [PubMed] [Google Scholar]
- 8.Di Rienzo M, Vaini E, Lombardi P. An algorithm for the beat-to-beat assessment of cardiac mechanics during sleep on earth and in microgravity from the seismocardiogram. Sci Rep. 2017;7(1):15634. doi: 10.1038/s41598-017-15829-0. [DOI] [PMC free article] [PubMed] [Google Scholar]
- 9.Inan OT, Baran Pouyan M, Javaid AQ, Dowling S, Etemadi M, Dorier A, Heller JA, Bicen AO, Roy S, De Marco T, Klein L. Novel wearable seismocardiography and machine learning algorithms can assess clinical status of heart failure patients. Circulation. 2018;11(1). 10.1161/CIRCHEARTFAILURE.117.004313, http://circheartfailure.ahajournals.org/content/11/1/e004313, http://circheartfailure.ahajournals.org/content/11/1/e004313.full.pdf. [DOI] [PMC free article] [PubMed]
- 10.Hall T, Lie D, Nguyen T, Mayeda J, Lie P, Lopez J, Banister R. Non-contact sensor for long-term continuous vital signs monitoring: a review on intelligent phased-array doppler sensor design. Sensors. 2017;17(11):2632. doi: 10.3390/s17112632. [DOI] [PMC free article] [PubMed] [Google Scholar]
- 11.Tadi MJ, Lehtonen E, Saraste A, Tuominen J, Koskinen J, Teräs M, Airaksinen J, Pänkäälä M, Koivisto T. Gyrocardiography: a new non-invasive monitoring method for the assessment of cardiac mechanics and the estimation of hemodynamic variables. Sci Rep. 2017;7(1):6823. doi: 10.1038/s41598-017-07248-y. [DOI] [PMC free article] [PubMed] [Google Scholar]
- 12.Meriheinä U, Juppo M, Koivisto T, Pänäälä M, Sairanen K, Grönholm M. Heart monitoring system. US Patent App. 14/917,350, 2016.
- 13.Sadek I, Biswas J. Nonintrusive heart rate measurement using ballistocardiogram signals: a comparative study. Signal Image Video Process. 2019;13(3):475–482. doi: 10.1007/s11760-018-1372-z. [DOI] [Google Scholar]
- 14.Suliman A, Carlson C, Ade CJ, Warren S, Thompson DE. Performance comparison for ballistocardiogram peak detection methods. IEEE Access. 2019;7:53945–53955. doi: 10.1109/ACCESS.2019.2912650. [DOI] [Google Scholar]
- 15.Sadek I, Biswas J, Abdulrazak B, Haihong Z, Mokhtari M. Continuous and unconstrained vital signs monitoring with ballistocardiogram sensors in headrest position. In: 2017 IEEE EMBS international conference on biomedical health informatics (BHI), pp 289–292, 2017. 10.1109/BHI.2017.7897262.
- 16.Ashouri H, Hersek S, Inan OT. Universal pre-ejection period estimation using seismocardiography: quantifying the effects of sensor placement and regression algorithms. IEEE Sens J. 2018;18(4):1665–1674. doi: 10.1109/JSEN.2017.2787628. [DOI] [PMC free article] [PubMed] [Google Scholar]
- 17.Javaid AQ, Ashouri H, Dorier A, Etemadi M, Heller JA, Roy S, Inan OT. Quantifying and reducing motion artifacts in wearable seismocardiogram measurements during walking to assess left ventricular health. IEEE Trans Biomed Eng. 2017;64(6):1277–1286. doi: 10.1109/TBME.2016.2600945. [DOI] [PMC free article] [PubMed] [Google Scholar]
- 18.Xin Y, Guo C, Qi X, Tian H, Li X, Dai Q, Wang S, Wang C. Wearable and unconstrained systems based on pvdf sensors in physiological signals monitoring: a brief review. Ferroelectrics. 2016;500(1):291–300. doi: 10.1080/00150193.2016.1230440. [DOI] [Google Scholar]
- 19.Hwang SH, Lee HJ, Yoon HN, Jung DW, Lee YJG, Lee YJ, Jeong DU, Park KS. Unconstrained sleep apnea monitoring using polyvinylidene fluoride film-based sensor. IEEE Trans Biomed Eng. 2014;61(7):2125–2134. doi: 10.1109/TBME.2014.2314452. [DOI] [PubMed] [Google Scholar]
- 20.Wang F, Tanaka M, Chonan S. Development of a pvdf piezopolymer sensor for unconstrained in-sleep cardiorespiratory monitoring. J Intell Mater Syst Struct. 2003;14(3):185–190. doi: 10.1177/1045389X03014003006. [DOI] [Google Scholar]
- 21.Wang F, Zou Y, Tanaka M, Matsuda T, Chonan S. Unconstrained cardiorespiratory monitor for premature infants. Int J Appl Electromagn Mech. 2007;25(1–4):469–475. doi: 10.3233/JAE-2007-751. [DOI] [Google Scholar]
- 22.Niizeki K, Nishidate I, Uchida K, Kuwahara M. Unconstrained cardiorespiratory and body movement monitoring system for home care. Med Biol Eng Comput. 2005;43(6):716–724. doi: 10.1007/BF02430948. [DOI] [PubMed] [Google Scholar]
- 23.Paalasmaa J, Ranta M. Detecting heartbeats in the ballistocardiogram with clustering. In: Proceedings of the ICML/UAI/COLT 2008 workshop on machine learning for health-care applications, Helsinki, Finland, vol. 9, 2008.
- 24.Paalasmaa J, Waris M, Toivonen H, Leppäkorpi L, Partinen M. Unobtrusive online monitoring of sleep at home. In: 2012 annual international conference of the IEEE engineering in medicine and biology society, pp. 3784–3788, 2012. 10.1109/EMBC.2012.6346791. [DOI] [PubMed]
- 25.Paalasmaa J, Toivonen H, Partinen M. Adaptive heartbeat modeling for beat-to-beat heart rate measurement in ballistocardiograms. IEEE J Biomed Health Inform. 2015;19(6):1945–1952. doi: 10.1109/JBHI.2014.2314144. [DOI] [PubMed] [Google Scholar]
- 26.Chen W., Zhu X., Nemoto T. IFMBE Proceedings. Berlin, Heidelberg: Springer Berlin Heidelberg; 2009. A New Sensory Device and Optimal Position for Monitoring HR/RR during Sleep; pp. 126–129. [Google Scholar]
- 27.Pinheiro E, Postolache O, Girão P. Study on ballistocardiogram acquisition in a moving wheelchair with embedded sensors. Metrol Meas Syst. 2012;19(4):739–750. doi: 10.2478/v10178-012-0065-0. [DOI] [Google Scholar]
- 28.Kortelainen JM, van Gils M, Pärkkä J, Multichannel bed pressure sensor for sleep monitoring. In: 2012 computing in cardiology, pp. 313–316, 2012.
- 29.Guerrero G, Kortelainen JM, Palacios E, Bianchi AM, Tachino G, Tenhunen M, Méndez MO, van Gils M. Detection of sleep-disordered breating with pressure bed sensor. In: 2013 35th annual international conference of the IEEE engineering in medicine and biology society (EMBC), pp. 1342–1345, 2013. 10.1109/EMBC.2013.6609757. [DOI] [PubMed]
- 30.Brüser C, Kortelainen JM, Winter S, Tenhunen M, Pärkkä J, Leonhardt S. Improvement of force-sensor-based heart rate estimation using multichannel data fusion. IEEE J Biomed Health Inform. 2015;19(1):227–235. doi: 10.1109/JBHI.2014.2311582. [DOI] [PubMed] [Google Scholar]
- 31.Martín-Yebra A, Landreani F, Casellato C, Pavan E, Frigo C, Migeotte PF, Caiani EG. Studying heart rate variability from ballistocardiography acquired by force platform: comparison with conventional ECG. In: 2015 computing in cardiology conference (CinC), pp 929–932, 2015. 10.1109/CIC.2015.7411064.
- 32.Katz Y, Karasik R, Shinar Z. Contact-free piezo electric sensor used for real-time analysis of inter beat interval series. In: 2016 computing in cardiology conference (CinC), pp. 769–772, 2016. 10.23919/CIC.2016.7868856.
- 33.Sela I, Shinar Z, Tavakolian K. Measuring left ventricular ejection time using under-the-mattress sensor. In: 2016 computing in cardiology conference (CinC), pp. 665–668, 2016. 10.23919/CIC.2016.7868830.
- 34.Alvarado-Serrano Carlos, Luna-Lozano Pablo Samuel, Pallàs-Areny Ramon. An algorithm for beat-to-beat heart rate detection from the BCG based on the continuous spline wavelet transform. Biomedical Signal Processing and Control. 2016;27:96–102. doi: 10.1016/j.bspc.2016.02.002. [DOI] [Google Scholar]
- 35.Liu Mengxing, Jiang Feng, Jiang He, Ye Shuming, Chen Hang. Low-power, noninvasive measurement system for wearable ballistocardiography in sitting and standing positions. Computers in Industry. 2017;91:24–32. doi: 10.1016/j.compind.2017.05.005. [DOI] [Google Scholar]
- 36.Choe ST, Cho WD. Simplified real-time heartbeat detection in ballistocardiography using a dispersion-maximum method. Biomed Res. 2017;28(9):3974–3985. [Google Scholar]
- 37.Alametsä J, Värri A, Koivuluoma M, Barna L. The potential of emfi sensors in heart activity monitoring. In: 2nd OpenECG workshop integration of the ECG into the EHR and interoperability of ECG device systems, Berlin, Germany, 2004.
- 38.Koivistoinen T, Junnila S, Varri A, Koobi T. A new method for measuring the ballistocardiogram using emfi sensors in a normal chair. In: The 26th annual international conference of the IEEE engineering in medicine and biology society, vol 1, pp. 2026–2029, 2004. 10.1109/IEMBS.2004.1403596. [DOI] [PubMed]
- 39.Junnila S, Akhbardeh A, Barna LC, Defee I, Varri A. A wireless ballistocardiographic chair. In: 2006 international conference of the IEEE engineering in medicine and biology society, pp. 5932–5935, 2006. 10.1109/IEMBS.2006.259814. [DOI] [PubMed]
- 40.Junnila S, Akhbardeh A, Varri A, Koivistoinen T. An emfi-film sensor based ballistocardiographic chair: performance and cycle extraction method. In: IEEE workshop on signal processing systems design and implementation. 2005;2005:373–7. 10.1109/SIPS.2005.1579896.
- 41.Kortelainen JM, Virkkala J. Fft averaging of multichannel bcg signals from bed mattress sensor to improve estimation of heart beat interval. In: 2007 29th annual international conference of the IEEE engineering in medicine and biology society, pp. 6685–6688, 2007. 10.1109/IEMBS.2007.4353894. [DOI] [PubMed]
- 42.Aubert XL, Brauers A. Estimation of vital signs in bed from a single unobtrusive mechanical sensor: algorithms and real-life evaluation. In: 2008 30th annual international conference of the IEEE engineering in medicine and biology society, pp. 4744–4747, 2008. 10.1109/IEMBS.2008.4650273. [DOI] [PubMed]
- 43.Karki S, Lekkala J. Film-type transducer materials pvdf and emfi in the measurement of heart and respiration rates. In: 2008 30th annual international conference of the IEEE engineering in medicine and biology society, pp. 530–533, 2008. 10.1109/IEMBS.2008.4649207. [DOI] [PubMed]
- 44.Kärki S, Lekkala J. A new method to measure heart rate with emfi and pvdf materials. J Med Eng Technol. 2009;33(7):551–558. doi: 10.1080/03091900903067424. [DOI] [PubMed] [Google Scholar]
- 45.Pinheiro E, Postolache O, Girão P. Blood pressure and heart rate variabilities estimation using ballistocardiography. In: Proceedings of the 7th conference on telecom, pp. 125–128, 2009.
- 46.Pinheiro EC, Postolache OA, Girão PS. Online heart rate estimation in unstable ballistocardiographic records. In: 2010 annual international conference of the IEEE engineering in medicine and biology, pp. 939–942, 2010. 10.1109/IEMBS.2010.5627539. [DOI] [PubMed]
- 47.Brüser C, Winter S, Leonhardt S. Robust inter-beat interval estimation in cardiac vibration signals. Physiological Measurement. 2013;34(2):123–138. doi: 10.1088/0967-3334/34/2/123. [DOI] [PubMed] [Google Scholar]
- 48.Zink Matthias Daniel, Brüser Christoph, Winnersbach Patrick, Napp Andreas, Leonhardt Steffen, Marx Nikolaus, Schauerte Patrick, Mischke Karl. Heartbeat Cycle Length Detection by a Ballistocardiographic Sensor in Atrial Fibrillation and Sinus Rhythm. BioMed Research International. 2015;2015:1–10. doi: 10.1155/2015/840356. [DOI] [PMC free article] [PubMed] [Google Scholar]
- 49.Zink MD, Brüser C, Stüben BO, Napp A, Stöhr R, Leonhardt S, Marx N, Mischke K, Schulz JB, Schiefer J. Unobtrusive nocturnal heartbeat monitoring by a ballistocardiographic sensor in patients with sleep disordered breathing. Sci Rep. 2017;7(1):13175. doi: 10.1038/s41598-017-13138-0. [DOI] [PMC free article] [PubMed] [Google Scholar]
- 50.Pino EJ, Chávez JAP, Aqueveque P, Noninvasive ambulatory measurement system of cardiac activity. In: 2015 37th annual international conference of the IEEE engineering in medicine and biology society (EMBC), pp. 7622–7625, 2015. 10.1109/EMBC.2015.7320157. [DOI] [PubMed]
- 51.Pino EJ, Larsen C, Chavez J, Aqueveque P. Non-invasive bcg monitoring for non-traditional settings. In: 2016 38th annual international conference of the IEEE engineering in medicine and biology society (EMBC), pp. 4776–4779, 2016. 10.1109/EMBC.2016.7591795. [DOI] [PubMed]
- 52.Alametsä Jarmo, Viik Jari. EMBEC & NBC 2017. Singapore: Springer Singapore; 2017. Twelve Years Follow-up of Ballistocardiography; pp. 1117–1120. [Google Scholar]
- 53.Chow Patrick, Nagendra Gangadharan, Abisheganaden John, Wang Y T. Respiratory monitoring using an air-mattress system. Physiological Measurement. 2000;21(3):345–354. doi: 10.1088/0967-3334/21/3/301. [DOI] [PubMed] [Google Scholar]
- 54.Watanabe T, Watanabe K. Noncontact method for sleep stage estimation. IEEE Trans Biomed Eng. 2004;51(10):1735–1748. doi: 10.1109/TBME.2004.828037. [DOI] [PubMed] [Google Scholar]
- 55.Watanabe K, Watanabe T, Watanabe H, Ando H, Ishikawa T, Kobayashi K. Noninvasive measurement of heartbeat, respiration, snoring and body movements of a subject in bed via a pneumatic method. IEEE Trans Biomed Eng. 2005;52(12):2100–2107. doi: 10.1109/TBME.2005.857637. [DOI] [PubMed] [Google Scholar]
- 56.Kurihara Y, Watanabe K. Development of unconstrained heartbeat and respiration measurement system with pneumatic flow. IEEE Trans Biomed Circuits Syst. 2012;6(6):596–604. doi: 10.1109/TBCAS.2012.2189007. [DOI] [PubMed] [Google Scholar]
- 57.Chee Yongjoon, Han Jooman, Youn Jaewoong, Park Kwangsuk. Air mattress sensor system with balancing tube for unconstrained measurement of respiration and heart beat movements. Physiological Measurement. 2005;26(4):413–422. doi: 10.1088/0967-3334/26/4/007. [DOI] [PubMed] [Google Scholar]
- 58.Shin J, Chee Y, Park K. Long-term sleep monitoring system and long-term sleep parameters using unconstrained method. In: International special topic conference on information technology in BME, Ioannina-Epirus, Greece, 2006.
- 59.Shin JH, Chee YJ, Jeong DU, Park KS. Nonconstrained sleep monitoring system and algorithms using air-mattress with balancing tube method. IEEE Trans Inform Technol Biomed. 2010;14(1):147–156. doi: 10.1109/TITB.2009.2034011. [DOI] [PubMed] [Google Scholar]
- 60.Brink M, Müller CH, Schierz C. Contact-free measurement of heart rate, respiration rate, and body movements during sleep. Behav Res Methods 2006;38(3):511–21. 10.3758/BF03192806, 10.3758/BF03192806. [DOI] [PubMed]
- 61.Inan O T, Etemadi M, Wiard R M, Giovangrandi L, Kovacs G T A. Robust ballistocardiogram acquisition for home monitoring. Physiological Measurement. 2009;30(2):169–185. doi: 10.1088/0967-3334/30/2/005. [DOI] [PubMed] [Google Scholar]
- 62.Inan OT, Etemadi M, Widrow B, Kovacs GTA. Adaptive cancellation of floor vibrations in standing ballistocardiogram measurements using a seismic sensor as a noise reference. IEEE Trans Biomed Eng. 2010;57(3):722–727. doi: 10.1109/TBME.2009.2018831. [DOI] [PubMed] [Google Scholar]
- 63.Inan OT, Kovacs GTA, Giovangrandi L. Evaluating the lower-body electromyogram signal acquired from the feet as a noise reference for standing ballistocardiogram measurements. IEEE Trans Inform Technol Biomed. 2010;14(5):1188–1196. doi: 10.1109/TITB.2010.2044185. [DOI] [PubMed] [Google Scholar]
- 64.Wiard RM, Inan OT, Argyres B, Etemadi M, Kovacs GTA, Giovangrandi L. Automatic detection of motion artifacts in the ballistocardiogram measured on a modified bathroom scale. Med Biol Eng Comput. 2011;49(2):213–220. doi: 10.1007/s11517-010-0722-y. [DOI] [PubMed] [Google Scholar]
- 65.Bruser C, Stadlthanner K, de Waele S, Leonhardt S. Adaptive beat-to-beat heart rate estimation in ballistocardiograms. IEEE Trans Inform Technol Biomed. 2011;15(5):778–786. doi: 10.1109/TITB.2011.2128337. [DOI] [PubMed] [Google Scholar]
- 66.Nukaya S, Shino T, Kurihara Y, Watanabe K, Tanaka H. Noninvasive bed sensing of human biosignals via piezoceramic devices sandwiched between the floor and bed. IEEE Sens J. 2012;12(3):431–438. doi: 10.1109/JSEN.2010.2091681. [DOI] [Google Scholar]
- 67.Vehkaoja A, Rajala S, Kumpulainen P, Lekkala J. Correlation approach for the detection of the heartbeat intervals using force sensors placed under the bed posts. J Med Eng Technol. 2013;37(5):327–333. doi: 10.3109/03091902.2013.807523. [DOI] [PubMed] [Google Scholar]
- 68.Lee WK, Yoon H, Han C, Joo KM, Park KS. Physiological signal monitoring bed for infants based on load-cell sensors. Sensors. 2016;16(3):409. doi: 10.3390/s16030409. [DOI] [PMC free article] [PubMed] [Google Scholar]
- 69.Heise D, Rosales L, Skubic M, Devaney MJ. Refinement and evaluation of a hydraulic bed sensor. In: 2011 annual international conference of the IEEE engineering in medicine and biology society, pp. 4356–4360, 2011. 10.1109/IEMBS.2011.6091081. [DOI] [PMC free article] [PubMed]
- 70.Heise D, Skubic M. Monitoring pulse and respiration with a non-invasive hydraulic bed sensor. In: 2010 annual international conference of the IEEE engineering in medicine and biology, pp. 2119–2123, 2010. 10.1109/IEMBS.2010.5627219. [DOI] [PubMed]
- 71.Rosales L, Skubic M, Heise D, Devaney MJ, Schaumburg M. Heartbeat detection from a hydraulic bed sensor using a clustering approach. In: 2012 annual international conference of the IEEE engineering in medicine and biology society, pp. 2383–2387, 2012. 10.1109/EMBC.2012.6346443. [DOI] [PubMed]
- 72.Su BY, Ho KC, Skubic M, Rosales L. Pulse rate estimation using hydraulic bed sensor. In: 2012 annual international conference of the IEEE engineering in medicine and biology society, pp. 2587–2590, 2012. 10.1109/EMBC.2012.6346493. [DOI] [PubMed]
- 73.Heise D, Rosales L, Sheahen M, Su BY, Skubic M. Non-invasive measurement of heartbeat with a hydraulic bed sensor progress, challenges, and opportunities. In: 2013 IEEE international instrumentation and measurement technology conference (I2MTC), pp. 397–402, 2013. 10.1109/I2MTC.2013.6555447.
- 74.Lydon K, Su BY, Rosales L, Enayati M, Ho KC, Rantz M, Skubic M. Robust heartbeat detection from in-home ballistocardiogram signals of older adults using a bed sensor. In: 2015 37th annual international conference of the IEEE engineering in medicine and biology society (EMBC), pp. 7175–7179, 2015. 10.1109/EMBC.2015.7320047. [DOI] [PubMed]
- 75.Jiao C, Lyons P, Zare A, Rosales L, Skubic M. Heart beat characterization from ballistocardiogram signals using extended functions of multiple instances. In: 2016 38th annual international conference of the IEEE engineering in medicine and biology society (EMBC), pp. 756–760, 2016. 10.1109/EMBC.2016.7590812. [DOI] [PubMed]
- 76.Rosales L, Su BY, Skubic M, Ho K. Heart rate monitoring using hydraulic bed sensor ballistocardiogram. J Ambient Intell Smart Environ. 2017;9(2):193–207. doi: 10.3233/AIS-170423. [DOI] [Google Scholar]
- 77.Berthold JW. Historical review of microbend fiber-optic sensors. J Lightwave Technol. 1995;13(7):1193–1199. doi: 10.1109/50.400697. [DOI] [Google Scholar]
- 78.Hu Hai-feng, Sun Si-jia, Lv Ri-qing, Zhao Yong. Design and experiment of an optical fiber micro bend sensor for respiration monitoring. Sensors and Actuators A: Physical. 2016;251:126–133. doi: 10.1016/j.sna.2016.10.013. [DOI] [Google Scholar]
- 79.Lagakos Nicholas, Cole J. H., Bucaro J. A. Microbend fiber-optic sensor. Applied Optics. 1987;26(11):2171. doi: 10.1364/AO.26.002171. [DOI] [PubMed] [Google Scholar]
- 80.Luo Fei, Liu Jingyuan, Ma Naibing, Morse T.F. A fiber optic microbend sensor for distributed sensing application in the structural strain monitoring. Sensors and Actuators A: Physical. 1999;75(1):41–44. doi: 10.1016/S0924-4247(99)00043-6. [DOI] [Google Scholar]
- 81.Moghadas Amin A., Shadaram Mehdi. Fiber Bragg Grating Sensor for Fault Detection in Radial and Network Transmission Lines. Sensors. 2010;10(10):9407–9423. doi: 10.3390/s101009407. [DOI] [PMC free article] [PubMed] [Google Scholar]
- 82.Poeggel Sven, Tosi Daniele, Duraibabu DineshBabu, Leen Gabriel, McGrath Deirdre, Lewis Elfed. Optical Fibre Pressure Sensors in Medical Applications. Sensors. 2015;15(7):17115–17148. doi: 10.3390/s150717115. [DOI] [PMC free article] [PubMed] [Google Scholar]
- 83.Díaz CA, Leitão C, Marques CA, Domingues MF, Alberto N, Pontes MJ, Frizera A, Ribeiro M, André PS, Antunes PF. Low-cost interrogation technique for dynamic measurements with fbg-based devices. Sensors. 2017;17(10):2414. doi: 10.3390/s17102414. [DOI] [PMC free article] [PubMed] [Google Scholar]
- 84.Sadek I, Mohktari M. Nonintrusive remote monitoring of sleep in home-based situation. J Med Syst. 2018;42(4):64. doi: 10.1007/s10916-018-0917-6. [DOI] [PubMed] [Google Scholar]
- 85.Chen Z, Teo JT, Ng SH, Yang X. Portable fiber optic ballistocardiogram sensor for home use. In: Proceedings of SPIE, vol 8218, pp 8218- 8218-7, 2012. 10.1117/12.909768.
- 86.Chen Z, Teo JT, Yang X. In-bed fibre optic breathing and movement sensor for non-intrusive monitoring. In: Proceeding of SPIE, vol 7173, pp. 7173–7173-6, 2009. 10.1117/12.807924.
- 87.Deepu CJ, Chen Z, Teo JT, Ng SH, Yang X, Lian Y. A smart cushion for real-time heart rate monitoring. In: 2012 IEEE biomedical circuits and systems conference (BioCAS), pp. 53–56, 2012. 10.1109/BioCAS.2012.6418512.
- 88.Chen Z, Yang X, Teo JT, Ng SH. Noninvasive monitoring of blood pressure using optical ballistocardiography and photoplethysmograph approaches. In: 2013 35th annual international conference of the IEEE engineering in medicine and biology society (EMBC), pp 2425–2428, 2013. 10.1109/EMBC.2013.6610029. [DOI] [PubMed]
- 89.Lau D, Chen Z, Teo JT, Ng SH, Rumpel H, Lian Y, Yang H, Kei PL. Intensity-modulated microbend fiber optic sensor for respiratory monitoring and gating during MRI. IEEE Trans Biomed Eng. 2013;60(9):2655–2662. doi: 10.1109/TBME.2013.2262150. [DOI] [PubMed] [Google Scholar]
- 90.Chen Z, Lau D, Teo JT, Ng SH, Yang X, Kei PL. Simultaneous measurement of breathing rate and heart rate using a microbend multimode fiber optic sensor. J Biomed Opt. 2014;19(5):057001. doi: 10.1117/1.JBO.19.5.057001. [DOI] [PubMed] [Google Scholar]
- 91.Dziuda Ł, Krej M, Skibniewski FW. Fiber bragg grating strain sensor incorporated to monitor patient vital signs during MRI. IEEE Sens J. 2013;13(12):4986–4991. doi: 10.1109/JSEN.2013.2279160. [DOI] [Google Scholar]
- 92.Dziuda Łukasz, Skibniewski Franciszek W. A new approach to ballistocardiographic measurements using fibre Bragg grating-based sensors. Biocybernetics and Biomedical Engineering. 2014;34(2):101–116. doi: 10.1016/j.bbe.2014.02.001. [DOI] [Google Scholar]
- 93.Dziuda Ł, Skibniewski FW, Krej M, Baran PM. Fiber bragg grating-based sensor for monitoring respiration and heart activity during magnetic resonance imaging examinations. J Biomed Opt. 2013;18(5):57006. doi: 10.1117/1.JBO.18.5.057006. [DOI] [PubMed] [Google Scholar]
- 94.Dziuda Lukasz. Fiber-optic sensors for monitoring patient physiological parameters: a review of applicable technologies and relevance to use during magnetic resonance imaging procedures. Journal of Biomedical Optics. 2015;20(1):010901. doi: 10.1117/1.JBO.20.1.010901. [DOI] [PubMed] [Google Scholar]
- 95.Krej M, Dziuda Ł, Skibniewski FW. A method of detecting heartbeat locations in the ballistocardiographic signal from the fiber-optic vital signs sensor. IEEE J Biomed Health Inform. 2015;19(4):1443–1450. doi: 10.1109/JBHI.2015.2392796. [DOI] [PubMed] [Google Scholar]
- 96.Zhu Y, Zhang H, Jayachandran M, Ng AK, Biswas J, Chen Z. Ballistocardiography with fiber optic sensor in headrest position: A feasibility study and a new processing algorithm. In: 2013 35th annual international conference of the IEEE engineering in medicine and biology society (EMBC), pp 5203–5206, 2013. 10.1109/EMBC.2013.6610721. [DOI] [PubMed]
- 97.Chen Z, Teo JT, Ng SH, Yang X, Zhou B, Zhang Y, Loo HP, Zhang H, Thong M. Monitoring respiration and cardiac activity during sleep using microbend fiber sensor: a clinical study and new algorithm. In: 2014 36th annual international conference of the IEEE engineering in medicine and biology society, pp. 5377–5380, 2014. 10.1109/EMBC.2014.6944841. [DOI] [PubMed]
- 98.Zhu Y, Fook VFS, Jianzhong EH, Maniyeri J, Guan C, Zhang H, Jiliang EP, Biswas J. Heart rate estimation from fbg sensors using cepstrum analysis and sensor fusion. In: 2014 36th annual international conference of the IEEE engineering in medicine and biology society, pp. 5365–5368, 2014. 10.1109/EMBC.2014.6944838. [DOI] [PubMed]
- 99.Zhu Y, Maniyeri J, Fook VFS, Zhang H. Estimating respiratory rate from fbg optical sensors by using signal quality measurement. In: 2015 37th annual international conference of the IEEE engineering in medicine and biology society (EMBC), pp. 853–856, 2015. 10.1109/EMBC.2015.7318496. [DOI] [PubMed]
- 100.Fajkus M, Nedoma J, Martinek R, Vasinek V, Nazeran H, Siska P. A non-invasive multichannel hybrid fiber-optic sensor system for vital sign monitoring. Sensors. 2017;17(1):111. doi: 10.3390/s17010111. [DOI] [PMC free article] [PubMed] [Google Scholar]
- 101.Fajkus M, Nedoma J, Martinek R, Walendziuk W. Comparison of the fbg sensor encapsulated into pdms and fbg sensor glued on the plexiglass pad for respiratory and heart rate monitoring. In: Photonics applications in astronomy, communications, industry, and high energy physics experiments 2017, International Society for Optics and Photonics, vol 10445, p. 104450B, 2017.
- 102.Chethana K, Guru Prasad A, Omkar S, Asokan S. Fiber bragg grating sensor based device for simultaneous measurement of respiratory and cardiac activities. J Biophotonics. 2017;10(2):278–285. doi: 10.1002/jbio.201500268. [DOI] [PubMed] [Google Scholar]
- 103.Nedoma J, Fajkus M, Martinek R, Kepak S, Cubik J, Zabka S, Vasinek V. Comparison of bcg, pcg and ecg signals in application of heart rate monitoring of the human body. In: 40th international conference on telecommunications and signal processing (TSP), 2017. IEEE, pp. 420–424, 2017.
- 104.Zaunseder S, Henning A, Wedekind D, Trumpp A, Malberg H. Unobtrusive acquisition of cardiorespiratory signals. Somnologie. 2017;21(2):93–100. doi: 10.1007/s11818-017-0112-x. [DOI] [Google Scholar]
- 105.Tal A, Shinar Z, Shaki D, Codish S, Goldbart A. Validation of contact-free sleep monitoring device with comparison to polysomnography. J Clin Sleep Med. 2017;13(3):517–522. doi: 10.5664/jcsm.6514. [DOI] [PMC free article] [PubMed] [Google Scholar]
- 106.Davidovich MLY, Karasik R, Tal A, Shinar Z. Sleep apnea screening with a contact-free under-the-mattress sensor. In: 2016 computing in cardiology conference (CinC), pp. 849–852, 2016. 10.23919/CIC.2016.7868876.