Abstract
The aim of the present study was to identify novel microRNA (miRNA) or long noncoding RNA (lncRNA) signatures of laryngeal cancer recurrence and to investigate the regulatory mechanisms associated with this malignancy. Datasets of recurrent and nonrecurrent laryngeal cancer samples were downloaded from The Cancer Genome Atlas (TCGA) and the Gene Expression Omnibus database (GSE27020 and GSE25727) to examine differentially expressed miRNAs (DE-miRs), lncRNAs (DE-lncRs) and mRNAs (DEGs). miRNA-mRNA and lncRNA-miRNA networks were constructed by investigating the associations among these RNAs in various databases. Subsequently, the interactions identified were combined into a competing endogenous RNA (ceRNA) regulatory network. Feature genes in the miRNA-mRNA network were identified via topological analysis and a recursive feature elimination algorithm. A support vector machine (SVM) classifier was established using the betweenness centrality values in the miRNA-mRNA network, consisting of 32 optimal feature-coding genes. The classification effect was tested using two validation datasets. Furthermore, coding genes in the ceRNA network were examined via pathway enrichment analyses. In total, 21 DE-lncRs, 507 DEGs and 55 DE-miRs were selected. The SVM classifier exhibited an accuracy of 94.05% (79/84) for sample classification prediction in the TCGA dataset, and 92.66 and 91.07% in the two validation datasets. The ceRNA regulatory network comprised 203 nodes, corresponding to mRNAs, miRNAs and lncRNAs, and 346 lines, corresponding to the interactions among RNAs. In particular, the interactions with the highest scores were HLA complex group 4 (HCG4)-miR-33b, HOX transcript antisense RNA (HOTAIR)-miR-1-MAGE family member A2 (MAGEA2), EMX2 opposite strand/antisense RNA (EMX2OS)-miR-124-calcitonin related polypeptide α (CALCA) and EMX2OS-miR-124-γ-aminobutyric acid type A receptor γ2 subunit (GABRG2). Gene enrichment analysis of the genes in the ceRNA network identified that 11 pathway terms and 16 molecular function terms were significantly enriched. The SVM classifier based on 32 feature coding genes exhibited high accuracy in the classification of laryngeal cancer samples. miR-1, miR-33b, miR-124, HOTAIR, HCG4 and EMX2OS may be novel biomarkers of recurrent laryngeal cancer, and HCG4-miR-33b, HOTAIR-miR-1-MAGEA2 and EMX2OS-miR-124-CALCA/GABRG2 may be associated with the molecular mechanisms regulating recurrent laryngeal cancer.
Keywords: laryngeal cancer, regulatory network, long noncoding RNA, competing endogenous RNA, recurrence
Introduction
Laryngeal cancer is the commonest cancer in the larynx. Squamous cell carcinoma is the predominant physiological type of laryngeal cancer, as it originates from the glottic region of the larynx. At present, to the best of the authors' knowledge, effective treatment for laryngeal squamous cell carcinoma (LSCC) primarily relies on radiotherapy and surgery. Tobacco and alcohol consumption are the principal risk factors for the development of laryngeal cancer (1). The annual incidence of laryngeal cancer is ~5 per 100,000 individuals and the 5-year survival rate is 60.6% in the USA (2,3). It was estimates that 23,400 new cases of laryngeal cancer occurred in China in 2014 (4).
Patients with upper-airway malignancies exhibit an increased risk of developing locoregional cancer recurrence and second primary malignancies, and the larynx and nasopharynx are among the most frequent sites of locoregional cancer recurrence (5,6). Although the available therapeutic strategies exhibit promising results, the clinical outcomes of patients with LSCC remain poor (4). Understanding of the pathogenesis of the disease may contribute to the development of novel and more effective therapeutic strategies. Numerous studies have aimed to investigate the molecular mechanisms underlying laryngeal cancer development (7–9). Cell cycle proteins have been identified to serve important roles in the carcinogenesis of laryngeal cancer, and the upregulation of cellular tumor antigen p53 (p53), p21 and cyclin dependent kinase 1 in the surgical margin of early cancer is associated with local tumor recurrence (10). Recurrence rates in patients with p27- and phosphatase and tensin homolog (PTEN)-negative carcinoma were identified to be increased compared with patients with increased expression levels of these factors (11).
Multiple types of RNA, including long noncoding RNAs (lncRNAs), circular RNAs, microRNAs (miRNAs), pseudogenes and protein-coding mRNAs may serve as key competing endogenous RNAs (ceRNAs) to regulate the expression levels of various mRNAs in mammalian cells (12,13). miR-196a may promote tumor progression in numerous cancer types, and its expression level was identified to be increased in laryngeal cancer (14). miR-221 may increase the cell proliferation rate by inhibiting apoptotic protease activating factor-1 in laryngeal cancer (15), whereas miRNA-299-3p targets the transcript of human telomerase reverse transcriptase (16). NF-κB-interacting lncRNA was identified to inhibit tumor cell viability and to promote apoptosis (17). A previous study analyzed an lncRNA expression dataset from the Gene Expression Omnibus (GEO) database, and identified that two lncRNAs, RP11-169K16.4 and RP11-107E5.3, were associated with the prediction of recurrence of laryngeal cancer (18).
Although various previous studies have investigated the molecular mechanisms underlying laryngeal cancer, the etiology of this malignancy, and in particular of its recurrence, remains unclear. Notably, the regulatory interactions among noncoding and coding RNAs is only partially understood. The present study investigated novel potential molecular biomarkers involved in the recurrence of laryngeal cancer by constructing a ceRNA regulatory network consisting of miRNAs, lncRNAs and mRNAs.
Materials and methods
Training and validation datasets and data processing
Head and neck squamous cell carcinoma (HNSCC) mRNA samples were downloaded from The Cancer Genome Atlas (TCGA) database (https://gdc-portal.nci.nih.gov/) on August 8th, 2016. The samples of laryngeal cancer were selected according to the following criteria: i) Laryngeal origin; ii) recurrence status was recorded; and iii) matched mRNAs and miRNAs were barcoded. In total, 84 primary laryngeal cancer samples, including 19 recurrent and 65 nonrecurrent samples, were selected from 501 HNSCC tissues. The training dataset was constructed using the RNA sequencing (RNA-seq) data downloaded from the TCGA database.
The gene expression datasets GSE27020 and GSE25727 were downloaded from the GEO database (https://www.ncbi.nlm.nih.gov/geo/) and used as validation datasets. GSE27020 dataset was obtained using the GPL96 platform (Affymetrix human genome U133A array; Affymetrix, Inc.; Thermo Fisher Scientific, Inc., Waltham, MA, USA) and included 34 recurrent and 75 non-recurrent samples. Patients included in this dataset exhibited primary squamous cell laryngeal carcinoma and underwent surgical tumor removal (19). The raw data of this dataset in CIMFast Event Language format were downloaded and processed with gene expression background correction and were normalized using the oligo package version 1.46.0 (http://www.bioconductor.org/packages/release/bioc/html/oligo.html) in R (version 3.1.0; R Foundation, Vienna, Austria; https://www.R project.org/) (20). GSE25727 dataset was generated using the GPL8432 Illumina platform (Illumina, Inc., San Diego, CA, USA) and included 17 recurrent and 39 non-recurrent samples. All the patients were treated locally with surgery or radiotherapy, and none of them received chemotherapy (21). The data from this dataset were downloaded as text files, and the probe identification numbers were converted into gene symbols. In the case of multiple probes corresponding to one gene, the average value was considered as the expression value of this gene using the limma package 3.22.1 (22).
Analysis of differentially expressed lncRNAs, mRNAs and miRNAs
In the training dataset, the mRNAs and lncRNAs were annotated based on the information recorded in the HUGO Gene Nomenclature Committee (http://www.genenames.org/) database. Subsequently, the differentially expressed RNAs, including differentially expressed mRNAs (DEGs), differentially expressed lncRNAs (DE-lncRs) and differentially expressed miRNAs (DE-miRs), between recurrent and nonrecurrent laryngeal cancer samples were analyzed using the EdgeR package version 3.8.5, which adopted an overdispersed Poisson model and an empirical Bayesian approach to improve the reliability of the prediction (23). The thresholds for DEG and DE-lncR selection were based on a false discovery rate (FDR; adjusted P-value) <0.05, whereas for DE-miRs, P<0.05 was considered to indicate a statistically significant difference. Hierarchical cluster analysis was used to analyze sample similarity.
Analysis DE-lncRs associated with recurrence
Samples in the training dataset were classified into recurrent and nonrecurrent groups. The DE-lncRs that were significantly differentially expressed between recurrent and nonrecurrent samples were used to perform univariate Cox regression analysis, which was used to select the lncRNAs associated with recurrence. Kaplan-Meier analysis was performed to examine the association between the upregulated or downregulated lncRNAs, and recurrence and survival status.
Prediction of miRNA-regulated lncRNAs and mRNAs
The regulatory interactions among miRNAs and lncRNAs were investigated using the miRcode (http://www.mircode.org/) and starBase (http://starbase.sysu.edu.cn/) databases. All miRNA-regulated mRNAs were collected from the miRTarBase (http://mirtarbase.mbc.nctu.edu.tw) database. Associations among coding genes were examined using BioGRID (http://thebiogrid.org/), HPRD (http://www.hprd.org/) and DIP (http://dip.doe-mbi.ucla.edu/) databases.
The identified DE-lncRs, DEGs and DE-miRs between recurrent and nonrecurrent samples were included in these regulatory interactions to obtain the lncRNA-miRNA and miRNA-mRNA regulatory networks. These two networks were combined to construct the ceRNA regulatory network, containing the associations among lncRNAs, miRNAs and mRNAs. The ceRNA regulatory network was constructed to investigate the regulatory mechanism underlying the associations among various RNAs. The network was visualized using Cytoscape software version 3.6.1 (24).
Analysis of feature coding genes in the miRNA-mRNA regulatory network
Topological structure analysis was conducted to identify the feature coding genes in the miRNA-mRNA network. The betweenness centrality (BC) of genes, corresponding to the importance of a certain node, or gene, in the network, was calculated using the following formula (25):
Where v, s and t represent the nodes in the network, σst is the number of shortest paths from s to t, and σst (v) is the number of shortest paths from s to t, going through node v. BC values exhibited a range between 0 and 1, and the BC value was correlated with the importance of that node in the network. Therefore, the nodes exhibiting interactions with numerous mRNAs, miRNAs or lncRNAs, were more important in the construction of the network.
The DEGs in the miRNA-mRNA network presenting the 100 highest BC values were selected as candidate feature-coding genes.
Construction of a support vector machine (SVM) classifier for various samples
The candidate genes that were significantly differentially expressed between recurrent and nonrecurrent samples were selected, and the unsupervised clustering classification method was used to validate the sample classification performance of these feature-coding genes (26). The 100 DEGs exhibiting the highest BC values were used to identify the optimal feature-coding gene set using the recursive feature elimination (RFE) algorithm (27). Through the iterative random feature combination, classification assessment and determination of the performance of various samples (28), the optimal feature-coding gene set was obtained. Subsequently, the set of optimal feature-coding genes was used to construct an SVM classifier, which considered the expression levels of the feature genes within the samples as the feature value to classify and distinguish the samples. The recurrence status of the samples was predicted using the SVM classifier.
The robustness of the classifier were validated using the GSE27020 and GSE25727 datasets. The classification performance was evaluated using sensitivity (Se), specificity (Sp), positive predictive value (PPV), negative predictive value (NPV) and area under the receiver operating characteristic curve (AUC).
Molecular function and pathway enrichment analysis
The candidate feature coding genes selected from the ceRNA network were analyzed using Gene Ontology (GO) and Kyoto Encyclopedia of Genes and Genomes (KEGG) (29) to investigate the enriched molecular functions and signaling pathways in recurrent laryngeal cancer. Fisher's exact test (Fisher's noncentral hypergeometric distribution) was used to perform the enrichment analysis with the following formula (30):
Where ‘N’ is the total number of genes, ‘M’ is the number of genes in the enriched pathway, ‘K’ is the number of DEGs, and ‘p’ is the probability that at least one DEG belongs to the functional pathway. Multiple hypothesis testing correction was used to identify the categories of GO molecular functions and KEGG pathways.
Results
Screening of DE-lncRs, DEGs and DE-miRs
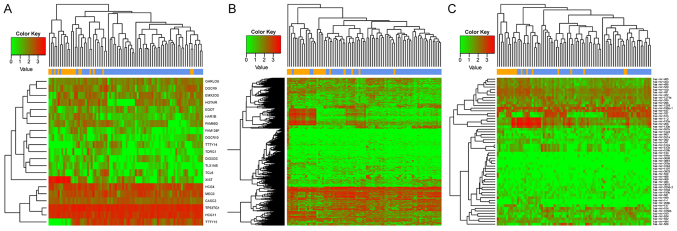
Using the aforementioned methods for the analysis of the RNA-seq data from the TCGA database, 853 lncRNAs, 18,924 mRNAs and 1,047 human miRNAs were identified. A total of 21 DE-lncRs and 507 DEGs were identified between recurrent and nonrecurrent samples (FDR<0.05). In addition, 55 DE-miRs were identified (P<0.05). The results of the heat maps constructed for DEGs, DE-lncRs and DE-miRs suggested that the differentially expressed RNAs clustered according to the two sample types (Fig. 1). Numerous DEGs (507) were identified between recurrent and nonrecurrent samples.
Figure 1.
Heat map of DE-lncRNAs, DEGs and DE-miRNAs in recurrent and nonrecurrent laryngeal cancer samples. Heat map corresponding to (A) DE-lncRNAs, (B) DEGs and (C) DE-miRNAs. Yellow represents recurrent samples and blue represents nonrecurrent samples. Red indicates upregulated genes and green indicates downregulated genes. DE, differentially expressed; lncRNAs, long noncoding RNAs; DEGs, differentially expressed coding genes; miRNAs, microRNAs.
DE-lncRs associated with recurrence
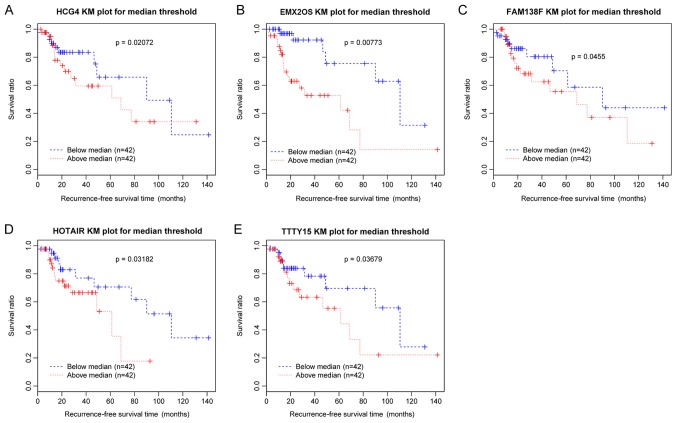
Following the selection of DE-lncRs between recurrent and nonrecurrent samples, univariate Cox regression analysis was performed to identify the lncRNAs associated with recurrence. In total, five DE-lncRs, including testis-specific transcript, Y-linked 15 (TTTY15), EMX2 opposite strand/antisense RNA (EMX2OS), family with sequence similarity 138 member F, human leukocyte antigen complex group 4 (HCG4) and HOX transcript Antisense RNA (HOTAIR), were identified to be significantly associated with recurrence-free survival time and survival ratio (P<0.05). Survival analysis was conducted and the Kaplan-Meier survival curves (Fig. 2) suggested that the increased expression levels of the five DE-lncRs were associated with poor prognosis.
Figure 2.
KM survival curves for five differentially expressed lncRNAs associated with laryngeal cancer recurrence. Blue curves represent samples with downregulated lncRNAs, and red curves represent samples with upregulated lncRNAs. KM curves corresponding to (A) HCG4, (B) EMX2OS, (C) FAM138F, (D) HOTAIR and (E) TTTY15. KM, Kaplan-Meier; HCG4, HLA complex group 4; EMX2OS, EMX2 opposite strand/antisense RNA; FAM138F, family with sequence similarity 138 member F; HOTAIR, HOX transcript antisense RNA; TTTY15, testis-specific transcript, Y-linked 15; lncRNA, long noncoding RNA.
lncRNA-miRNA, miRNA-mRNA and mRNA-mRNA regulatory networks
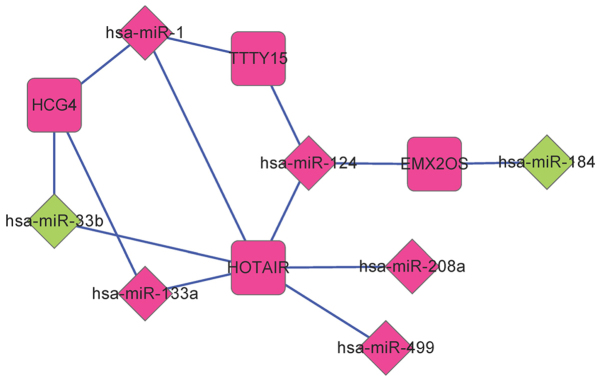
By investigating the miRcode and starBase databases, a total of 268 lncRNA-miRNA regulatory interactions were screened. Among these 268 interactions, 14 interactions were present among DE-miRs and DE-lncRNAs. This lncRNA-miRNA regulatory network comprised four DE-lncRs associated with recurrence and seven DE-miRs (Fig. 3).
Figure 3.
Regulatory network of differentially expressed miR-lncRNA. Diamonds represent miRs and squares represent lncRNAs. Green represents downregulated genes and pink represents upregulated genes. HCG4, HLA complex group 4; HOTAIR, HOX transcript antisense RNA; TTTY15, testis-specific transcript, Y-linked 15; lncRNA, long noncoding RNA; miR, microRNA.
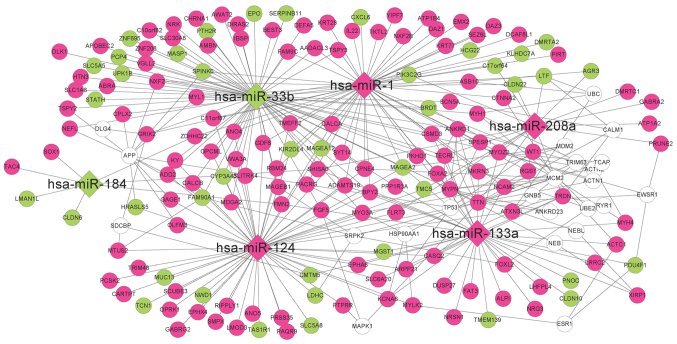
According to the information in the miRTarBase database, the DEGs regulated by the seven DE-miRs were investigated. A total of 55, 59, 34, 7, 17, 69 and 0 interacting DEGs were reported for hsa-miR-1, hsa-miR-124, hsa-miR-133a, hsa-miR-184, hsa-miR-208a, hsa-miR-33b and hsa-miR-499, respectively. Therefore, an miRNA-mRNA regulatory network was established comprising six miRNAs and 193 mRNAs (Fig. 4). Additionally to the DEGs, 22 coding genes exhibiting interactions with at least five DEGs were included in the network, as determined using the BioGRID, HPRD and DIP databases.
Figure 4.
miRNA-mRNA regulatory network corresponding to genes differentially expressed between recurrent and nonrecurrent samples. Circles represent mRNAs and diamonds represent miRNAs. Green represents downregulated genes, pink represents upregulated genes, and white circles represent genes associated with at least five miRNA-interacting genes.
Feature coding gene identification
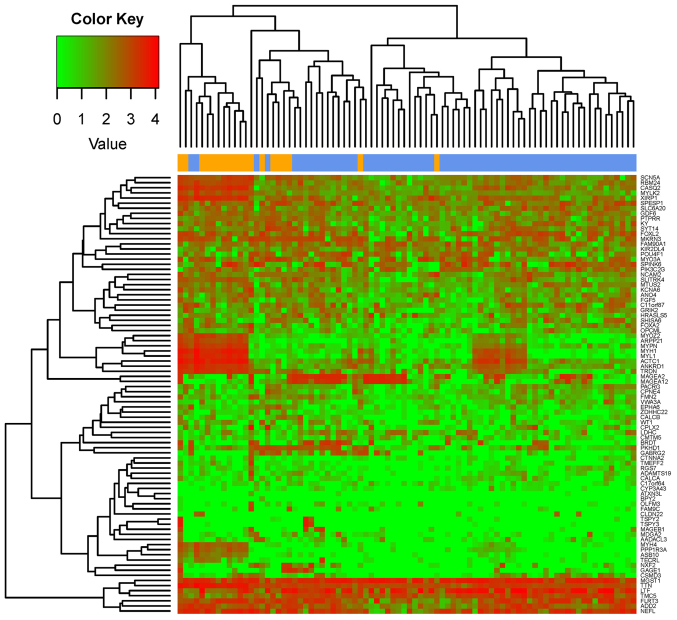
The 100 coding genes, including 86 DEGs and 14 DEG-associated genes, exhibiting the highest BC values in the miRNA-mRNA network were examined. The 86 DEGs were used to perform clustering analysis, and the results suggested that the DEGs clustered according to the two types of samples (Fig. 5). Similar results were identified when all the DEGs were considered for the clustering analysis (Fig. 2). The present results suggested that the 86 DEGs may be used as feature-coding genes for sample grouping.
Figure 5.
Heat map of 86 feature coding genes identified by the betweenness centrality values in the microRNA-mRNA network. Yellow represents recurrent samples and blue represents nonrecurrent samples. Red indicates upregulated genes and green indicates downregulated genes.
SVM classifier
The RFE algorithm was used to refine the list of feature-coding genes, and 32 optimal feature-coding genes exhibiting the highest predictive accuracy (94.05%) for sample grouping were selected. The 32 coding genes are presented in Table I. The SVM classifier constructed using the 32 feature-coding genes presented high accuracy (94.05%, 79/84) in separating the recurrent samples from the nonrecurrent samples.
Table I.
Basic information of 32 optimal feature-coding genes, among the genes significantly differentially expressed between recurrent and nonrecurrent cancer samples.
| Gene symbol | Betweenness centrality | Number of interactions | P-value | Log2 fold-change |
|---|---|---|---|---|
| SHISA6 | 0.240 | 4 | 0.028 | 0.544 |
| MAGEA2 | 0.215 | 5 | 0.047 | −0.394 |
| TRDN | 0.156 | 6 | 0.002 | 0.601 |
| RGS7 | 0.149 | 4 | 0.001 | 1.331 |
| CPNE4 | 0.142 | 4 | 0.020 | 0.657 |
| CALCA | 0.111 | 3 | 0.004 | 1.214 |
| GABRG2 | 0.101 | 2 | 0.035 | 0.599 |
| TECRL | 0.083 | 3 | 0.043 | 0.846 |
| MYLK2 | 0.073 | 3 | 0.005 | 0.543 |
| MYO3A | 0.058 | 3 | 0.048 | 0.365 |
| ASB10 | 0.057 | 3 | 0.001 | 1.261 |
| WT1 | 0.039 | 4 | 0.015 | 0.712 |
| CALCB | 0.038 | 2 | 0.006 | 0.986 |
| OPCML | 0.038 | 2 | 0.011 | 0.693 |
| KY | 0.038 | 2 | 0.011 | 0.502 |
| CYP3A43 | 0.038 | 2 | 0.027 | −2.312 |
| EPHA6 | 0.038 | 2 | 0.001 | 1.216 |
| SLC6A20 | 0.038 | 2 | 0.001 | 0.583 |
| NCAM2 | 0.036 | 2 | 0.026 | 0.451 |
| FLRT3 | 0.033 | 2 | 0.022 | 0.312 |
| TMC5 | 0.033 | 2 | 0.034 | −0.334 |
| AADACL3 | 0.033 | 2 | 0.011 | 0.983 |
| ANKRD1 | 0.026 | 6 | 0.005 | 0.520 |
| CLDN22 | 0.020 | 2 | 0.005 | −1.662 |
| FGF5 | 0.018 | 2 | 0.015 | 0.593 |
| SCN5A | 0.016 | 2 | 0.009 | 0.475 |
| PTPRR | 0.016 | 2 | 0.005 | 0.561 |
| LDHC | 0.015 | 2 | 0.000 | −1.366 |
| OLFM3 | 0.012 | 2 | 0.036 | 1.283 |
| HRASLS5 | 0.012 | 2 | 0.042 | −0.560 |
| SPINK6 | 0.010 | 2 | 0.011 | −0.533 |
| SPESP1 | 0.008 | 2 | 0.004 | 0.499 |
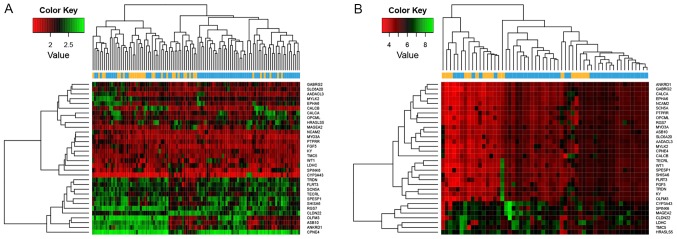
By examining the two validation datasets, the SVM classifier was able to distinguish 101 samples (30 recurrent and 71 non-recurrent) and 51 samples (16 recurrent and 35 non-recurrent) from the GSE27020 and GSE25727 datasets (Fig. 6) with an accuracy of 92.66 and 91.07%, respectively. The scatter plot of sample classifications is presented in Fig. 7. The five indicators (Se, Sp, PPV, NPV and AUC) presented high scores (Table II). AUC exhibited the highest score among the five indicators (Fig. 8). The present results suggested that the SVM classifier exhibited high accuracy and reliability in grouping samples from various datasets.
Figure 6.
Classification effect of the support vector machine classifier. Classification effect was investigated on the two validation datasets, (A) GSE27020 and (B) GSE25727. Yellow represents recurrent samples and blue represents nonrecurrent samples. Red indicates upregulated genes and green indicates downregulated genes.
Figure 7.
Scatter plot of samples classification using the SVM classifier. (A) Analysis of The Cancer Genome Atlas dataset. (B) GSE27020 dataset. (C) GSE25727 dataset. Blue represents nonrecurrent samples and red represents recurrent samples. SVM, support vector machine.
Table II.
Classifying parameters of the support vector machine classifier for the three datasets analyzed.
| Dataset | Number of samples | Accuracy | Sensitivity | Specificity | Positive predictive value | Negative predictive value | Area under receiver operating characteristic curve |
|---|---|---|---|---|---|---|---|
| TCGA | 84 | 0.9410 | 0.947 | 0.938 | 0.818 | 0.984 | 0.986 |
| GSE27020 | 109 | 0.9266 | 0.882 | 0.947 | 0.882 | 0.947 | 0.946 |
| GSE25727 | 56 | 0.9107 | 0.941 | 0.897 | 0.8 | 0.972 | 0.921 |
TCGA, The Cancer Genome Atlas.
Figure 8.
AUC of the support vector machine classifier on sample classification. (A) Sample grouping of The Cancer Genome Atlas dataset. (B) Sample grouping of the GSE27020 dataset. (C) Sample grouping of the GSE25727 dataset. AUC, area under the receiver operating characteristic curve.
Molecular function and pathway enrichment analysis
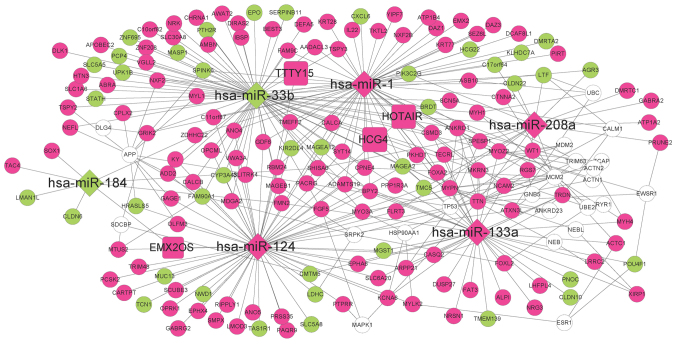
The ceRNA regulatory network comprised 203 nodes and 346 lines and was constructed by combining the lncRNA-miRNA regulatory network and the miRNA-mRNA regulatory network (Fig. 9). In the network, a node indicated a transcript (mRNA, miRNA or lncRNA), whereas a line indicated the association between two nodes. The coding genes in the ceRNA network were significantly enriched in 11 pathway categories, including ‘neuroactive ligand-receptor interaction’, ‘salivary secretion’ and ‘tight junction’ (Table III), and 16 molecular function categories, including ‘muscle contraction’, ‘muscle system process’ and ‘blood circulation’ (Table IV). The multiple hypotheses testing correction results for the GO molecular function and KEGG pathway categories were not statistically significant (data not shown).
Figure 9.
Competing endogenous RNA regulatory network of all DE-miRNAs, DE-lncRNAs and DEGs. Circles represent mRNAs, diamonds represent miRNAs and squares represent lncRNAs. Green represents downregulated genes, pink represents upregulated genes and white circles represent genes associated with at least five miRNA-interacting genes. miRNA, microRNA; DE, differentially expressed; lncRNA, long noncoding RNA.
Table III.
Significantly enriched pathways in the competing endogenous RNA regulatory network.
| KEGG pathway ID | KEGG pathway name | Gene count | P-value | Differentially expressed genes |
|---|---|---|---|---|
| hsa04530 | Tight junction | 5 | 0.001 | MYH1, CLDN6, MYH4, CTNNA2, CLDN10 |
| hsa04970 | Salivary secretion | 4 | 0.001 | HTN3, ATP1B4, ATP1A2, STATH |
| hsa04080 | Neuroactive ligand-receptor interaction | 6 | 0.004 | GABRA2, GABRG2, PTH2R, OPRK1, CHRNA1, GRIK2 |
| hsa04918 | Thyroid hormone synthesis | 3 | 0.007 | 6528, ATP1B4, ATP1A2 |
| hsa04964 | Proximal tubule bicarbonate reclamation | 2 | 0.008 | ATP1B4, ATP1A2 |
| hsa04960 | Aldosterone-regulated sodium reabsorption | 2 | 0.020 | ATP1B4, ATP1A2 |
| hsa05033 | Nicotine addiction | 2 | 0.020 | GABRA2, GABRG2 |
| hsa04973 | Carbohydrate digestion and absorption | 2 | 0.025 | ATP1B4, ATP1A2 |
| hsa04670 | Leukocyte transendothelial migration | 3 | 0.026 | CLDN6, CTNNA2, CLDN10 |
| hsa04978 | Mineral absorption | 2 | 0.032 | ATP1B4, ATP1A2 |
| hsa04514 | Cell adhesion molecules (CAMs) | 3 | 0.041 | CLDN6, NCAM2, CLDN10 |
KEGG, Kyoto Encyclopedia of Genes and Genomes.
Table IV.
Significantly enriched molecular functions in the competing endogenous RNA regulatory network.
| GO term ID | GO term name | Gene count | P-value | Genes |
|---|---|---|---|---|
| GO:0006936 | Muscle contraction | 11 | 4.17×10⁻⁷ | TRDN, ACTC1, MYH1, MYL1, MYLK2, MYH4, SMPX, TTN, CHRNA1, SCN5A, CASQ2 |
| GO:0003012 | Muscle system process | 11 | 9.88×10⁻⁷ | TRDN, ACTC1, MYH1, MYL1, MYLK2, MYH4, SMPX, TTN, CHRNA1, SCN5A, CASQ2 |
| GO:0008015 | Blood circulation | 10 | 1.89×10⁻⁵ | CALCA, CALCB, ACTC1, MYL1, MYLK2, CARTPT, ATP1A2, TAC4, SCN5A, EPO |
| GO:0003013 | Circulatory system process | 10 | 1.89×10⁻⁵ | CALCA, CALCB, ACTC1, MYL1, MYLK2, CARTPT, ATP1A2, TAC4, SCN5A, EPO |
| GO:0007267 | Cell-cell signaling | 16 | 9.03×10⁻⁵ | FGF5, GABRG2, GABRA2, GRIK2, OPRK1, MYLK2, ATP1A2, CXCL6, IL22, CTNNA2, CALCA, PNOC, SLC1A6, CARTPT, SLC30A8, CHRNA1 |
| GO:0006811 | Ion transport | 18 | 1.32×10⁻⁴ | GABRG2, SLC5A5, GABRA2, GRIK2, ATP1B4, KCNA6, ATP1A2, TCN1, BEST3, SLC1A6, SLC5A8, LTF, ANO5, ANO4, CHRNA1, SLC30A8, SCN5A, ADD2 |
| GO:0007268 | Synaptic transmission | 11 | 1.44×10⁻⁴ | GABRG2, GABRA2, PNOC, GRIK2, OPRK1, SLC1A6, MYLK2, CARTPT, ATP1A2, CHRNA1, CTNNA2 |
| GO:0030182 | Neuron differentiation | 13 | 2.09×10⁻⁴ | NCAM2, SLITRK4, SOX1, OPCML, FOXA2, PKHD1, EMX2, MDGA2, PTPRR, POU4F1, OLFM3, NEFL, CTNNA2 |
| GO:0019226 | Transmission of nerve impulse | 11 | 5.20×10⁻⁴ | GABRG2, GABRA2, PNOC, GRIK2, OPRK1, SLC1A6, MYLK2, CARTPT, ATP1A2, CHRNA1, CTNNA2 |
| GO:0055082 | Cellular chemical homeostasis | 10 | 3.60×10⁻³ | CALCA, CALCB, XIRP1, GRIK2, SLC1A6, LTF, CARTPT, ATP1A2, SLC30A8, CHRNA1 |
| GO:0019725 | Cellular homeostasis | 10 | 1.29×10⁻² | CALCA, CALCB, XIRP1, GRIK2, SLC1A6, LTF, CARTPT, ATP1A2, SLC30A8, CHRNA1 |
| GO:0048878 | Chemical homeostasis | 10 | 2.24×10⁻² | CALCA, CALCB, XIRP1, GRIK2, SLC1A6, LTF, CARTPT, ATP1A2, SLC30A8, CHRNA1 |
| GO:0007155 | Cell adhesion | 12 | 2.54×10⁻² | IBSP, FLRT3, CALCA, NCAM2, AMBN, OPCML, FAT3, PKHD1, CLDN6, CLDN22, CLDN10, CTNNA2 |
| GO:0022610 | Biological adhesion | 12 | 2.56×10⁻² | IBSP, FLRT3, CALCA, NCAM2, AMBN, OPCML, FAT3, PKHD1, CLDN6, CLDN22, CLDN10, CTNNA2 |
| GO:0050877 | Neurological system process | 17 | 3.28×10⁻² | GABRG2, GABRA2, MYO3A, GRIK2, OPRK1, MYLK2, ATP1A2, TAS1R1, CTNNA2, CALCA, NCAM2, PNOC, SLC1A6, CARTPT, POU4F1, CHRNA1, NEFL |
| GO:0042592 | Homeostatic process | 12 | 3.94×10⁻² | CALCA, CALCB, XIRP1, GRIK2, PKHD1, SLC1A6, LTF, CARTPT, ATP1A2, SLC30A8, CHRNA1, EPO |
GO, Gene Ontology.
ceRNA regulatory network of 32 optimal feature-coding genes
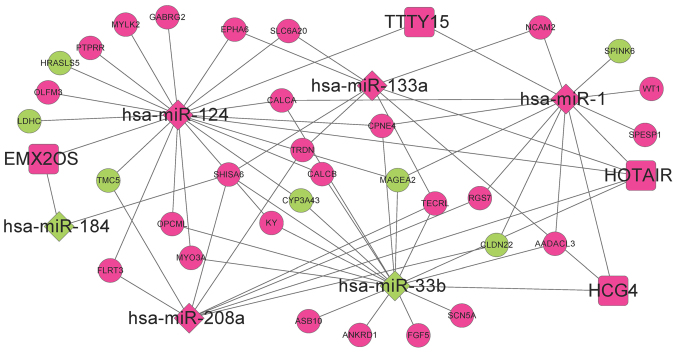
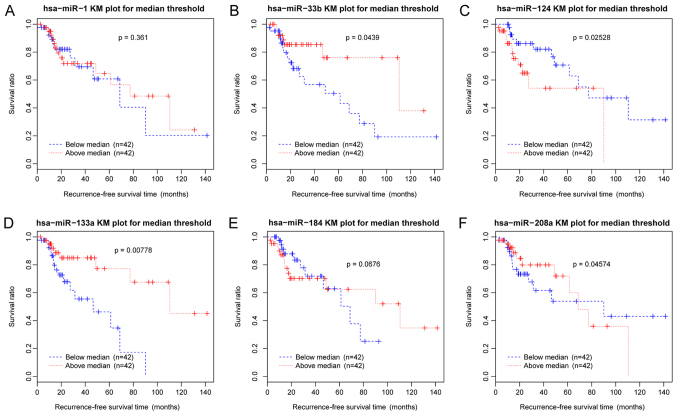
The ceRNA regulatory network corresponding to the 32 optimal feature coding genes was established and consisted of six DE-miRs, four DE-lncRs and 32 feature-coding genes (Fig. 10). In the ceRNA network, the interactions between HCG4-miR-33b, HOTAIR-miR-1-MAGE family member A2 (MAGEA2), EMX2OS-miR-124-calcitonin related polypeptide α (CALCA) and EMX2OS-miR-124-γ-aminobutyric acid type A receptor γ2 subunit (GABRG2) exhibited the highest scores. The Kaplan-Meier survival curves of these six DE-miRs suggested a significant association between recurrence-free survival times and the expression levels of the miRNAs examined, including hsa-miR-33b, hsa-miR-124, hsa-miR-133a and hsa-miR-208a (P<0.05; Fig. 11).
Figure 10.
Competing endogenous RNA regulatory network of DE-miRNAs, DE-lncRNAs, and 32 optimal feature coding genes. Circles represent mRNAs, diamonds represent miRNAs and squares represent lncRNAs. Green represents downregulated genes, pink represents upregulated genes and white circles represent genes associated with at least five miRNA-interacting genes. DE, differentially expressed; miRNA, microRNA; lncRNA, long noncoding RNA.
Figure 11.
KM survival curves of the differentially expressed miRs in the competing endogenous RNA regulatory network constructed using 32 optimal feature coding genes. Blue curves represent samples with downregulated miRs and red curves represent samples with upregulated miRs. (A) hsa-miR-1. (B) hsa-miR-33b. (C) hsa-miR-124. (D) hsa-miR-133a. (E) hsa-miR-184. (F) hsa-miR-208a. KM, Kaplan-Meier; miR, microRNA.
Discussion
By analyzing the RNA-seq data downloaded from TCGA, the DE-miRs, DEGs and DE-lncRs between recurrent and nonrecurrent laryngeal cancer samples were identified. Based on the associations identified in various databases, numerous networks (miRNA-mRNA, lncRNA-mRNA and ceRNA networks) were constructed to examine the potential interactions among feature-coding genes, miRNAs and lncRNAs. The aim of the present study was to identify the regulatory mechanisms underlying the recurrence of laryngeal cancer. In the ceRNA network, the interactions between HCG4-miR-33b, HOTAIR-miR-1- MAGEA2, EMX2OS-miR-124- CALCA and EMX2OS-miR-124-GABRG2 exhibited the highest scores. According to the BC values in the miRNA-mRNA network and the RFE algorithm, 32 optimal feature-coding genes, including MAGEA2, CALCA and GABRG2 were identified to be associated with recurrent laryngeal cancer samples. Since the 32 feature-coding genes were identified by analyzing the miRNA-mRNA network, all 32 coding genes were associated with DE-miRs. The SVM classifier constructed using these feature-coding genes exhibited high accuracy in grouping samples from the TCGA dataset (94.05%) and from the two validation datasets (GSE27020: 92.66%; GSE25727: 91.07%).
miR-206 serves an important role in the inhibition of tumor proliferation and metastasis in numerous cancer types (31–33). In laryngeal cancer, miR-206 may serve as a tumor suppressor by targeting vascular endothelial growth factor (34). miR-1, a homolog of miR-206 (35), was identified as a DE-miR in the present ceRNA network and may serve a role in the control of laryngeal cancer recurrence. The present bioinformatics analyses identified that miR-1 may be associated with the lncRNA HOTAIR in laryngeal cancer. In LSCC, HOTAIR is upregulated and associated with the risk of lymphatic metastasis, and with poor prognosis (36,37). In addition, the oncogenic role of HOTAIR may be associated with PTEN methylation (38). To the best of the authors' knowledge, no previous study has investigated the regulatory association between miR-1 and HOTAIR in laryngeal cancer. However, miR-1 was demonstrated to be a direct downstream target of HOTAIR in thyroid cancer cells, and miR-1 inhibition may promote HOTAIR-mediated tumor progression (39). In bladder cancer cells, the increased expression of miR-1 is negatively associated with HOTAIR (40). In the present ceRNA network, MAGEA2 was identified to be a potential target of miR-1. In HNSCC, MAGEA2 is upregulated and promotes the growth of normal oral keratinocytes, partly via the p53 pathway (41). Collectively, the interaction HOTAIR-miR-1-MAGEA2 may serve a regulatory role in the progression of laryngeal cancer.
miR-33b belongs to the miR-33 family and regulates cholesterol homeostasis, and lipid and glucose metabolism (42). A previous study observed that miR-33b may inhibit the metastasis of breast cancer (43). In gastric cancer, curcumin exerts its inhibitory activity by upregulating the expression level of miR-33b (44). In laryngeal cancer, a previous study identified that miR-33a may exert antiproliferative effects by targeting pim-1 proto-oncogene, serine/threonine kinase (45). In the present ceRNA network, miR-33b was associated with the lncRNA HCG4, which was identified to be a candidate gene in multiple sclerosis (46); however, its role in laryngeal cancer remains unclear. The present results suggested that HCG4 was a DE-lncR associated with the recurrence of laryngeal cancer, which interacted with miR-33b. Therefore, these two molecular factors may be associated with and may serve important functional roles during the recurrence of laryngeal cancer.
miR-124 has been identified to serve a role in numerous cancer types (47,48). Hypermethylation of miR-124 may result in the development of colon, breast and lung cancer (49). The downregulation of miR-124 expression may suppress nasopharyngeal carcinoma (50). Furthermore, the expression level of miR-124 is associated with recurrence in patients with lung cancer (51). In HNSCC, miR-124 serves as a tumor suppressor gene (52) and inhibits the epithelial-restricted with serine box/epidermal growth factor receptor signaling pathway (53). In the present study, miR-124 was identified to be differentially expressed between recurrent and nonrecurrent laryngeal cancer samples. Therefore, miR-124 may serve as a tumor suppressor gene in laryngeal cancer and may be associated with laryngeal cancer recurrence. The present ceRNA network results suggested that EMX2OS and TTTY15 were two lncRNAs that may interact with miR-124. EMX2OS was previously identified to be associated with brain diseases (54). In comparison with healthy controls, patients with myalgic encephalomyelitis/chronic fatigue syndrome exhibited an increase in the expression level of EMX2OS (55). EMX2OS is expressed in the central nervous system, similarly to empty spiracles homeobox 2 (54). The gene fusion zinc finger DHHC-type containing 2-TTTY15 was identified as one of four fusion genes in a patient with acute myeloid leukemia, by whole genome sequencing (56). The fusion gene TTTY15-ubiquitin specific peptidase 9 Y-linked (USP9Y) exhibited high prevalence among Chinese patients with prostate cancer, and the TTTY15-USP9Y fusion is an independent predictor of prostate cancer (57). To the best of the authors' knowledge, no previous studies have reported the association between TTTY15 or EMX2OS and laryngeal cancer. Therefore, these lncRNAs may represent novel biomarkers or may exhibit gene fusion in laryngeal cancer. In addition, miR-184 expression is upregulated in the majority of HNSCC tumors (58). In the present study, miR-124 and miR-184 were associated with the lncRNA EMX2OS, suggesting a potential role EMX2OS in the regulation of laryngeal cancer. Among the genes interacting with miR-124, the present study identified that CALCA and GABRG2 were associated with recurrent laryngeal carcinoma. A previous study demonstrated that methylation of CALCA was identified to be detected in 70% of patients with recurrent thyroid cancer (59). Therefore, CALCA and GABRG2 may serve important roles in the recurrence of laryngeal cancer, and the regulatory mechanism underlying laryngeal cancer recurrence may involve the EMX2OS-miR-124-CALCA/GABRG2 axis.
The SVM classifier is an effective classification method. The SVM classifier has been used to classify various cancer samples, in cancer subtypes including melanoma (60), metastatic breast cancer (61) and lung cancer (62). The SVM classifier was constructed to identify the feature-coding genes that may be able to discriminate recurrent from nonrecurrent laryngeal cancer samples. In the present study, the SVM classifier comprising 32 feature coding genes exhibited high accuracy in sample classification. Specifically, the SVM classifier exhibited high accuracy in the two validation datasets, suggesting that this method was a reliable classification method.
Although the present bioinformatics results were tested using validation datasets, the present study exhibited two limitations. Since the samples were derived from TCGA and GEO databases, the sample size may be limited. Furthermore, the present results require validation in vitro and in vivo. Therefore, further experiments are required to be performed in the future to confirm the present study. Nevertheless, the present results may provide useful insights for improving the understanding of the pathogenesis of laryngeal cancer recurrence.
In conclusion, an SVM classifier composed of 32 feature-coding genes classified recurrent and nonrecurrent laryngeal cancer samples with high accuracy. miR-1, miR-33b, miR-124, HOTAIR, HCG4 and EMX2OS may represent a signature of noncoding RNAs in recurrent laryngeal cancer. The interactions HCG4-miR-33b, HOTAIR-miR-1-MAGEA2 and EMX2OS-miR-124-CALCA/GABRG2 may be important in the regulation of the molecular mechanisms underlying the development of recurrent laryngeal cancer.
Acknowledgements
Not applicable.
Funding
No funding was received.
Availability of data and materials
The datasets used and/or analyzed during the current study are available from the corresponding author on reasonable request.
Authors' contributions
ZT and GW performed data analyses and wrote the manuscript. LZ and ZX conceived and designed the study. All authors read and approved the final manuscript.
Ethics approval and consent to participate
Not applicable.
Patient consent for publication
Not applicable.
Competing interests
The authors declare that they have no competing interests.
References
- 1.Piccirillo JF. Importance of comorbidity in head and neck cancer. Laryngoscope. 2015;125:2242. doi: 10.1002/lary.25278. [DOI] [PubMed] [Google Scholar]
- 2.Hoffman HT, Porter K, Karnell LH, Cooper JS, Weber RS, Langer CJ, Ang KK, Gay G, Stewart A, Robinson RA. Laryngeal cancer in the United States: Changes in demographics, patterns of care, and survival. Laryngoscope. 2006;116(Suppl 111):1–13. doi: 10.1097/01.mlg.0000236095.97947.26. [DOI] [PubMed] [Google Scholar]
- 3.Tamaki A, Miles BA, Lango M, Kowalski L, Zender CA. AHNS Series: Do you know your guidelines? Review of current knowledge on laryngeal cancer. Head Neck. 2018;40:170–181. doi: 10.1002/hed.24862. [DOI] [PubMed] [Google Scholar]
- 4.Wei KR, Zheng RS, Liang ZH, Sun KX, Zhang SW, Li ZM, Zeng HM, Zou XN, Chen WQ, He J. Incidence and mortality of laryngeal cancer in China, 2014. Zhonghua Zhong Liu Za Zhi. 2018;40:736–743. doi: 10.3760/cma.j.issn.0253-3766.2018.10.004. (In Chinese) [DOI] [PubMed] [Google Scholar]
- 5.Haas I, Hauser U, Ganzer U. The dilemma of follow-up in head and neck cancer patients. Eur Arch Otorhinolaryngol. 2001;258:177–183. doi: 10.1007/s004050100333. [DOI] [PubMed] [Google Scholar]
- 6.Johansen LV, Grau C, Overgaard J. Glottic carcinoma--patterns of failure and salvage treatment after curative radiotherapy in 861 consecutive patients. Radiother Oncol. 2002;63:257–267. doi: 10.1016/S0167-8140(02)00118-4. [DOI] [PubMed] [Google Scholar]
- 7.Dai MY, Wang Y, Chen C, Li F, Xiao BK, Chen SM, Tao ZZ. Phenethyl isothiocyanate induces apoptosis and inhibits cell proliferation and invasion in Hep-2 laryngeal cancer cells. Oncol Rep. 2016;35:2657–2664. doi: 10.3892/or.2016.4689. [DOI] [PubMed] [Google Scholar]
- 8.Miao S, Mao X, Zhao S, Song K, Xiang C, Lv Y, Jiang H, Wang L, Li B, Yang X, et al. miR-217 inhibits laryngeal cancer metastasis by repressing AEG-1 and PD-L1 expression. Oncotarget. 2017;8:62143–62153. doi: 10.18632/oncotarget.19121. [DOI] [PMC free article] [PubMed] [Google Scholar]
- 9.Saito K, Inagaki K, Kamimoto T, Ito Y, Sugita T, Nakajo S, Hirasawa A, Iwamaru A, Ishikura T, Hanaoka H, et al. MicroRNA-196a is a putative diagnostic biomarker and therapeutic target for laryngeal cancer. PLoS One. 2013;8:e71480. doi: 10.1371/journal.pone.0071480. [DOI] [PMC free article] [PubMed] [Google Scholar]
- 10.Yang JQ, Liu HX, Liang Z, Sun YM, Wu M. Over-expression of p53, p21 and Cdc2 in histologically negative surgical margins is correlated with local recurrence of laryngeal squamous cell carcinoma. Int J Clin Exp Pathol. 2014;7:4295–4302. [PMC free article] [PubMed] [Google Scholar]
- 11.Yang JQ, Liang Z, Wu M, Sun YM, Liu HX. Expression of p27 and PTEN and clinical characteristics in early laryngeal squamous cell carcinoma and their correlation with recurrence. Int J Clin Exp Pathol. 2015;8:5715–5720. [PMC free article] [PubMed] [Google Scholar]
- 12.Memczak S, Jens M, Elefsinioti A, Torti F, Krueger J, Rybak A, Maier L, Mackowiak SD, Gregersen LH, Munschauer M, et al. Circular RNAs are a large class of animal RNAs with regulatory potency. Nature. 2013;495:333–338. doi: 10.1038/nature11928. [DOI] [PubMed] [Google Scholar]
- 13.Hansen TB, Jensen TI, Clausen BH, Bramsen JB, Finsen B, Damgaard CK, Kjems J. Natural RNA circles function as efficient microRNA sponges. Nature. 2013;495:384–388. doi: 10.1038/nature11993. [DOI] [PubMed] [Google Scholar]
- 14.Jin C, Zhang Y, Li J. Upregulation of MiR-196a promotes cell proliferation by downregulating p27kip1 in laryngeal cancer. Biol Res. 2016;49:40. doi: 10.1186/s40659-016-0100-9. [DOI] [PMC free article] [PubMed] [Google Scholar]
- 15.Sun X, Liu B, Zhao XD, Wang LY, Ji WY. MicroRNA-221 accelerates the proliferation of laryngeal cancer cell line Hep-2 by suppressing Apaf-1. Oncol Rep. 2015;33:1221–1226. doi: 10.3892/or.2015.3714. [DOI] [PubMed] [Google Scholar]
- 16.Li M, Chen SM, Chen C, Zhang ZX, Dai MY, Zhang LB, Wang SB, Dai Q, Tao ZZ. microRNA-299-3p inhibits laryngeal cancer cell growth by targeting human telomerase reverse transcriptase mRNA. Mol Med Rep. 2015;11:4645–4649. doi: 10.3892/mmr.2015.3287. [DOI] [PubMed] [Google Scholar]
- 17.Yang T, Li S, Liu J, Yin D, Yang X, Tang Q. lncRNA-NKILA/NF-κB feedback loop modulates laryngeal cancer cell proliferation, invasion, and radioresistance. Cancer Med. 2018;7:2048–2063. doi: 10.1002/cam4.1405. [DOI] [PMC free article] [PubMed] [Google Scholar]
- 18.Bai Z, Shi E, Wang Q, Dong Z, Xu P. A potential panel of two-long non-coding RNA signature to predict recurrence of patients with laryngeal cancer. Oncotarget. 2017;8:69641–69650. doi: 10.18632/oncotarget.18751. [DOI] [PMC free article] [PubMed] [Google Scholar]
- 19.Fountzilas E, Kotoula V, Angouridakis N, Karasmanis I, Wirtz RM, Eleftheraki AG, Veltrup E, Markou K, Nikolaou A, Pectasides D, et al. Identification and validation of a multigene predictor of recurrence in primary laryngeal cancer. PLoS One. 2013;8:e70429. doi: 10.1371/journal.pone.0070429. [DOI] [PMC free article] [PubMed] [Google Scholar]
- 20.Carvalho B, Bengtsson H, Speed TP, Irizarry RA. Exploration, normalization, and genotype calls of high-density oligonucleotide SNP array data. Biostatistics. 2007;8:485–499. doi: 10.1093/biostatistics/kxl042. [DOI] [PubMed] [Google Scholar]
- 21.Fountzilas E, Markou K, Vlachtsis K, Nikolaou A, Arapantoni-Dadioti P, Ntoula E, Tassopoulos G, Bobos M, Konstantinopoulos P, Fountzilas G, et al. Identification and validation of gene expression models that predict clinical outcome in patients with early-stage laryngeal cancer. Ann Oncol. 2012;23:2146–2153. doi: 10.1093/annonc/mdr576. [DOI] [PMC free article] [PubMed] [Google Scholar]
- 22.Ritchie ME, Phipson B, Wu D, Hu Y, Law CW, Shi W, Smyth GK. limma powers differential expression analyses for RNA-sequencing and microarray studies. Nucleic Acids Res. 2015;43:e47. doi: 10.1093/nar/gkv007. [DOI] [PMC free article] [PubMed] [Google Scholar]
- 23.Robinson MD, McCarthy DJ, Smyth GK. edgeR: A Bioconductor package for differential expression analysis of digital gene expression data. Bioinformatics. 2010;26:139–140. doi: 10.1093/bioinformatics/btp616. [DOI] [PMC free article] [PubMed] [Google Scholar]
- 24.Kohl M, Wiese S, Warscheid B. Cytoscape: Software for visualization and analysis of biological networks. Methods Mol Biol. 2011;696:291–303. doi: 10.1007/978-1-60761-987-1_18. [DOI] [PubMed] [Google Scholar]
- 25.Uoh KI, Kahng B, Kim D. Universal behavior of load distribution in scale-free networks. Phys Rev Lett. 2001;87:278701. doi: 10.1103/PhysRevLett.87.278701. [DOI] [PubMed] [Google Scholar]
- 26.Eisen MB, Spellman PT, Brown PO, Botstein D. Cluster analysis and display of genome-wide expression patterns. Proc Natl Acad Sci USA. 1998;95:14863–14868. doi: 10.1073/pnas.95.25.14863. [DOI] [PMC free article] [PubMed] [Google Scholar]
- 27.Baur B, Bozdag S. A Feature Selection Algorithm to Compute Gene Centric Methylation from Probe Level Methylation Data. PLoS One. 2016;11:e0148977. doi: 10.1371/journal.pone.0148977. [DOI] [PMC free article] [PubMed] [Google Scholar]
- 28.Zhang X, Lu X, Shi Q, Xu XQ, Leung HC, Harris LN, Iglehart JD, Miron A, Liu JS, Wong WH. Recursive SVM feature selection and sample classification for mass-spectrometry and microarray data. BMC Bioinformatics. 2006;7:197. doi: 10.1186/1471-2105-7-197. [DOI] [PMC free article] [PubMed] [Google Scholar]
- 29.Kanehisa M, Goto S. KEGG: Kyoto encyclopedia of genes and genomes. Nucleic Acids Res. 2000;28:27–30. doi: 10.1093/nar/28.1.27. [DOI] [PMC free article] [PubMed] [Google Scholar]
- 30.Rivals I, Personnaz L, Taing L, Potier MC. Enrichment or depletion of a GO category within a class of genes: Which test? Bioinformatics. 2007;23:401–407. doi: 10.1093/bioinformatics/btl633. [DOI] [PubMed] [Google Scholar]
- 31.Ge X, Lyu P, Cao Z, Li J, Guo G, Xia W, Gu Y. Overexpression of miR-206 suppresses glycolysis, proliferation and migration in breast cancer cells via PFKFB3 targeting. Biochem Biophys Res Commun. 2015;463:1115–1121. doi: 10.1016/j.bbrc.2015.06.068. [DOI] [PubMed] [Google Scholar]
- 32.Wei C, Wang S, Ye ZQ, Chen ZQ. miR-206 inhibits renal cell cancer growth by targeting GAK. J Huazhong Univ Sci Technolog Med Sci. 2016;36:852–858. doi: 10.1007/s11596-016-1674-8. [DOI] [PubMed] [Google Scholar]
- 33.Ren XL, He GY, Li XM, Men H, Yi LZ, Lu GF, Xin SN, Wu PX, Li YL, Liao WT, et al. MicroRNA-206 functions as a tumor suppressor in colorectal cancer by targeting FMNL2. J Cancer Res Clin Oncol. 2016;142:581–592. doi: 10.1007/s00432-015-2053-8. [DOI] [PubMed] [Google Scholar]
- 34.Zhang T, Liu M, Wang C, Lin C, Sun Y, Jin D. Down-regulation of MiR-206 promotes proliferation and invasion of laryngeal cancer by regulating VEGF expression. Anticancer Res. 2011;31:3859–3863. [PubMed] [Google Scholar]
- 35.Yang Q, Zhang C, Huang B, Li H, Zhang R, Huang Y, Wang J. Downregulation of microRNA-206 is a potent prognostic marker for patients with gastric cancer. Eur J Gastroenterol Hepatol. 2013;25:953–957. doi: 10.1097/MEG.0b013e32835ed691. [DOI] [PubMed] [Google Scholar]
- 36.Zheng J, Xiao X, Wu C, Huang J, Zhang Y, Xie M, Zhang M, Zhou L. The role of long non-coding RNA HOTAIR in the progression and development of laryngeal squamous cell carcinoma interacting with EZH2. Acta Otolaryngol. 2017;137:90–98. doi: 10.1080/00016489.2016.1214982. [DOI] [PubMed] [Google Scholar]
- 37.Wang J, Zhou Y, Lu J, Sun Y, Xiao H, Liu M, Tian L. Combined detection of serum exosomal miR-21 and HOTAIR as diagnostic and prognostic biomarkers for laryngeal squamous cell carcinoma. Med Oncol. 2014;31:148. doi: 10.1007/s12032-014-0148-8. [DOI] [PubMed] [Google Scholar]
- 38.Li D, Feng J, Wu T, Wang Y, Sun Y, Ren J, Liu M. Long intergenic noncoding RNA HOTAIR is overexpressed and regulates PTEN methylation in laryngeal squamous cell carcinoma. Am J Pathol. 2013;182:64–70. doi: 10.1016/j.ajpath.2012.08.042. [DOI] [PubMed] [Google Scholar]
- 39.Di W, Li Q, Shen W, Guo H, Zhao S. The long non-coding RNA HOTAIR promotes thyroid cancer cell growth, invasion and migration through the miR-1-CCND2 axis. Am J Cancer Res. 2017;7:1298–1309. [PMC free article] [PubMed] [Google Scholar]
- 40.Yu D, Zhang C, Gui J. RNA-binding protein HuR promotes bladder cancer progression by competitively binding to the long noncoding HOTAIR with miR-1. OncoTargets Ther. 2017;10:2609–2619. doi: 10.2147/OTT.S132728. [DOI] [PMC free article] [PubMed] [Google Scholar]
- 41.Glazer CA, Smith IM, Bhan S, Sun W, Chang SS, Pattani KM, Westra W, Khan Z, Califano JA. The role of MAGEA2 in head and neck cancer. Arch Otolaryngol Head Neck Surg. 2011;137:286–293. doi: 10.1001/archoto.2011.2. [DOI] [PMC free article] [PubMed] [Google Scholar]
- 42.Rayner KJ, Suárez Y, Dávalos A, Parathath S, Fitzgerald ML, Tamehiro N, Fisher EA, Moore KJ, Fernández-Hernando C. MiR-33 contributes to the regulation of cholesterol homeostasis. Science. 2010;328:1570–1573. doi: 10.1126/science.1189862. [DOI] [PMC free article] [PubMed] [Google Scholar]
- 43.Lin Y, Liu AY, Fan C, Zheng H, Li Y, Zhang C, Wu S, Yu D, Huang Z, Liu F, et al. MicroRNA-33b Inhibits Breast Cancer Metastasis by Targeting HMGA2, SALL4 and Twist1. Sci Rep. 2015;5:9995. doi: 10.1038/srep09995. [DOI] [PMC free article] [PubMed] [Google Scholar]
- 44.Sun Q, Zhang W, Guo Y, Li Z, Chen X, Wang Y, Du Y, Zang W, Zhao G. Curcumin inhibits cell growth and induces cell apoptosis through upregulation of miR-33b in gastric cancer. Tumour Biol. 2016;37:13177–13184. doi: 10.1007/s13277-015-4632-3. [DOI] [PubMed] [Google Scholar]
- 45.Karatas OF. Antiproliferative potential of miR-33a in laryngeal cancer Hep-2 cells via targeting PIM1. Head Neck. 2018;40:2455–2461. doi: 10.1002/hed.25361. [DOI] [PubMed] [Google Scholar]
- 46.Burfoot RK, Jensen CJ, Field J, Stankovich J, Varney MD, Johnson LJ, Butzkueven H, Booth D, Bahlo M, Tait BD, et al. SNP mapping and candidate gene sequencing in the class I region of the HLA complex: Searching for multiple sclerosis susceptibility genes in Tasmanians. Tissue Antigens. 2008;71:42–50. doi: 10.1111/j.1399-0039.2007.00962.x. [DOI] [PubMed] [Google Scholar]
- 47.Wang M, Meng B, Liu Y, Yu J, Chen Q, Liu Y. MiR-124 Inhibits Growth and Enhances Radiation-Induced Apoptosis in Non-Small Cell Lung Cancer by Inhibiting STAT3. Cell Physiol Biochem. 2017;44:2017–2028. doi: 10.1159/000485907. [DOI] [PubMed] [Google Scholar]
- 48.Chen Z, Liu S, Tian L, Wu M, Ai F, Tang W, Zhao L, Ding J, Zhang L, Tang A. miR-124 and miR-506 inhibit colorectal cancer progression by targeting DNMT3B and DNMT1. Oncotarget. 2015;6:38139–38150. doi: 10.18632/oncotarget.5709. [DOI] [PMC free article] [PubMed] [Google Scholar]
- 49.Roman-Gomez J, Agirre X, Jiménez-Velasco A, Arqueros V, Vilas-Zornoza A, Rodriguez-Otero P, Martin-Subero I, Garate L, Cordeu L, San José-Eneriz E, et al. Epigenetic regulation of microRNAs in acute lymphoblastic leukemia. J Clin Oncol. 2009;27:1316–1322. doi: 10.1200/JCO.2008.19.3441. [DOI] [PubMed] [Google Scholar]
- 50.Peng XH, Huang HR, Lu J, Liu X, Zhao FP, Zhang B, Lin SX, Wang L, Chen HH, Xu X, et al. MiR-124 suppresses tumor growth and metastasis by targeting Foxq1 in nasopharyngeal carcinoma. Mol Cancer. 2014;13:186. doi: 10.1186/1476-4598-13-186. [DOI] [PMC free article] [PubMed] [Google Scholar]
- 51.Patnaik SK, Kannisto E, Knudsen S, Yendamuri S. Evaluation of microRNA expression profiles that may predict recurrence of localized stage I non-small cell lung cancer after surgical resection. Cancer Res. 2010;70:36–45. doi: 10.1158/0008-5472.CAN-09-3153. [DOI] [PubMed] [Google Scholar]
- 52.Zhao Y, Ling Z, Hao Y, Pang X, Han X, Califano JA, Shan L, Gu X. MiR-124 acts as a tumor suppressor by inhibiting the expression of sphingosine kinase 1 and its downstream signaling in head and neck squamous cell carcinoma. Oncotarget. 2017;8:25005–25020. doi: 10.18632/oncotarget.15334. [DOI] [PMC free article] [PubMed] [Google Scholar]
- 53.Zhang M, Piao L, Datta J, Lang JC, Xie X, Teknos TN, Mapp AK, Pan Q. miR-124 Regulates the Epithelial-Restricted with Serine Box/Epidermal Growth Factor Receptor Signaling Axis in Head and Neck Squamous Cell Carcinoma. Mol Cancer Ther. 2015;14:2313–2320. doi: 10.1158/1535-7163.MCT-14-1071. [DOI] [PMC free article] [PubMed] [Google Scholar]
- 54.Spigoni G, Gedressi C, Mallamaci A. Regulation of Emx2 expression by antisense transcripts in murine cortico-cerebral precursors. PLoS One. 2010;5:e8658. doi: 10.1371/journal.pone.0008658. [DOI] [PMC free article] [PubMed] [Google Scholar]
- 55.Yang CA, Bauer S, Ho YC, Sotzny F, Chang JG, Scheibenbogen C. The expression signature of very long non-coding RNA in myalgic encephalomyelitis/chronic fatigue syndrome. J Transl Med. 2018;16:231. doi: 10.1186/s12967-018-1600-x. [DOI] [PMC free article] [PubMed] [Google Scholar]
- 56.Wang L, Sun Y, Sun Y, Meng L, Xu X. First case of AML with rare chromosome translocations: A case report of twins. BMC Cancer. 2018;18:458. doi: 10.3390/cancers10110458. [DOI] [PMC free article] [PubMed] [Google Scholar]
- 57.Zhu Y, Ren S, Jing T, Cai X, Liu Y, Wang F, Zhang W, Shi X, Chen R, Shen J, et al. Clinical utility of a novel urine-based gene fusion TTTY15-USP9Y in predicting prostate biopsy outcome. Urol Oncol. 2015;33:384.e9–384.e20. doi: 10.1016/j.urolonc.2015.01.019. [DOI] [PubMed] [Google Scholar]
- 58.Kao SY, Tsai MM, Wu CH, Chen JJ, Tseng SH, Lin SC, Chang KW. Co-targeting of multiple microRNAs on factor-Inhibiting hypoxia-Inducible factor gene for the pathogenesis of head and neck carcinomas. Head Neck. 2016;38:522–528. doi: 10.1002/hed.23912. [DOI] [PubMed] [Google Scholar]
- 59.Hu S, Ewertz M, Tufano RP, Brait M, Carvalho AL, Liu D, Tufaro AP, Basaria S, Cooper DS, Sidransky D, et al. Detection of serum deoxyribonucleic acid methylation markers: A novel diagnostic tool for thyroid cancer. J Clin Endocrinol Metab. 2006;91:98–104. doi: 10.1210/jc.2005-1810. [DOI] [PubMed] [Google Scholar]
- 60.Afifi S, Gholamhosseini H, Sinha R. IEEE; Seogwipo: 2017. SVM classifier on chip for melanoma detection. In: Proceedings of the 39th Annual International Conference of the IEEE Engineering in Medicine and Biology Society (EMBC) pp. 270–274. [DOI] [PubMed] [Google Scholar]
- 61.Tuo Y, An N, Zhang M. Feature genes in metastatic breast cancer identified by MetaDE and SVM classifier methods. Mol Med Rep. 2018;17:4281–4290. doi: 10.3892/mmr.2018.8398. [DOI] [PMC free article] [PubMed] [Google Scholar]
- 62.Zhao J, Cheng W, He X, Liu Y, Li J, Sun J, Li J, Wang F, Gao Y. Construction of a specific SVM classifier and identification of molecular markers for lung adenocarcinoma based on lncRNA-miRNA-mRNA network. OncoTargets Ther. 2018;11:3129–3140. doi: 10.2147/OTT.S151121. [DOI] [PMC free article] [PubMed] [Google Scholar]
Associated Data
This section collects any data citations, data availability statements, or supplementary materials included in this article.
Data Availability Statement
The datasets used and/or analyzed during the current study are available from the corresponding author on reasonable request.


