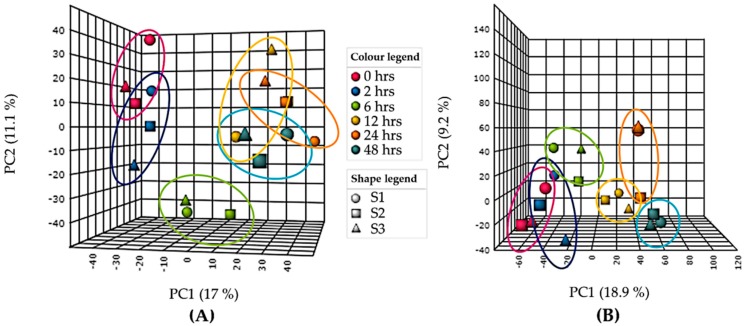
Figure 1.
Principle component analysis (PCA) of (A) intracellular and (B) extracellular gas chromatography-mass spectrometry (GC–MS) data of UV-B exposed (PAR + UV-B) Chlorogloeopsis fritschii (C. fritschii) cultures showing PC1 vs PC2 only. Each ring represents distribution of biological replicates. S1 = replicate 1, S2 = replicate 2, S3 = replicate 3.

