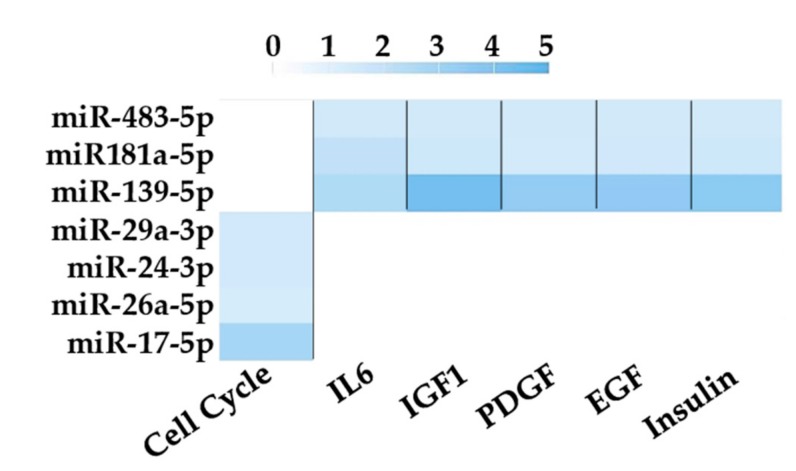
Figure 5.
Pathways analysis based on target genes of unique miRNAs using miRPathDB. Enriched pathways (p-value < 0.01) regulated by at least three miRNAs and their target genes are shown. Color code bar indicate the number of genes regulated by each specific miRNA for each pathway. Only validated miRNA–gene interactions were selected.

