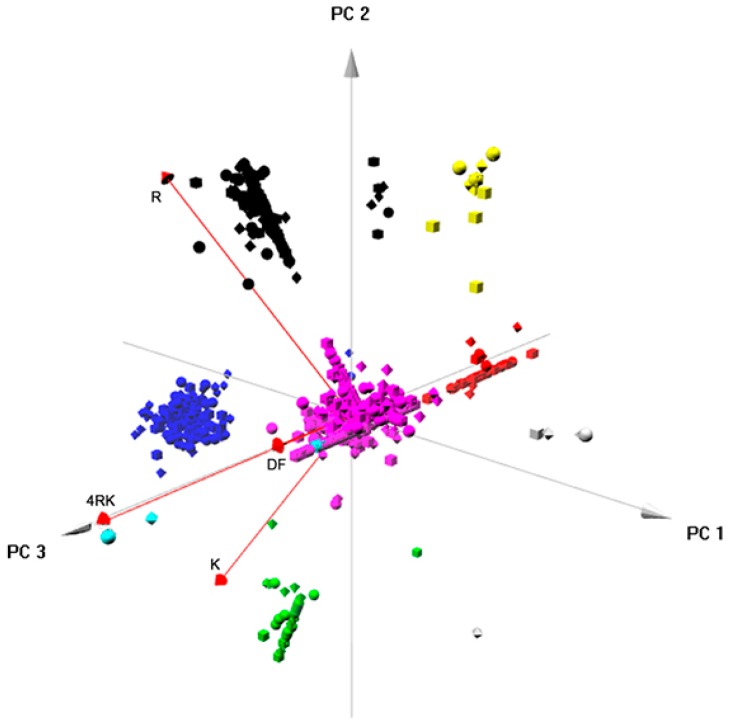
Figure 7.
Component analysis for the protein sets corresponding to the arginine-framed tripeptide-related checkpoint. PCA was performed using the package “pca3d” from R programming [31]. Data corresponding to the combinations of the median of the amount of each protein immunoprecipitated with each CFTR variant (or pulled-down with each set of peptides) calculated before were used for PCA analysis. The PCA scores corresponding to the three main components were plotted in a scatter plot in which the position along the axes shows the PCA score of the protein. Clustering was performed using hierarchical agglomerative clustering through the standard R function “hclust” and using average linkage as a clustering method.

