Abstract
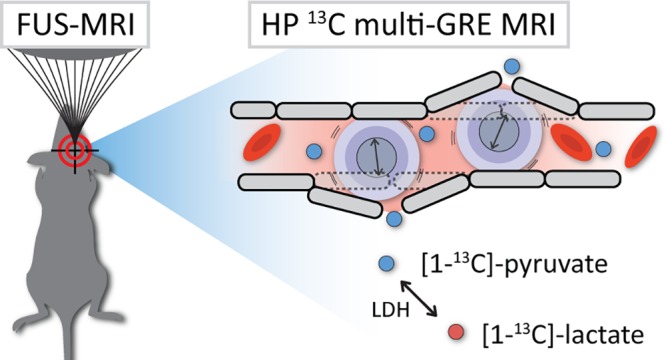
Imaging of hyperpolarized 13C-labeled substrates has emerged as an important magnetic resonance (MR) technique to study metabolic pathways in real time in vivo. Even though this technique has found its way to clinical trials, in vivo dynamic nuclear polarization is still mostly applied in preclinical models. Its tremendous increase in signal-to-noise ratio (SNR) overcomes the intrinsically low MR sensitivity of the 13C nucleus and allows real-time metabolic imaging in small structures like the mouse brain. However, applications in brain research are limited as delivery of hyperpolarized compounds is restrained by the blood–brain barrier (BBB). A local noninvasive disruption of the BBB could facilitate delivery of hyperpolarized substrates and create opportunities to study metabolic pathways in the brain that are generally not within reach. In this work, we designed a setup to apply BBB disruption in the mouse brain by MR-guided focused ultrasound (FUS) prior to MR imaging of 13C-enriched hyperpolarized [1-13C]-pyruvate and its conversion to [1-13C]-lactate. To overcome partial volume issues, we optimized a fast multigradient-echo imaging method (temporal resolution of 2.4 s) with an in-plane spatial resolution of 1.6 × 1.6 mm2, without the need of processing large amounts of spectroscopic data. We demonstrated the feasibility to apply 13C imaging in less than 1 h after FUS treatment and showed a locally disrupted BBB during the time window of the whole experiment. From detected hyperpolarized pyruvate and lactate signals in both FUS-treated and untreated mice, we conclude that even at high spatial resolution, signals from the blood compartment dominate in the 13C images, leaving the interpretation of hyperpolarized signals in the mouse brain challenging.
Keywords: Dynamic nuclear polarization, MRI, focused ultrasound, blood−brain barrier, 13C imaging, 7 T, mouse brain
Introduction
13C MR spectroscopy is an established MR technique for studying cellular metabolism. MR signals of 13C-enriched substrates and their products are used to unravel in vitro and in vivo metabolic pathways. However, its inherent low sensitivity makes it a challenging technique for in vivo imaging applications. This problem has been alleviated by dissolution dynamic nuclear polarization (DNP), a method resulting in a tremendously increased signal-to-noise ratio,1 allowing spatially resolved dynamic studies of uptake and metabolic conversion of 13C-labeled metabolites in real time. The hyperpolarized (HP) state of the substrates that is obtained by DNP is only short-lived and returns to thermal equilibrium with relaxation time constant T1. Therefore, as a requirement for imaging HP substrates, T1 relaxation times of the metabolites of interest need to be sufficiently long to allow cellular uptake and metabolic conversion to occur within the time the HP signal is present.2,3 The T1 of [1-13C]-pyruvate fulfills these requirements and has emerged as a typical in vivo precursor for targeting the cell’s energy metabolism in several organs of animals and humans.4,5
In the brain, the delivery of drugs, contrast agents, and HP molecules can be impeded by the blood–brain barrier (BBB), a gate keeping layer of tightly connected endothelial cells that separate brain tissue from vasculature.6−10 Only hydrophobic molecules <400 Da can freely pass the BBB.11 Uptake of metabolites is based on physiochemical characteristics and is regulated by specific facilitating transporters12 which can be influenced by age, diet, and anesthesia levels.13−15 Previous studies of the kinetics of pyruvate transport across the BBB distinguished a saturable (monocarboxylate transporter (MCT)-mediated) transport component, described by the Michaelis–Menten equation, from a nonsaturable free diffusion component in young rats.13,15 Transport constants for both components appeared to be lower for pyruvate compared to lactate, with a decreasing capacity of the saturable carrier in animals older than 2 weeks.13 A more recent study by Hurd et al.16 compared these pyruvate transport rates with labeled pyruvate to lactate fluxes and concluded that the latter are up to 100 times faster. On the basis of this, the assumption is made that most of the pyruvate pool in the brain parenchyma is represented by the observed hyperpolarized lactate pool. The remainder of the observed pyruvate signal is then considered to be in the blood compartment.
Despite the presence of facilitating MCTs in the brain,6 there are indications that the delivery of pyruvate to the brain parenchyma is limited,10,17,18 which makes pyruvate transport across the BBB a subject of debate. In brain tumors, the BBB’s restrictive aspects can be compromised due to a leaky vasculature. However, in tumors with areas with infiltrative growth patterns,19 blood vessels are intact and the BBB can still be a limiting factor in pyruvate transport. Furthermore, the BBB cannot be ignored when investigating the healthy brain.
Several methods have been proposed to chemically or mechanically compromise the barrier function, such as targeting endothelial surface receptors to activate transport by means of endo- and transcytosis.20 Another approach is to inject hypertonic solutions in order to cause endothelial cells to shrink, stretching the connective junctions of the BBB.18,21−24 A noninvasive method that recently gained interest is based on localized BBB disruption with focused ultrasound (FUS).25 In short, low-intensity FUS is combined with microbubbles (an ultrasound contrast agent) circulating in the vasculature. In the focal spot, ultrasound waves interact with the small gas bubbles and temporarily disassemble tight junction proteins, as proven in preclinical studies.26,27 In this context, we speculate that a bolus injection of HP pyruvate will saturate the rate-limited MCT-mediated transport across the BBB and that FUS treatment can potentially increase the transport capacity of the nonsaturable free diffusion transport component. Therefore, we expect an increase in pyruvate signal in the FUS-targeted area. On the basis of the rapid conversion of HP pyruvate to lactate and due to the low physiological blood lactate concentration compared to the level of injected pyruvate, which minimizes partial volume contributions, we also expect to observe a FUS-induced HP lactate signal.
As the disruptive effect of FUS is temporary, and the location can be precisely targeted with MR guidance, the combination of FUS-mediated BBB-opening with imaging HP compounds creates new opportunities to study brain metabolism. It potentially leads to enhanced uptake of small HP compounds in the brain and creates opportunities to study metabolic pathways of hyperpolarized metabolites (e.g., amino acids) for which brain access is restricted by the BBB.28 Next to this, assessing metabolic information with DNP after FUS treatment could also provide new insights in physiological or metabolic effects of the FUS treatment itself.
Preclinical brain research takes advantage of the many available mouse models for studying healthy and diseased brains. Hence, the number of potential applications for FUS-DNP is also high. However, it is becoming more and more apparent that metabolic imaging of hyperpolarized compounds in the brain is highly influenced by partial volume issues, as addressed recently.18 Observed signals in brain parenchyma are potentially biased or even dominated by signals from nearby vasculature, obscuring the detection of disease-, therapy-, or intervention-related metabolic alterations. An imaging approach with a high spatial resolution and high sensitivity is therefore a prerequisite to study metabolism in the small mouse brain.
In this work, we combine for the first time MR-guided focused ultrasound-induced BBB opening with fast, dynamic, high-resolution multigradient-echo (mGRE) 13C-MR imaging of hyperpolarized [1-13C]-pyruvate and [1-13C]-lactate in the mouse brain. We present a hybrid setup and show the technical feasibility of switching rapidly between both procedures without the need for animal repositioning. Finally, we discuss the effect of FUS-mediated BBB disruption on dynamic 13C MR imaging of hyperpolarized pyruvate and lactate in healthy mice.
Results and Discussion
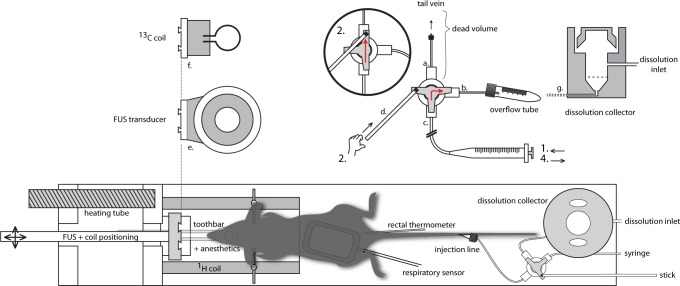
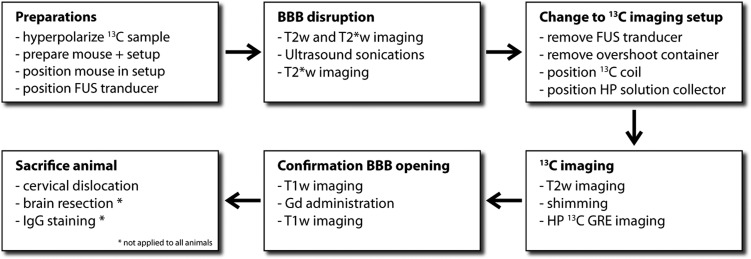
In order to perform 13C imaging directly after FUS treatment, we developed a setup with an interchangeable MR-compatible FUS transducer and 13C surface coil (Figure 1). A home-built injection system was attached to the setup and allowed us to administer small amounts of microbubbles, hyperpolarized pyruvate, and MR contrast agent inside the bore of the MR system, with a dead volume of only 50 μL. Altogether, this enabled in-bore MR-guided FUS of the brain followed by dynamic imaging of pyruvate and lactate with a temporal resolution of 2.4 s, a spatial resolution of 1.6 × 1.6 mm2, and four gradient echoes at each time point in the dynamic series. A schematic overview of all sequential MR and FUS procedures is shown in Figure 2.
Figure 1.
Schematic representation of the FUS-DNP setup. The injection setup is positioned behind the mouse (bottom right) and is clarified in more detail on the top right. (a) Connection of the three-way stopcock to the tail vein. (b) Connection for the overflow tube and dissolution collector. (c) Connected to a syringe for the injection of microbubbles or to a syringe filled with water for dissolution buffer administration. A stick (d) is attached to the stopcock to operate the tab from outside the MR bore. The FUS transducer (e) is mounted on a movable rod for transducer positioning. The transducer can be interchanged with the 13C coil (f). (g) Schematic cross section of the dissolution collector which replaced the overflow tube after FUS treatment. Operation of the injection setup is further clarified in the text.
Figure 2.
Flowchart of the in vivo FUS-DNP protocol.
Imaging parameters of the simultaneous dual-metabolite 13C imaging method were optimized by simulating the cumulative signal-to-noise ratio (SNR) as a function of the flip angle of the excitation pulse and the number of acquisitions needed to reconstruct multiple images at consecutive time points. We found an optimal flip angle of 10° that provided the highest total SNR for pyruvate over the first five imaging time points (24 phase encoding steps per image with a repetition time (TR) of 100 ms (Figure 3)). Phantom measurements with 13C-enriched pyruvate and lactate at thermal equilibrium confirmed that both the 13C carrier offset and readout bandwidth of the MRI experiment were properly chosen in order to separate the resonances based on chemical shift dispersion (Figure 4A). A second phantom with hyperpolarized [1-13C]-pyruvate—in absence of the enzyme lactate dehyrogenase (LDH), needed for conversion of pyruvate to lactate—did not show any contaminating signal at the lactate location. Instead, due to a high SNR in the phantom, we observed a small signal from pyruvate hydrate which can be formed in the injection solution under alkaline conditions29 (Figure 4B). Pyruvate hydrate was not detected in vivo.
Figure 3.
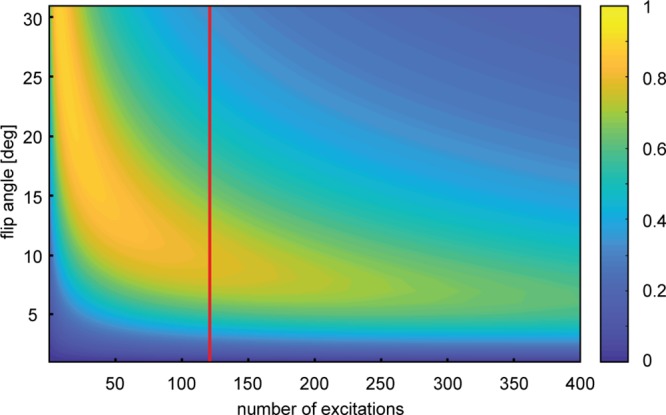
Simulation of cumulative SNR. Total SNR of pyruvate was simulated as a function of the flip angle and the number of excitations. Repetition time TR was set to 100 ms; pyruvate T1 was 35 s. Every image in the dynamic series is acquired with 24 excitations. Optimal flip angle was estimated after the acquisition of five images (corresponding to 120 excitations at the red line).
Figure 4.
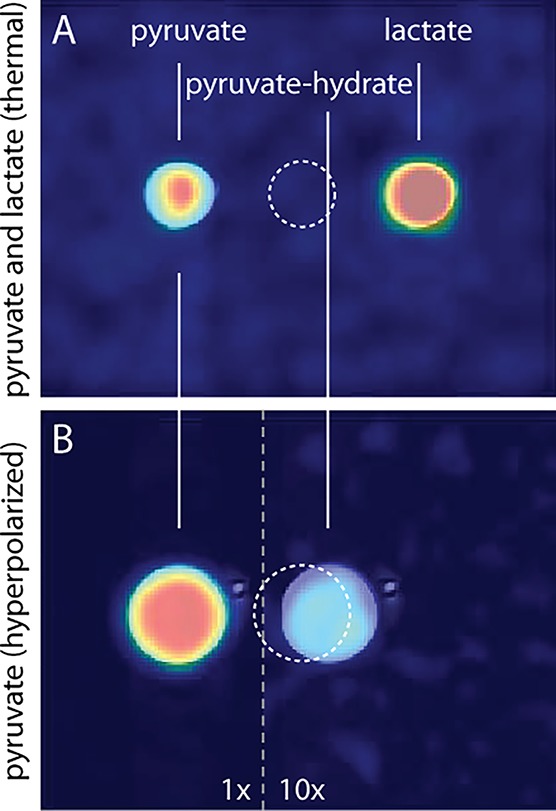
13C GRE images with registered T2w TSE 1H image overlays. The dashed circle indicates the true position of the sample. (A) Phantom containing 0.5 mL [1-13C]-pyruvate and [1-13C]-lactate at thermal equilibrium. (B) Phantom containing 1.5 mL dissolution buffer with hyperpolarized pyruvate. Due to the high concentration, also pyruvate hydrate (10× amplification) is detected.
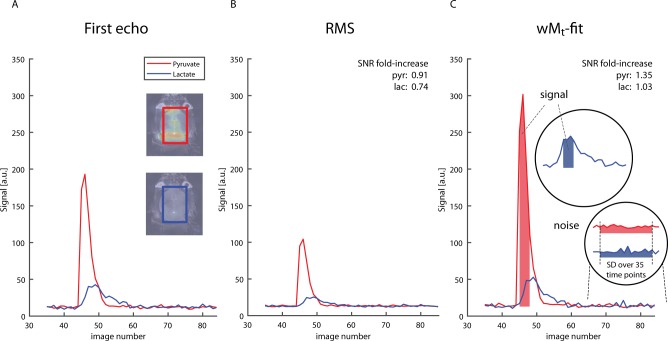
To increase SNR at each time point of the dynamic image series, we explored two methods to combine 13C multigradient-echo images that were acquired with different echo times (TEs) into one image. The first method is a straightforward root-mean-square (RMS) summation of four echoes; the second method estimates the initial magnetization at time TE = 0, using a weighted least-squares fitting algorithm (wMt). An example of four uncombined pyruvate magnitude images with an incrementing TE of one time point of the dynamic series is shown in Figure 5. The combined images were used to calculate time curves of the pyruvate and lactate signal from a region of interest (ROI) within the brain (Figure 6). Figure 6A shows the time curve of the signal intensity of the uncombined first echo images. B and C display time curves of the images that were combined with the RMS method and the wMt method, respectively. The average SNR of each ROI was calculated from the time points indicated in Figure 6C. SNR decreased when combining echoes with the RMS method. Especially in the case of lactate, with little signal in the third and fourth echo, the RMS-combined SNR decreased to 0.74 when compared to the SNR of the first echo alone. The wMt-fit method improved SNR for both lactate and pyruvate (3% and 35% increase, respectively, when compared to first echo SNR) and was therefore used throughout this work.
Figure 5.
HP 13C GRE magnitude images of the mouse brain, acquired at different echo times (8.2, 23.9, 39.5, and 55.1 ms).
Figure 6.
SNR comparison of two methods to combine multiecho GRE images. (A) ROI time curve of first echo images. The inset shows the position of the rectangular ROI covering the whole brain. (B) ROI time curve of root-mean-square images. (C) ROI time curves of weighted M0 images calculated with a weighted least-squares fitting routine. For both methods and the first echo images, pyruvate and lactate SNR were calculated from the mean pyruvate and lactate signal in the ROI at multiple time points (corrected for the noise level offset), divided by the standard deviation of the noise (assessed from the same ROI in the 35 last time frames after all of the hyperpolarized signal has decayed). The SNR of the images that were reconstructed with the wMt and the RMS method was expressed as a fold-increase compared to the SNR measured in the first echo images. The mouse in this example received FUS treatment.
In vivo uptake and metabolic conversion of HP [1-13C]-pyruvate was first studied in a glioma xenograft model in which the BBB is severely disrupted by the disease. Most of the pyruvate signal was observed in the posterior part of the brain, which can be associated with a high vascular density in this area. Pyruvate and lactate signals in the frontal cortex matched with the tumor location on the T2w background image (Figure 7A), indicating that, at the location of an impaired BBB, pyruvate locally extravasates and converts to or exchanges with lactate, which we can detect with high-resolution HP 13C imaging. In a second mouse model with an artificially induced stroke no HP pyruvate or lactate signal was detected in the part of the brain that was affected by the stroke (Figure 7B). The absence of perfusion in the stroke-affected area prevents injected HP pyruvate to reach this location, which indicates the obvious dependence of detecting pyruvate on brain perfusion. Extensive permeability, on the one hand, and almost complete lack of perfusion, on the other, illustrate the capabilities of our methodology in these two extreme cases.
Figure 7.
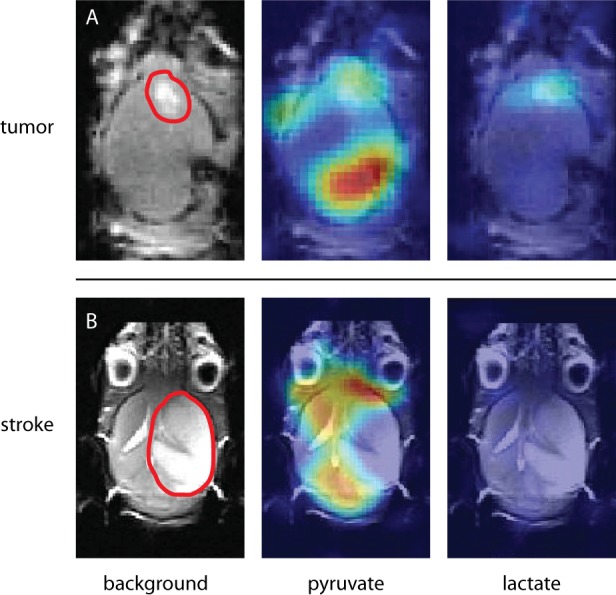
Models for impaired brain perfusion. (A) E478 orthotopic human xenograft of a IDH1-mutated oligodendroglioma. The model is known for developing leaky vessels around the tumor. A lesion in the frontal part of the brain is marked with a red line in the anatomical image (left). The observed enhanced pyruvate (middle) and lactate (right) signal matched with the marked area. The pyruvate signal in the posterior part of the brain was attributed to larger blood vessels. (B) Mouse with stroke induced by occluding the right middle cerebral artery for 30 min. The ischemic part is indicated with a red line. Pyruvate signal (middle) was observed throughout the whole brain, except in the ischemic area. No lactate was detected (right).
Focused ultrasound treatment was applied in eight mice, of which five had a successfully opened blood–brain barrier during 13C imaging as confirmed by Gd-contrast enhanced images (Figure 8). In all experiments, 13C imaging started within 35 to 55 min after FUS treatment. Additional IgG staining also confirmed successful BBB opening as the staining of the immunoreactive endogenous IgG matched with the targeted area. The cross-sectional diameter of the cigar-shaped focal spot was approximately 3 mm and covered the whole brain in the transverse direction as can be observed in the IgG-stained slides (Figure 8C).
Figure 8.
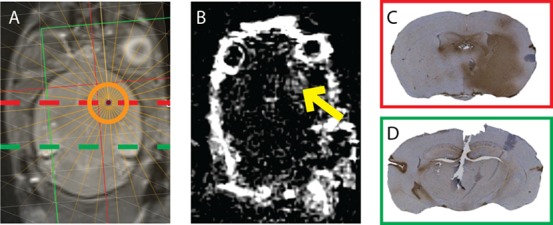
Verification of an opened BBB at the focused ultrasound target. (A) Aimed position of the focal spot of the FUS transducer, projected on a T2w anatomical image. (B) Post- minus pre-contrast T1w image showing signal enhancement in the area that was treated with focused ultrasound (arrow). The observed in-plane cross-section of the disrupted area was approximately 7 mm2. (C) IgG staining of a cross-sectional slice at the height of the focal spot (dashed red line). Brown color indicates immunoglobulin G that leaked into the tissue from the blood. (D) IgG staining of a cross-sectional slice at the height of the dashed green line. No leakage was observed.
In the five mice with an opened BBB, most of the pyruvate signal was observed in the posterior part of the brain. Examples of HP pyruvate and lactate images, acquired after successful FUS treatment, are shown in Figure 9A–D. Lactate was detected in two out of five mice that underwent successful FUS treatment and in two out of three mice in which FUS treatment was not successful. We did not observe a consistently increased pyruvate or lactate signal at the location of the FUS target compared to the contralateral hemisphere. Lactate signals in the posterior part of the brain matched with the location of observed pyruvate signals. In all five control animals, also most pyruvate was detected in the posterior part of the brain (Figure 8E). In two out of five controls, lactate was observed.
Figure 9.
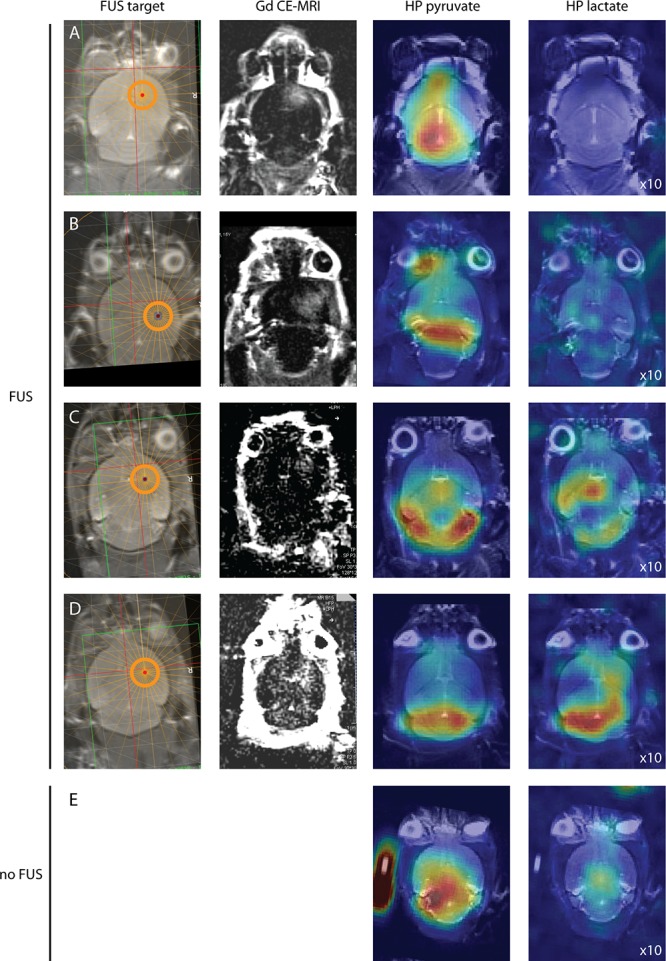
High-resolution 13C images of HP pyruvate and lactate in the healthy mouse brain after BBB opening. (A–D) Mice treated with focused ultrasound prior to 13C MRI. (E) Control experiment without FUS treatment. The first column indicates the location of the FUS target. The second column shows T1w contrast (postpre difference) images for BBB-opening verification. The last two columns show single time point images with maximum HP pyruvate and lactate signals. For displaying purposes, all lactate image intensities were scaled 10 times compared to the corresponding pyruvate images.
In a recent study, Miller et al. also investigated the limited transport of HP pyruvate and lactate across the BBB and concluded that the signal of endogenous lactate is below the detection level of the HP experiment.18 This suggests that the observed lactate signal in our nontreated animals originates from the blood and implies that partial volume effects from nearby vasculature have to be considered carefully.
Next to the presence of facilitating transporters and intercellular gaps induced by ultrasound, compound delivery can also be influenced by changes in cerebral blood flow (CBF).13,15 As has been shown in dog and human brains in vivo, anesthetics such as isoflurane have a vasodilative potential.30,31 An animal study with HP pyruvate revealed that higher doses of isoflurane resulted in increased pyruvate signals from the cerebral blood volume, whereas levels of metabolic products in the brain appeared to be unaffected.32 This suggests that either BBB functioning is not influenced by isoflurane sedation or, in the case of altered pyruvate transport, the BBB is actively keeping brain metabolite concentrations in a steady state. FUS itself induces a temporary lowering of the CBF. Nevertheless, blood flow is restored to pretreatment levels within several minutes.33 Therefore, these FUS-induced effects can be neglected at the time of our 13C imaging experiments.
Most studies investigating kinetics of compounds in the brain after FUS-induced BBB disruption focused on alterations in contrast enhancement and transport rates of common MR contrast agents of variable size. These studies reported enhanced contrast and increased contrast agent transport rates lasting multiple hours after applying FUS.34,35 Compound size was inversely correlated with the half closure time t1/2 (i.e., the time after FUS treatment, required for the delivery of 50% of the maximal dose).34 For Gd-containing compounds, t1/2 is approximately 5 h. We compared Gd-contrast enhanced images that were acquired directly after and ∼70 min after FUS treatment and concluded that the decrease in BBB permeability was indeed negligible for Gd within both time spans (Figure 10). Since in our experiments relatively large Gd-DTPA molecules (938 Da) were able to enter brain tissue at least up to 70 min after the FUS treatment, we argue that at the time of the DNP experiment the smaller pyruvate molecules (88 Da) could also pass the disrupted tight junctions. Interestingly, in the focal spot, we observed increasing Gd-contrast enhancement over time when sequential postcontrast images were acquired with a time lag of several minutes (Figure 10). This is in contrast with the hyper-intense regions around the eyes showing an immediate high-intensity signal that decays over time.
Figure 10.
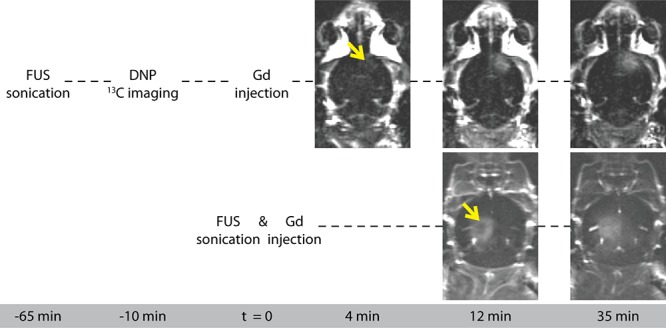
Gd-contrast enhanced T1w subtraction images (post- minus pre-contrast), acquired ∼4, ∼12, and ∼35 min after Gd administration. FUS treatment was applied ∼70 min (top row) and 12 min (bottom row) before the first T1w CE image was acquired. The arrow indicates the location of the FUS focal spot.
Gd accumulation in the focal spot during the first minutes after Gd administration has also been reported by others in rabbits but was not observed in rats.36,37 The kinetics of Gd uptake, directly after FUS treatment and intravenous injection of Gd, are not fully understood. It is not straightforward to quantify the extent of BBB opening for pyruvate from contrast-enhanced images, and therefore current results only give a rough indication of the transport dynamics of Gd-like large molecules in the focal spot. When comparing these results to the kinetics of Gd uptake and washout in tumor lesions,38,39 we speculate that the BBB permeability increase in healthy brain tissue by FUS is less than BBB disruptions and permeability in brain tumors. In one of the two extreme cases in our manuscript—the brain tumor model—this is what we observe for pyruvate perfusion and lactate formation as well. For pyruvate extravasation in FUS-mediated BBB disruption in healthy brain tissue, nonrestricted diffusion is likely to remain an important transport mechanism. A more rigorous disruption, e.g. by increasing the focal area or the acoustic pressure, could induce increased lactate formation. However, this is at risk of hemorrhages or other tissue damage. For mouse brain applications, we intentionally kept the size of the focal spot small, but more than large enough in relation to the spatial resolution of our HP MRI experiments.
Taken together, a small increase in permeability, relative to the free diffusion component, can explain why we did not detect small FUS-induced differences in HP pyruvate and lactate signals within the time frame of the HP experiment. Also when considering HP pyruvate signal accumulation over multiple time points, we still could not distinguish FUS-targeted from untargeted areas (Figure 11). We compared these summed results to published micro-CT data illustrating a dorsal whole-brain projection of the cerebral vasculature40 (Figure 11D) and observed an alignment of pyruvate signal with densely vascularized structures in the CT image. Again, this points to contributions from the vascular system dominating the observed images, even at high spatial resolution.
Figure 11.

Three representations of summed HP 13C images (5–7 time points, 2.4 s per time point). (A,B) Mice treated with FUS, frontal right; (C) nontreated mouse. (D) Micro-CT image of a projection of all blood vessels in the mouse brain. 13C signal intensities align with densely vascularized areas. Reprinted with permission from ref (40). Copyright 2013, Elsevier.
A recent study by Takado et al. described increased uptake of administered HP lactate after BBB disruption with nonlocalized ultrasound irradiation.41 In this study, whole-brain effects of BBB opening were investigated by means of pulse-acquire coil-localized MR spectroscopy. This whole-brain approach demonstrates that the BBB can be opened for small HP compounds. Since the sonicated volume is much smaller when applying FUS, it is more challenging to detect changes in permeability. In addition, it seems reasonable that differences in sonication parameters also explain why the whole-brain results were not reproduced in focal spots. High frequencies, high acoustic pressures, and long exposure times (>300 s at 0.47 MPa) are associated with tissue damage, which may obscure the interpretation of the effects of BBB opening.42,43 As we carefully selected our sonication frequency, exposure time, and acoustic pressure to prevent tissue damage, brain tissue integrity is much less challenged. As a consequence, the change in BBB permeability might also have been smaller. On the other hand, skull penetration is improved when sonicating at lower frequencies. Therefore, future studies are required to investigate the range of FUS parameters that can be applied to induce detectable permeability changes, without causing tissue damage.
Since we successfully imaged localized differences in pyruvate and lactate signals that matched with a diseased tumor or stroke area, but did not detect consistent FUS-induced local alterations in HP signals, we argue that detection of smaller and/or slower nuances in signal intensities requires a higher sensitivity. The threshold at which differences become apparent could be lowered by selecting larger voxels, leading to higher SNR, but this inevitably introduces more partial volume issues with vascular or adjacent tissue. In Figure 9E, tubing from the injection setup, filled with HP pyruvate, is positioned next to the mouse head and gives an impression to what extent large signals can interfere with surrounding voxels at a nominal resolution of 1.6 mm2. A possible way to gain SNR is to optimize hyperpolarization (e.g., by using a different radical) and to further optimize the image acquisition method. FUS-induced compound delivery can also become more apparent if the metabolites of interest depend more on saturable transporters than on the diffusive component. From this perspective, it could be interesting to image amino acids like glutamate,44 or other metabolites that are relevant to brain metabolism. Nevertheless, challenges emerging from relatively short T1 relaxation times, solubility, blood concentration limitations, and possible toxicity have to be investigated and overcome for these metabolites to become applicable in vivo in humans. A recent study challenged these limitations by investigating hyperpolarized glutamate uptake in the rat brain after BBB disruption with a hyperosmolar agent.45 However, the described surgical procedure to partially disrupt the BBB is rather invasive, which points to focused ultrasound as a valuable alternative.
Unlike most MR spectroscopic imaging approaches presented in the literature, the use of imaging sequences for HP metabolic imaging is less widely explored.46−50 When interested in particular HP metabolites only, the presented mGRE method is a fast imaging method to obtain metabolic maps directly, without the need of postprocessing large amounts of spectroscopic data. A single time point acquisition at similar resolution could further improve SNR, as it allows larger flip angles, but will be at the cost of dynamic information. A major drawback of the GRE method is that taking advantage of chemical shift dispersion to separate resonances requires low readout gradient amplitudes, which inherently dictates relatively long echo times. When aiming for higher resolutions, even lower gradient amplitudes are required. This opposes the usefulness of the method since at current SNR, typical T2* decay does not allow much longer echo times. A way to get around these limitations is by separating resonances based on their phase difference in two or more images with different echo times. Techniques with a Dixon or variable projection (VARPRO) approach, as used to separate 1H resonances of water and fat,51 can be performed with very short echo times and at low SNR and therefore are promising future applications of high-resolution HP imaging.
Conclusion
We showed the technical feasibility of combining MR-guided FUS with DNP within an appropriate experimental time window and introduced a setup that includes a mechanism to administer small volumes of ultrasound contrast agent, hyperpolarized pyruvate, and Gd contrast agent without air bubbles and with minimal dead volume inside the magnet. In contrast to most existing studies based on MR spectroscopic imaging of HP substrates, we acquired multigradient-echo 13C images at a high temporal and spatial resolution in mice. We conclude that, even at a high spatial resolution, signals from vasculature dominate the image and that changes in BBB permeability for pyruvate and lactate were below the detection limit of our experimental method. Although we could not observe enhanced pyruvate uptake and/or lactate conversion as a result of FUS treatment, our approach proposes new ways to locally study the uptake dynamics of other hyperpolarized metabolites for which the BBB may limit access to the brain.
Methods
All experiments involving animals were conducted according to institutional guidelines and regulations and were approved by the Central Animal Experiments Committee (CCD) and the local animal welfare body.
Animal Preparation
In this study, two diseased and 22 healthy balb/c or nude balb/c mice were included, of which seven were used to optimize the 13C imaging method, seven were used as controls for 13C MRI or FUS treatment, and eight received both FUS treatment and 13C MRI. The two diseased animals only received HP 13C MRI. The animals were kept under specific pathogen-free conditions in the Central Animal Laboratory of Radboud University (Nijmegen, The Netherlands).
A catheter was placed in the tail vein before anesthetic induction using isoflurane gas at a 4.0% gas–air mixture. During the preparations and experiment, the anesthetic isoflurane concentration was adjusted to 1–2% and carried by a 2:1 mixture of medical air and oxygen. The heads of the sedated animals that underwent BBB disruption were shaved. During all experiments, body temperature was measured using a rectal thermometer and maintained using heated air. At the end of the experiment, the animals were sacrificed by cervical dislocation. In three mice, the brain was immediately resected and stored in formalin for immunohistochemical analysis.
Experimental Setup
The animal was placed in prone position in the MR-compatible animal FUS system (Image Guided Therapy, Pessac, France), and its head was fixed in a dedicated MR 1H coil. For the BBB disruption experiments, the six-channel annular array FUS transducer (frequency 650 kHz, focal length 30 mm, diameter 30 mm) was attached to a positioning system and coupled to the head of the animal with an expandable balloon filled with degassed water. A home-built injection system was developed to enable injection of small amounts of microbubbles in the animal inside the 7T preclinical MR system (ClinScan, Bruker BioSpin, Rheinstetten, Germany). Following the letters and numbers in Figure 1, the setup works as follows: The injection system consisted of a three-way stopcock connected to the tail vein catheter (a), an overflow tube (b), and a thin tube (0.4 mm inner diameter (i.d.)) (c) connected to a syringe outside the MR system. The tap of the stopcock was connected to a long stick (d) that enabled operation of the tap from outside the MR bore. The tubing was filled with microbubbles from a syringe outside the magnet bore (1) just before sonication, with the tap turned to the overflow tube. Then, when the sonication started, the tap was turned (2) and the microbubbles were injected (1) from the tubing (c) into the tail vein (a), minimizing the dead volume substantially.
After the ultrasound procedure, the setup was taken out of the scanner. The animal remained in place for the HP 13C MR examination. The FUS transducer (e) was quickly removed and replaced by a 13C MR surface coil (f), which was positioned on the head of the animal. The overflow tube of the injection system was replaced by a small reservoir (g) to collect the hyperpolarized buffer solution. Outlet c was connected with 0.9 mm i.d. tubing filled with water and an empty syringe outside the MR system. The setup was then moved back inside the magnet and both the 1H and 13C MR coils were tuned and matched. In order to inject the collected hyperpolarized solution, material was sucked up with the syringe (4) from the collector and reinjected (1) into the tail vein catheter after switching the tap with the stick (2). With this method, the dead volume was only 50 μL, and injection could take place within 15 s after dissolution.
MR-Guided Local BBB Disruption
Fast gradient echo images were acquired to localize the brain and the transducer. Next, axial T2-weighted (T2w) and T2*-weighted (T2*w) images were obtained to aim the focal spot of the FUS transducer at the left or right prefrontal cortex. After adjusting the location of the FUS transducer using Thermoguide software (Image Guided Therapy, Pessac, France), we confirmed the absence of air bubbles between the mouse head and transducer in coronal GRE images to ensure acoustic coupling of the transducer with the mouse brain. Subsequently, the tubing of the injection system was filled with microbubbles (SonoVue, Bracco Imaging S.p.A., Italy), diluted 10 times with saline. At the start of the sonication (10 ms bursts, burst repetition frequency 1 Hz, duration 120 s, amplitude 0.2 MPa), microbubbles were injected at 1.8 mL/kg. At low ultrasound intensities, FUS-mediated BBB opening is noninvasive and reversible. Ultrasound power levels are influenced by the thickness of the skull and were carefully optimized in a pilot study to achieve a proper penetration depth.
After the sonications, T2*w imaging was repeated to confirm no FUS-induced microhemorrhages occurred.
Preparation of Hyperpolarized [1-13C]-Pyruvate
A total of 44 mg of isotopically enriched sodium [1-13C]-pyruvate was dissolved in a 160 μL mixture of D2O and deuterated ethanol (2:1), containing 30 mM 4-hydroxy-2,2,6,6-tetramethylpiperidin-1-oxyl (TEMPOL). All chemicals were ordered from Sigma-Aldrich (St. Louis, MO). Small droplets (±10 μL) of the mixture were pipetted into liquid nitrogen to form glassed beads. The beads were collected in a Teflon container and placed in an in-house-built polarizer as described before.52 The sample was polarized at 1.25 K and 3.38 T using continuous microwave irradiation at 95.05 GHz until maximum solid-state polarization was reached (∼1 h). At the time of the 13C imaging procedure, the polarized beads were rapidly dissolved in 4 mL of Tris-EDTA buffer solution (10 mM/1 mM) and collected inside the MR system, yielding a final [1-13C]-pyruvate concentration of 80 mM at a temperature of approximately 30 °C. Within 15 s after dissolution, a volume of 300 μL was injected in the animals using the injection system as described above.
13C MR Imaging Method
For 13C imaging we used a fast slice selective GRE sequence to enable simultaneous multimetabolite imaging based on chemical shift dispersion.48,53 Due to a difference in chemical shift (Δω), images of different resonances can be separated by choosing proper values for the field of view (FOV) and the readout bandwidth BW (in Hz/pixel), dependent on the width of the object (Wobj). To prevent overlapping images the distance (Δx) between the centers of two images with two different resonances must be larger than Wobj:
To enclose two images that are separated completely, and to prevent aliasing, the width of the FOV (WFOV) must be larger than 2 × Wobj plus the additional space in between the shifted images. This can also be expressed as
At a certain resolution of interest, the corresponding readout bandwidth can be calculated according to
with Matrixx the image matrix size in the readout direction in pixels, Δω the frequency difference in Hz, and WFOV and Δx in mm.
Protocol optimization led to a 13C image acquisition protocol with a 32 × 24 imaging matrix and a FOV of 50 × 38 mm in the frequency and phase encoding directions, respectively, yielding a nominal in-plane resolution of 1.6 × 1.6 mm. Good separation of pyruvate and lactate signals (Δω = 920 Hz at 7 T) was achieved by setting the readout bandwidth to 70 Hz/pixel and placing the 13C carrier frequency in between the pyruvate and lactate resonance frequencies to image both metabolites with an equal but opposite shift from the center frequency. With a TR of 100 ms and 24 phase encoding steps , the total acquisition time per image was 2.4 s. Per excitation, four echoes were acquired with echo times of 8.2, 23.9, 39.5, and 55.1 ms using monopolar or “flyback” readout gradients. Thickness of the imaging slice was 6–8 mm. Chemical shift dispersion in the slice selection plane was minimized by using an excitation pulse with a bandwidth of 15 kHz.
Since the total polarization in a DNP experiment is not at equilibrium and decays with T1 of the 13C nucleus in the substrate, only small flip angles were applied for the multiple acquisitions needed to form an image. The optimal flip angle for using the hyperpolarized magnetization across multiple images was determined by simulating the total signal-to-noise ratio (SNRT) in Matlab (The MathWorks, Natick, MA) at a fixed TR of 100 ms as a function of the flip angle and a variable number of excitations, assuming a T1 relaxation constant of 35 s for pyruvate, which was extrapolated from previously reported values.54−56 Total SNR was defined as the total signal obtained (calculated as the sum of all signals) divided by the noise (given as the square root of the number of experiments):
with M0 the initial magnetization after hyperpolarization, n the number of acquisitions, θ the flip angle, TR the repetition time, and T1 the longitudinal relaxation constant.
Imaging Method Validation
The imaging method was validated with a phantom at thermal equilibrium (no hyperpolarization), containing [1-13C]-pyruvate and [1-13C]-lactate doped with a TEMPOL radical to shorten the intrinsic T1 relaxation times. The phantom was imaged with eight averages at the same resolution as the in vivo scans, using a flip angle of 16° and a TR of 500 ms. Another phantom was filled through the injection system with 1.5 mL of dissolution buffer containing 80 mM hyperpolarized [1-13C]-pyruvate. 13C imaging parameters were the same as those used for 13C in vivo measurements.
In Vivo13C MRI
To serve as a surrogate model for a disrupted BBB and/or increased brain perfusion, we first imaged a mouse bearing an orthotopic human xenograft brain tumor.57 Impaired brain perfusion was mimicked in a second mouse model with an induced stroke.58 Next, in five healthy mice, 13C high-resolution MRI was performed without BBB disruption and in eight mice after BBB disruption. The 13C MRI exams started with the acquisition of multislice T2w 1H turbo spin echo (TSE) images with a slice thickness of 1 mm in the dorsal plane, for registration of the 13C images to the anatomical background image. The brain was centered in a FOV of 50 × 50 mm with a matrix size of 256 × 256 points. TR was 2950 ms, and TE was 36 ms with 37 echo trains per slice. A volume surrounding the mouse brain was shimmed with an automated routine followed by manual fine-tuning. The FOV for 13C MRI was positioned exactly the same as the FOV of the reference images. 13C MRI was performed with the parameters and procedures described above.
Image Postprocessing
Raw 13C image data were processed and analyzed in Matlab using a dedicated in-house-built image viewer. Background images were registered to the 13C images based on the calculated chemical shift displacement Δx.
13C image quality was improved by zero-filling the complex data in the frequency domain to double resolution after a 2D Hamming filter was applied. Subsequently, magnitude images were created for further analysis.
In order to combine the signal of the four echoes that were acquired at each time point, we explored a weighted Mt fit (wMt) and a root-mean-square (RMS) summation method. For the wMt fit, per acquired time point t, the four gradient echoes were used to generate Mt maps by pixel-wise fitting the following function to the data with a weighted least-squares fitting algorithm:
with S(TE)t the pixel signal intensity of the magnitude image at echo time TE, T2* the fitted T2* value in a specific pixel, and Mt the magnetization at TE = 0 of each image in the dynamic series.
For the RMS method, the combined signal (SRMS,t) of each image in the dynamic series was calculated according to
with m the number of acquired echoes and S(TEk)t the signal in a certain pixel of the image at time t in the dynamic series at echo time TEk.
To compare signal-to-noise ratios, a rectangular region of interest (ROI) of the size of the brain was drawn in the anatomical image and registered to the locations where pyruvate and lactate signals were observed, based on their calculated chemical shift dispersion. For both the wMt and RMS method, the SNR in these ROIs was compared with the SNR of pyruvate and lactate in the first echo image. SNR was defined as the mean signal intensity of all pixels from the selected ROI at selected time points, divided by the standard deviation of all pixels values from that same ROI during 35 time points acquired after the hyperpolarized signal had completely decayed. As a result of processing images in magnitude mode, the noise level is biased, resulting in a noise level offset. For SNR calculations, all magnitude images were corrected for this offset by subtracting the mean noise level which was assessed from the 35 images without a signal.
In order to further increase SNR for detecting FUS-induced signal enhancement, we also combined wMt images of multiple time points to obtain a single static image using a squared summation:
with ST the total signal and k the kth image of l total images to be summed.
Gd-Contrast Enhanced Imaging
After hyperpolarized 13C MRI in the mice that underwent BBB disruption, T1-weighted (T1w) images were obtained before and after administration of a gadolinium-based MRI contrast agent (Magnevist, Bayer HealthCare Pharmaceuticals Inc., Wayne, NJ) at a dose of 2.5 mL/kg. As the gadolinium particles remain in the brain parenchyma for over an hour after BBB disruption, we chose to perform contrast-enhanced imaging at the end of the examination, to prevent a possible effect of gadolinium on the longitudinal relaxation of pyruvate and its metabolic products. A hyper-intense region on postcontrast T1w images and on post- minus pre-contrast images indicates permeability of the brain vasculature, which was used to confirm successful disruption of the BBB. As a control, to investigate the extent of BBB closure over time after the HP experiment, in two mice, CE T1w images were acquired directly after FUS treatment.
IgG-Immunostaining
As the serum antibody immunoglobulin G (IgG) is not leaving the brain circulation when the BBB is intact, we also confirmed BBB leakage by performing immunohistochemical (IHC) staining of endogenous IgG on multiple 4-μm-thick sections of formalin-fixed paraffin-embedded brain tissue of the mice that underwent FUS-mediated BBB opening. After epitope retrieval by boiling in citrate at pH 6.0 (Klinipath, Duiven, The Netherlands), slides were blocked for endogenous peroxidase with 3% H2O2 and with normal horse serum (Gibco, Waltham, MA) and incubated with horse-antimouse IgG antibodies (H+L) (ThermoFisher, Waltham, MA). Mouse-IgG was detected with an avidin–biotin HRP complex kit (PK6100, VectorLabs, Burlingame, CA) and stained with DAB (3,3′-diaminobenzidine). IHC sections were counterstained with hematoxylin and mounted with QuickD mounting medium (Klinipath).
Acknowledgments
We would like to thank all biotechnicians of the Preclinical Imaging Center Nijmegen for their help with preparing in vivo experiments, and we thank F. H. A. van Heijster and M. Wiesmann for their assistance with performing DNP experiments.
Glossary
Abbreviations
- BBB
blood–brain barrier
- BW
bandwidth
- CBF
cerebral blood flow
- CCD
central animal experiments committee
- CT
computed tomography
- D2O
deuterated water
- DNP
dynamic nuclear polarization
- EDTA
ethylenediaminetetraacetic acid
- FOV
field of view
- FUS
focused ultrasound
- GRE
gradient-echo
- HP
hyperpolarized
- IgG
immunoglobulin G
- IHC
immunohistochemical
- M0
initial magnetization
- MCT
monocarboxylate transporter
- mGRE
multigradient echo
- MR
magnetic resonance
- MRI
magnetic resonance imaging
- RMS
root-mean-square
- ROI
region of interest
- S
signal intensity
- SNR
signal-to-noise ratio
- SNRT
total signal-to-noise ratio
- ST
total signal
- TE
echo time
- TEMPOL
4-hydroxy-2,2,6,6-tetramethylpiperidin-1-oxyl
- TR
repetition time
- TSE
turbo spin–echo
- VARPRO
variable projection
- WFOV
width of field of view
- wMt
weighted Mt
- Wobj
object width
Author Contributions
DNP experiments were designed by T.H.P., A.V., V.B., and T.W.J.S. FUS experiments were designed by T.K. T.H.P. and T.K. conducted all animal experiments assisted by A.V. and V.B., supervised by A.H. and T.W.J.S. K.L. performed IHC staining. Results were analyzed by T.H.P., T.K., and T.W.J.S. and interpreted by T.H.P., T.K., V.B., A.H., and T.W.J.S. T.H.P. and T.K. wrote the manuscript. All authors read and approved the final manuscript.
This research was supported by the Dutch Cancer Society (BUIT 2013-5861, MR-guided HIFU for targeted drug delivery in the brain), PET-MRI probe (SEB 2011-020637), and Europees Fonds voor Regionale Ontwikkeling/Gelderland Overijssel Gebundelde Innovatiekracht (Ultrasense NMR).
The authors declare no competing financial interest.
References
- Ardenkjaer-Larsen J. H.; Fridlund B.; Gram A.; Hansson G.; Hansson L.; Lerche M. H.; Servin R.; Thaning M.; Golman K. (2003) Increase in signal-to-noise ratio of > 10,000 times in liquid-state NMR. Proc. Natl. Acad. Sci. U. S. A. 100, 10158–10163. 10.1073/pnas.1733835100. [DOI] [PMC free article] [PubMed] [Google Scholar]
- Karlsson M.; Jensen P. R.; Duus J.; Meier S.; Lerche M. H. (2012) Development of Dissolution DNP-MR Substrates for Metabolic Research. Appl. Magn. Reson. 43, 223–236. 10.1007/s00723-012-0336-7. [DOI] [Google Scholar]
- Keshari K. R.; Wilson D. M. (2014) Chemistry and biochemistry of 13C hyperpolarized magnetic resonance using dynamic nuclear polarization. Chem. Soc. Rev. 43, 1627–1659. 10.1039/C3CS60124B. [DOI] [PMC free article] [PubMed] [Google Scholar]
- Kurhanewicz J.; Vigneron D. B.; Brindle K.; Chekmenev E. Y.; Comment A.; Cunningham C. H.; DeBerardinis R. J.; Green G. G.; Leach M. O.; Rajan S. S.; Rizi R. R.; Ross B. D.; Warren W. S.; Malloy C. R. (2011) Analysis of Cancer Metabolism by Imaging Hyperpolarized Nuclei: Prospects for Translation to Clinical Research. Neoplasia 13, 81–97. 10.1593/neo.101102. [DOI] [PMC free article] [PubMed] [Google Scholar]
- Comment A.; Merritt M. E. (2014) Hyperpolarized Magnetic Resonance as a Sensitive Detector of Metabolic Function. Biochemistry 53, 7333–7357. 10.1021/bi501225t. [DOI] [PMC free article] [PubMed] [Google Scholar]
- Abbott N. J.; Patabendige A. A. K.; Dolman D. E. M.; Yusof S. R.; Begley D. J. (2010) Structure and function of the blood-brain barrier. Neurobiol. Dis. 37, 13–25. 10.1016/j.nbd.2009.07.030. [DOI] [PubMed] [Google Scholar]
- Pardridge W. M. (2005) The blood-brain barrier: Bottleneck in brain drug development. NeuroRx 2, 3–14. 10.1602/neurorx.2.1.3. [DOI] [PMC free article] [PubMed] [Google Scholar]
- Saunders N. R.; Dreifuss J.-J.; Dziegielewska K. M.; Johansson P. A.; Habgood M. D.; Møllgård K.; Bauer H.-C. (2014) The rights and wrongs of blood-brain barrier permeability studies: a walk through 100 years of history. Front. Neurosci. 8, 1–26. 10.3389/fnins.2014.00404. [DOI] [PMC free article] [PubMed] [Google Scholar]
- Guillevin R.; Herpe G.; Verdier M.; Guillevin C. (2014) Low-grade gliomas: The challenges of imaging. Diagn. Interv. Imaging 95, 957–963. 10.1016/j.diii.2014.07.005. [DOI] [PubMed] [Google Scholar]
- Hurd R. E.; Yen Y. F.; Mayer D.; Chen A.; Wilson D.; Kohler S.; Bok R.; Vigneron D.; Kurhanewicz J.; Tropp J.; Spielman D.; Pfefferbaum A. (2010) Metabolic imaging in the anesthetized rat brain using hyperpolarized [1- 13C] pyruvate and [1- 13C] ethyl pyruvate. Magn. Reson. Med. 63, 1137–1143. 10.1002/mrm.22364. [DOI] [PMC free article] [PubMed] [Google Scholar]
- Pardridge W. M. (2012) Drug transport across the blood-brain barrier. J. Cereb. Blood Flow Metab. 32, 1959–1972. 10.1038/jcbfm.2012.126. [DOI] [PMC free article] [PubMed] [Google Scholar]
- Banks W. A. (2016) From blood-brain barrier to blood-brain interface: New opportunities for CNS drug delivery. Nat. Rev. Drug Discovery 15, 275–292. 10.1038/nrd.2015.21. [DOI] [PubMed] [Google Scholar]
- Cremer J. E.; Cunningham V. J.; Pardridge W. M.; Braun L. D.; Oldendorf W. H. (1979) Kinetics of Blood-Brain Barrier Transport of Pyruvate, Lactate and Glucose in Suckling, Weanling and Adult Rats. J. Neurochem. 33, 439–445. 10.1111/j.1471-4159.1979.tb05173.x. [DOI] [PubMed] [Google Scholar]
- Pardridge W. M. (1983) Brain metabolism: a perspective from the blood-brain barrier. Physiol. Rev. 63, 1481–1535. 10.1152/physrev.1983.63.4.1481. [DOI] [PubMed] [Google Scholar]
- Miller L. P.; Oldendorf W. H. (1986) Regional Kinetic Constants for Blood–Brain Barrier Pyruvic Acid Transport in Conscious Rats by the Monocarboxylic Acid Carrier. J. Neurochem. 46, 1412–1416. 10.1111/j.1471-4159.1986.tb01756.x. [DOI] [PubMed] [Google Scholar]
- Hurd R. E.; Yen Y. F.; Tropp J.; Pfefferbaum A.; Spielman D. M.; Mayer D. (2010) Cerebral dynamics and metabolism of hyperpolarized 1- 13 Cpyruvate using time-resolved MR spectroscopic imaging. J. Cereb. Blood Flow Metab. 30, 1734–1741. 10.1038/jcbfm.2010.93. [DOI] [PMC free article] [PubMed] [Google Scholar]
- Park I.; Larson P. E. Z.; Zierhut M. L.; Hu S.; Bok R.; Ozawa T.; Kurhanewicz J.; Vigneron D. B.; VandenBerg S. R.; James C. D.; Nelson S. J. (2010) Hyperpolarized 13C magnetic resonance metabolic imaging: Application to brain tumors. Neuro. Oncol. 12, 133–144. 10.1093/neuonc/nop043. [DOI] [PMC free article] [PubMed] [Google Scholar]
- Miller J. J.; Grist J. T.; Serres S.; Larkin J. R.; Lau A. Z.; Ray K.; Fisher K. R.; Hansen E.; Tougaard R. S.; Nielsen P. M.; Lindhardt J.; Laustsen C.; Gallagher F. A.; Tyler D. J.; Sibson N. (2018) 13C Pyruvate Transport Across the Blood-Brain Barrier in Preclinical Hyperpolarised MRI. Sci. Rep. 8, 15082. 10.1038/s41598-018-33363-5. [DOI] [PMC free article] [PubMed] [Google Scholar]
- Claes A.; Idema A. J.; Wesseling P. (2007) Diffuse glioma growth: A guerilla war. Acta Neuropathol. 114, 443–458. 10.1007/s00401-007-0293-7. [DOI] [PMC free article] [PubMed] [Google Scholar]
- Blasi P.; Giovagnoli S.; Schoubben A.; Ricci M.; Rossi C. (2007) Solid lipid nanoparticles for targeted brain drug delivery. Adv. Drug Delivery Rev. 59, 454–477. 10.1016/j.addr.2007.04.011. [DOI] [PubMed] [Google Scholar]
- Kroll R. A.; Neuwelt E. A. (1998) Outwitting the blood-brain barrier for therapeutic purposes: Osmotic opening and other means. Neurosurgery 42, 1083–1100. 10.1097/00006123-199805000-00082. [DOI] [PubMed] [Google Scholar]
- Doolittle N. D.; Miner M. E.; Hall W. A.; Siegal T.; Hanson E. J.; Osztie E.; McAllister L. D.; Bubalo J. S.; Kraemer D. F.; Fortin D.; Nixon R.; Muldoon L. L.; Neuwelt E. A. (2000) Safety and efficacy of a multicenter study using intraarterial chemotherapy in conjunction with osmotic opening of the blood-brain barrier for the treatment of patients with malignant brain tumors. Cancer 88, 637–647. . [DOI] [PubMed] [Google Scholar]
- Rapoport S. I. (2000) Osmotic opening of the blood-brain barrier: Principles, mechanism, and therapeutic applications. Cell. Mol. Neurobiol. 20, 217. 10.1023/A:1007049806660. [DOI] [PubMed] [Google Scholar]
- Bellavance M.-A.; Blanchette M.; Fortin D. (2008) Recent Advances in Blood–Brain Barrier Disruption as a CNS Delivery Strategy. AAPS J. 10, 166–177. 10.1208/s12248-008-9018-7. [DOI] [PMC free article] [PubMed] [Google Scholar]
- Hynynen K.; McDannold N.; Vykhodtseva N.; Jolesz F. A. (2001) Noninvasive MR Imaging–guided Focal Opening of the Blood-Brain Barrier in Rabbits. Radiology 220, 640–646. 10.1148/radiol.2202001804. [DOI] [PubMed] [Google Scholar]
- Shang X.; Wang P.; Liu Y.; Zhang Z.; Xue Y. (2011) Mechanism of low-frequency ultrasound in opening blood-tumor barrier by tight junction. J. Mol. Neurosci. 43, 364–369. 10.1007/s12031-010-9451-9. [DOI] [PubMed] [Google Scholar]
- Ford J. A.; Bell J.; Edwards C. (2011) Are we meeting cardiovascular risk targets 3 years after acute coronary syndrome? An evaluation in West Auckland, New Zealand. N. Z. Med. J. 124, 65–75. [PubMed] [Google Scholar]
- Hawkins R. A.; O’Kane R. L.; Simpson I. A.; Viña J. R. (2006) Structure of the Blood–Brain Barrier and Its Role in the Transport of Amino Acids. J. Nutr. 136, 218S–226S. 10.1093/jn/136.1.218S. [DOI] [PubMed] [Google Scholar]
- Golman K.; in ’t Zandt R.; Thaning M. (2006) Real-time metabolic imaging. Proc. Natl. Acad. Sci. U. S. A. 103, 11270–11275. 10.1073/pnas.0601319103. [DOI] [PMC free article] [PubMed] [Google Scholar]
- Cucchiara R. F., Theye R. A., and Michenfelder J. D. (1974) The effects of isoflurane on canine cerebral metabolism and blood flow, in Anesthesiology, pp 571–574, American Society of Anesthesiologists. [DOI] [PubMed] [Google Scholar]
- Schlünzen L.; Cold G. E.; Rasmussen M.; Vafaee M. S. (2006) Effects of dose-dependent levels of isoflurane on cerebral blood flow in healthy subjects studied using positron emission tomography. Acta Anaesthesiol. Scand. 50, 306–312. 10.1111/j.1399-6576.2006.00954.x. [DOI] [PubMed] [Google Scholar]
- Josan S.; Hurd R.; Billingsley K.; Senadheera L.; Park J. M.; Yen Y. F.; Pfefferbaum A.; Spielman D.; Mayer D. (2013) Effects of isoflurane anesthesia on hyperpolarized 13C metabolic measurements in rat brain. Magn. Reson. Med. 70, 1117–1124. 10.1002/mrm.24532. [DOI] [PMC free article] [PubMed] [Google Scholar]
- Raymond S. B.; Skoch J.; Hynynen K.; Bacskai B. J. (2007) Multiphoton imaging of ultrasound/Optison mediated cerebrovascular effects in vivo. J. Cereb. Blood Flow Metab. 27, 393–403. 10.1038/sj.jcbfm.9600336. [DOI] [PubMed] [Google Scholar]
- Marty B.; Larrat B.; Van Landeghem M.; Robic C.; Robert P.; Port M.; Le Bihan D.; Pernot M.; Tanter M.; Lethimonnier F.; Mériaux S. (2012) Dynamic study of blood-brain barrier closure after its disruption using ultrasound: A quantitative analysis. J. Cereb. Blood Flow Metab. 32, 1948–1958. 10.1038/jcbfm.2012.100. [DOI] [PMC free article] [PubMed] [Google Scholar]
- Park J.; Zhang Y.; Vykhodtseva N.; Jolesz F. A.; McDannold N. J. (2012) The kinetics of blood brain barrier permeability and targeted doxorubicin delivery into brain induced by focused ultrasound. J. Controlled Release 162, 134–142. 10.1016/j.jconrel.2012.06.012. [DOI] [PMC free article] [PubMed] [Google Scholar]
- Hynynen K.; McDannold N.; Sheikov N. A.; Jolesz F. A.; Vykhodtseva N. (2005) Local and reversible blood–brain barrier disruption by noninvasive focused ultrasound at frequencies suitable for trans-skull sonications. NeuroImage 24, 12–20. 10.1016/j.neuroimage.2004.06.046. [DOI] [PubMed] [Google Scholar]
- Chu P. C.; Chai W. Y.; Hsieh H. Y.; Wang J. J.; Wey S. P.; Huang C. Y.; Wei K. C.; Liu H. L. (2013) Pharmacodynamic analysis of magnetic resonance imaging-monitored focused ultrasound-induced blood-brain barrier opening for drug delivery to brain tumors. BioMed Res. Int. 2013, 627496. 10.1155/2013/627496. [DOI] [PMC free article] [PubMed] [Google Scholar]
- Gowland P.; Mansfield P.; Bullock P.; Stehling M.; Worthington B.; Firth J. (1992) Dynamic studies of gadolinium uptake in brain tumors using inversion-recovery echo-planar imaging. Magn. Reson. Med. 26, 241–258. 10.1002/mrm.1910260206. [DOI] [PubMed] [Google Scholar]
- van der Sanden B. P. J.; Rozijn T. H.; Rijken P. F. J. W.; Peters H. P. W.; Heerschap A.; van der Kogel A. J.; Bovée W. M. M. J. (2000) Noninvasive Assessment of the Functional Neovasculature in 9L-Glioma Growing in Rat Brain by Dynamic 1 H Magnetic Resonance Imaging of Gadolinium Uptake. J. Cereb. Blood Flow Metab. 20, 861–870. 10.1097/00004647-200005000-00013. [DOI] [PubMed] [Google Scholar]
- Ghanavati S.; Yu L. X.; Lerch J. P.; Sled J. G. (2014) A perfusion procedure for imaging of the mouse cerebral vasculature by X-ray micro-CT. J. Neurosci. Methods 221, 70–77. 10.1016/j.jneumeth.2013.09.002. [DOI] [PubMed] [Google Scholar]
- Takado Y.; Cheng T.; Bastiaansen J. A. M.; Yoshihara H.; Lanz B.; Mishkovsky M.; Lengacher S.; Comment A. (2018) Hyperpolarized 13C MRS reveals the rate-limiting role of the blood-brain barrier on the cerebral uptake and metabolism of L-lactate in vivo. ACS Chem. Neurosci. 9, 2554. 10.1021/acschemneuro.8b00066. [DOI] [PMC free article] [PubMed] [Google Scholar]
- Hynynen K. (2007) Focused ultrasound for blood–brain disruption and delivery of therapeutic molecules into the brain. Expert Opin. Drug Delivery 4, 27–35. 10.1517/17425247.4.1.27. [DOI] [PubMed] [Google Scholar]
- Chopra R.; Vykhodtseva N.; Hynynen K. (2010) Influence of Exposure Time and Pressure Amplitude on Blood–Brain-Barrier Opening Using Transcranial Ultrasound Exposures. ACS Chem. Neurosci. 1, 391–398. 10.1021/cn9000445. [DOI] [PMC free article] [PubMed] [Google Scholar]
- Gallagher F. A.; Kettunen M. I.; Day S. E.; Hu D. E.; Karlsson M.; Gisselsson A.; Lerche M. H.; Brindle K. M. (2011) Detection of tumor glutamate metabolism in vivo using13C magnetic resonance spectroscopy and hyperpolarized [1–13C]glutamate. Magn. Reson. Med. 66, 18–23. 10.1002/mrm.22851. [DOI] [PubMed] [Google Scholar]
- Mazuel L.; Schulte R. F.; Cladière A.; Spéziale C.; Lagrée M.; Leremboure M.; Jean B.; Durif F.; Chassain C. (2017) Intracerebral synthesis of glutamine from hyperpolarized glutamate. Magn. Reson. Med. 78, 1296–1305. 10.1002/mrm.26522. [DOI] [PubMed] [Google Scholar]
- Cunningham C. H.; Chen A. P.; Lustig M.; Hargreaves B. A.; Lupo J.; Xu D.; Kurhanewicz J.; Hurd R. E.; Pauly J. M.; Nelson S. J.; Vigneron D. B. (2008) Pulse sequence for dynamic volumetric imaging of hyperpolarized metabolic products. J. Magn. Reson. 193, 139–146. 10.1016/j.jmr.2008.03.012. [DOI] [PMC free article] [PubMed] [Google Scholar]
- Von Morze C.; Reed G.; Shin P.; Larson P. E. Z.; Hu S.; Bok R.; Vigneron D. B. (2011) Multi-band frequency encoding method for metabolic imaging with hyperpolarized [1- 13C]pyruvate. J. Magn. Reson. 211, 109–113. 10.1016/j.jmr.2011.04.007. [DOI] [PMC free article] [PubMed] [Google Scholar]
- Reed G. D.; Larson P. E. Z.; von Morze C.; Bok R.; Lustig M.; Kerr A. B.; Pauly J. M.; Kurhanewicz J.; Vigneron D. B. (2012) A method for simultaneous echo planar imaging of hyperpolarized 13C pyruvate and 13C lactate. J. Magn. Reson. 217, 41–47. 10.1016/j.jmr.2012.02.008. [DOI] [PMC free article] [PubMed] [Google Scholar]
- Schulte R. F.; Sperl J. I.; Weidl E.; Menzel M. I.; Janich M. A.; Khegai O.; Durst M.; Ardenkjaer-Larsen J. H.; Glaser S. J.; Haase A.; Schwaiger M.; Wiesinger F. (2013) Saturation-recovery metabolic-exchange rate imaging with hyperpolarized [1–13C] pyruvate using spectral-spatial excitation. Magn. Reson. Med. 69, 1209–1216. 10.1002/mrm.24353. [DOI] [PubMed] [Google Scholar]
- Miller J. J.; Lau A. Z.; Teh I.; Schneider J. E.; Kinchesh P.; SmarT S.; Ball V.; Sibson N. R.; Tyler D. J. (2016) Robust and high resolution hyperpolarized metabolic imaging of the rat heart at 7 t with 3d spectral-spatial EPI. Magn. Reson. Med. 75, 1515–1524. 10.1002/mrm.25730. [DOI] [PMC free article] [PubMed] [Google Scholar]
- Hernando D.; Haldar J. P.; Sutton B. P.; Ma J.; Kellman P.; Liang Z. P. (2008) Joint estimation of water/fat images and field inhomogeneity map. Magn. Reson. Med. 59, 571–580. 10.1002/mrm.21522. [DOI] [PMC free article] [PubMed] [Google Scholar]
- Breukels V.; Jansen K. C. F. J.; van Heijster F. H. A.; Capozzi A.; van Bentum P. J. M.; Schalken J. A.; Comment A.; Scheenen T. W. J. (2015) Direct dynamic measurement of intracellular and extracellular lactate in small-volume cell suspensions with13C hyperpolarised NMR. NMR Biomed. 28, 1040–1048. 10.1002/nbm.3341. [DOI] [PubMed] [Google Scholar]
- Steinseifer I. K.; Wijnen J. P.; Hamans B. C.; Heerschap A.; Scheenen T. W. J. (2013) Metabolic imaging of multiple X-nucleus resonances. Magn. Reson. Med. 70, 169–175. 10.1002/mrm.24456. [DOI] [PubMed] [Google Scholar]
- Chen A. P.; Kurhanewicz J.; Bok R.; Xu D.; Joun D.; Zhang V.; Nelson S. J.; Hurd R. E.; Vigneron D. B. (2008) Feasibility of using hyperpolarized [1–13C]lactate as a substrate for in vivo metabolic13C MRSI studies. Magn. Reson. Imaging 26, 721–726. 10.1016/j.mri.2008.01.002. [DOI] [PMC free article] [PubMed] [Google Scholar]
- Koelsch B. L.; Keshari K. R.; Peeters T. H.; Larson P. E. Z.; Wilson D. M.; Kurhanewicz J. (2013) Diffusion MR of hyperpolarized13C molecules in solution. Analyst 138, 1011–1014. 10.1039/c2an36715g. [DOI] [PMC free article] [PubMed] [Google Scholar]
- Marjańska M.; Iltis I.; Shestov A. A.; Deelchand D. K.; Nelson C.; Ugurbil K.; Henry P. G. (2010) In vivo13C spectroscopy in the rat brain using hyperpolarized [1–13C]pyruvate and [2–13C]pyruvate. J. Magn. Reson. 206, 210–218. 10.1016/j.jmr.2010.07.006. [DOI] [PMC free article] [PubMed] [Google Scholar]
- Navis A. C.; Niclou S. P.; Fack F.; Stieber D.; van Lith S.; Verrijp K.; Wright A.; Stauber J.; Tops B.; Otte-Holler I.; Wevers R. A.; van Rooij A.; Pusch S.; von Deimling A.; Tigchelaar W.; van Noorden C. J. F.; Wesseling P.; Leenders W. P. J. (2013) Increased mitochondrial activity in a novel IDH1-R132H mutant human oligodendroglioma xenograft model: In situ detection of 2-HG and α-KG. Acta Neuropathol. Commun. 1, 18. 10.1186/2051-5960-1-18. [DOI] [PMC free article] [PubMed] [Google Scholar]
- Wiesmann M.; Timmer N. M.; Zinnhardt B.; Reinhard D.; Eligehausen S.; Königs A.; Ben Jeddi H.; Dederen P. J.; Jacobs A. H.; Kiliaan A. J. (2018) Effect of a multinutrient intervention after ischemic stroke in female C57Bl/6 mice. J. Neurochem. 144, 549–564. 10.1111/jnc.14213. [DOI] [PubMed] [Google Scholar]


