Abstract
Background:
Daratumumab, a therapeutic IgG kappa monoclonal antibody, can cause a false positive interference on electrophoretic assays that are routinely used to monitor patients with monoclonal gammopathies. In this study, we evaluate the ability of matrix-assisted laser desorption/ionization time-of-flight mass spectrometry (MALDI-TOF MS) to distinguish daratumumab from disease-related IgG kappa monoclonal proteins (M-protein).
Methods:
Waste clinical samples from 31 patients who were receiving daratumumab and had a history of IgG kappa monoclonal gammopathy were collected. Immunoglobulins were purified from serum and analyzed by MALDI-TOF MS. Mass spectra were assessed for the presence of distinct monoclonal proteins. For samples in which only one monoclonal peak was identified near the expected m/z of daratumumab, the Hydrashift 2/4 Daratumumab Assay was used to confirm the presence of an M-protein.
Results:
Using MALDI-TOF MS, daratumumab could be distinguished from M-proteins in 26 out of 31 samples (84%). Results from 2 samples were inconclusive since the M-protein was not detected by the Hydrashift assay and may also be undetectable by MALDI-TOF MS. Comparatively, daratumumab was distinguishable from M-proteins in 14 out of 31 samples (45%) by immunofixation.
Conclusions:
MALDI-TOF MS offers greater specificity compared to immunofixation for distinguishing daratumumab from M-proteins.
Keywords: MALDI-TOF mass spectrometry, monoclonal immunoglobulin, multiple myeloma, daratumumab
1. Introduction
Daratumumab is an IgG kappa monoclonal antibody (mAb) that targets CD38, a glycoprotein that is highly expressed by myeloma cells [1]. Daratumumab gained Food and Drug Administration (FDA) approval in 2015 for the treatment of relapsed/refractory multiple myeloma and was recently approved for use in newly diagnosed, transplant-ineligible patients in combination with bortezomib, melphalan and prednisone [2].
Although mAb therapeutics have revolutionized the treatment of multiple myeloma, their use has also introduced analytical challenges for the clinical laboratory. MAb drugs, including daratumumab, can cause a false positive interference on both serum protein electrophoresis (SPEP) and immunofixation (IFE), two assays that are routinely used to monitor a patient’s disease status and response to therapy [3–8]. Due to the limited resolution and specificity of these techniques, it is often difficult to distinguish daratumumab from the disease-related monoclonal protein (M-protein). Thus, these drugs may be misinterpreted as the patient’s disease biomarker and ultimately affect clinical decisions and clinical trial outcomes. With the increasing use of mAbs for the treatment of multiple myeloma, assays that can distinguish between drug and disease-related M-proteins are greatly needed.
Recently, a method based on matrix-assisted laser desorption/ionization time-of-flight mass spectrometry (MALDI-TOF MS) was developed to detect M-proteins in serum [9]. This method was shown to correlate well to immunofixation in detecting and isotyping M-proteins. The objective of this study was to assess the performance of MALDI-TOF MS in distinguishing daratumumab from M-proteins in 31 patients with IgG kappa monoclonal gammopathies.
2. Methods
2.1. Patient Samples
All samples used for this study were obtained with the approval of the Institutional Review Board at Memorial Sloan Kettering Cancer Center (MSKCC). Waste clinical samples from 31 patients were collected from the Clinical Chemistry Laboratory at MSKCC. Through chart review, patients were confirmed to be receiving daratumumab as part of their therapeutic regimen at the time the sample was drawn. Patients were also confirmed to have a history of IgG kappa monoclonal gammopathy. .All samples were stored at −20° C until analysis.
2.2. Sample purification
Prior to mass spectrometric analysis, immunoglobulins were purified from serum as described by Mills et al. [9]. Briefly, serum samples were diluted 1:10 with phosphate buffered saline (PBS). CaptureSelect beads specific for IgG, IgA, IgM heavy chains or kappa and lambda light chains (Thermo Fisher Scientific) were separately added to the diluted serum and incubated for 45 minutes with gentle shaking. Unbound material was discarded, and the beads were washed 3 times with PBS and 2 times with water. The immunoglobulins were eluted from the beads and the light chains were separated from heavy chains using 40 µL of 5% acetic acid, 50 mM Tris(2-carboxyethyl) phosphine. Pooled normal serum was used as a negative control. As our positive control, daratumumab was spiked into pooled normal serum to a final concentration of 0.3 g/dL. Both controls were prepared in the same manner as patient samples and were run on every MALDI plate.
2.3. MALDI-TOF MS
Purified samples were mixed with saturated α-cyano-4-hydroxycinnamic acid matrix solution in a 9:1 matrix:sample ratio. One microliter of the mixture was spotted onto a polished stainless steel MALDI plate and allowed to dry completely before analysis. Mass spectra were collected using a Microflex LT MALDI-TOF mass spectrometer (Bruker). Spectra were collected in positive ion mode (delay: 150 ns; ion source 1 voltage: 20 kV; ion source 2 voltage: 18 kV; lens voltage: 6 kV) from 8,000 Da to 30,000 Da. Five hundred laser shots were taken across a sample spot and the spectra were summed.
2.4. Data Analysis
Two reviewers examined mass spectra from all 5 purifications for the presence of distinct monoclonal peaks. Reviewers used the +2 charge state of the light chains (m/z range of 10,000–12,500) for their interpretation. Although the isotype of the M-protein was known prior to analysis, review of the IgA-, IgM- and lambda-specific purifications confirmed that no other monoclonal proteins, which may have been undetectable by IFE, were identified by MALDI-TOF MS in any of the 31 patient samples. Representative spectra obtained from a single patient sample are shown in Supplemental Figure 1. The average m/z value of daratumumab’s kappa light chain was determined from multiple measurements (N=12) of the positive control sample. This m/z value was used to help reviewers identify daratumumab in patient samples and distinguish it from an endogenous M-protein.
All IFE results were previously interpreted by attendings in the Department of Laboratory Medicine during routine clinical testing. For this study, reviewers categorized the IFE results as “distinguishable” or “indistinguishable”. This was based on the prior interpretation and whether one or two IgG kappa monoclonal bands were visible by IFE. To aid in categorization, pre-treatment IFE results (if available) were used to assess the migration pattern of the patients’ endogenous IgG kappa M-protein.
2.5. Immunofixation and Hydrashift 2/4 Daratumumab assays
In cases where only one peak was identified near the m/z of daratumumab, we used the Hydrashift 2/4 Daratumumab assay to confirm the presence of the patient’s M-protein. Immunofixation and the Hydrashift 2/4 Daratumumab assays were performed on the Hydrasys 2 instrument using the Hydragel 4 IF kit (Sebia). Both assays were performed according to the manufacturer’s instructions. Details of the Hydrashift assay were previously described [10].
3. Results
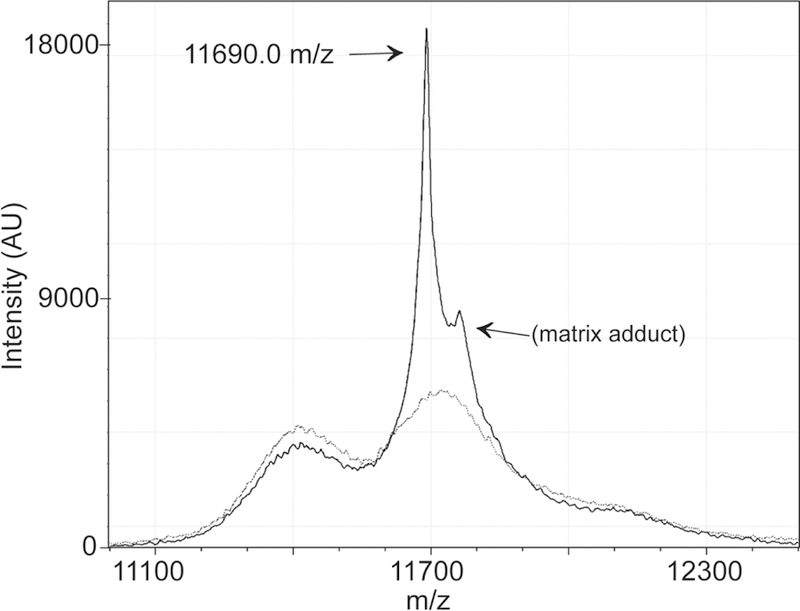
We analyzed 12 different measurements of the daratumumab-spiked positive control to determine the expected m/z range of daratumumab’s kappa light chain. The +2 charge state of the kappa light chain has a characteristic peak at (Figure 1). An additional peak at 11762 ± 3 m/z is attributed to a matrix adduct. We considered monoclonal peaks within the range of 11684–11696 m/z to potentially be daratumumab in patient samples. Thus, to be considered distinguishable from daratumumab, M-protein peaks had to be outside of this stated range.
Figure 1. MALDI-TOF mass spectrum of daratumumab’s light chain.

The MALDI-TOF mass spectrum of the IgG-specific purification is shown for the daratumumab positive control (solid line) and the pooled normal serum negative control (dotted line). The +2 charge state of daratumumab’s kappa light chain has a mass to charge ratio (m/z) of 11690.0. The peak at ~11762 m/z is attributed to a matrix adduct.
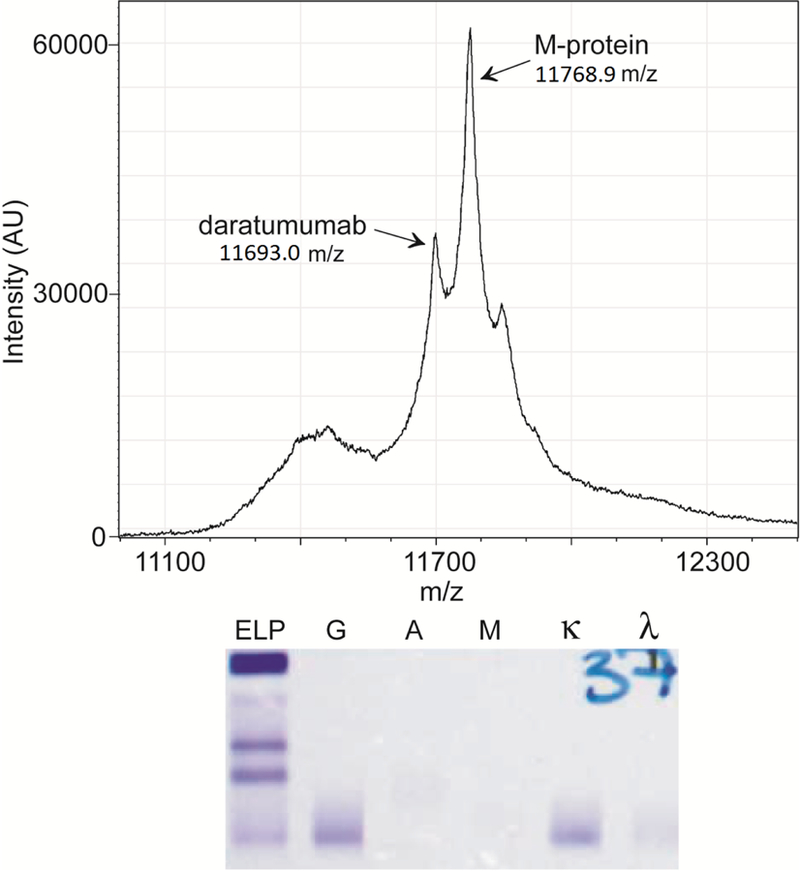
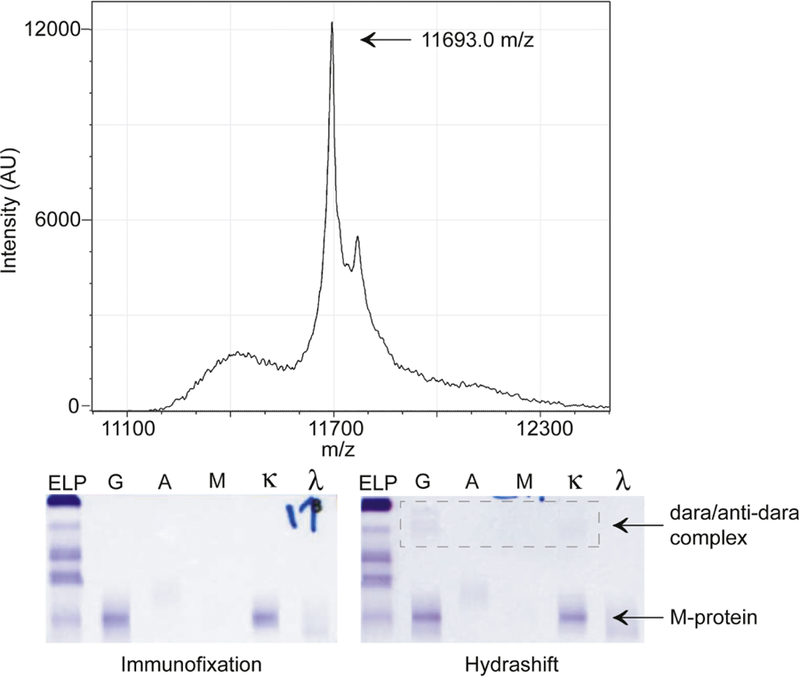
Based on mass, we could distinguish daratumumab from the patient’s endogenous M-protein in 26 of the 31 patient samples (84%) (Table 1). A representative example is shown in Figure 2. In the remaining 5 samples, we observed only one peak in the expected m/z range for daratumumab’s light chain. An example is shown in Figure 3. This scenario could occur in patient samples for one of two reasons: either the mass of the M-protein and daratumumab light chains are too similar, such that the peaks cannot be resolved, or the M-protein is not detectable by MALDI-TOF MS.
Table 1.
Comparison of MALDI-TOF MS and immunofixation in distinguishing daratumumab from M-protein.
| Immunofixation | |||||
|---|---|---|---|---|---|
| Distinguishable | Indistinguishable | Cannot determine* | TOTAL | ||
| MALDI-TOF MS | Distinguishable | 13 | 13 | − | 26 |
| Indistinguishable | 1 | 2 | − | 3 | |
| Cannot determine** | − | 1 | 1 | 2 | |
| TOTAL | 14 | 16 | 1 | 31 | |
IFE result showing the migration pattern of the patient’s original clone is not available
M-protein was not detected by Hydrashift
Figure 2. Daratumumab is distinguishable from the M-protein.

Mass spectrum of the IgG-specific purification is shown for a patient sample where daratumumab is distinguishable from the M-protein. The corresponding IFE result for this sample is shown below the mass spectrum. Daratumumab and the M-protein co-migrate and are indistinguishable by IFE.
Figure 3. MALDI-TOF MS cannot differentiate daratumumab from M-protein in all samples.

The MALDI-TOF mass spectrum of a patient sample where daratumumab is not distinguishable from the M-protein. The corresponding IFE and Hydrashift results for this sample are shown below the mass spectrum. The Hydrashift confirms that both daratumumab and the M-protein are present in the sample.
To confirm the presence of the M-protein in these 5 samples, we used the Hydrashift 2/4 Daratumumab Assay. This assay uses an anti-daratumumab reagent to shift daratumumab away from the gamma region allowing M-proteins to be visualized without interference. The Hydrashift assay detected an M-protein in 3 out of the 5 samples. Therefore, the MALDI-TOF MS assay was unable to distinguish daratumumab from the M-protein in 3 of 31 samples (9.7%). We cannot draw a conclusion in the other 2 samples since the M-protein may also be undetectable by MALDI-TOF MS.
Notably, the MALDI-TOF MS assay was better able to distinguish daratumumab from the M-protein compared to IFE. In the same 31 samples, daratumumab was distinguishable from the M-protein by IFE in only 14 samples (45%) (Table 1). One result was inconclusive since we did not have a record of the patient’s original M-protein migration on IFE and only daratumumab was visible by Hydrashift. There was only one instance in which daratumumab was distinguishable from the M-protein by IFE but not by MALDI.
4. Discussion
Assays that can distinguish mAb drugs from disease-related M-proteins are critically needed as mAb drugs are being used more commonly for the treatment of plasma cell disorders and can interfere with SPEP and IFE. Currently, the Hydrashift 2/4 Daratumumab Assay is the only commercially-available method that addresses the false positive interference caused by daratumumab on immunofixation. This assay was FDA-cleared in January 2018 and allows the source of an IgGκ band to be confirmed and a patient’s disease to be visible without interference. This assay is effective [10] and we currently use it in our clinical laboratory. However, the Hydrashift only works for daratumumab. Since other mAb drugs can cause false positive interference on immunofixation [3,5,8], and new therapeutic mAbs are under investigation for use in multiple myeloma, we see the need for a more universal approach for distinguishing therapeutic mAbs from M-proteins.
The MALDI-TOF MS assay may be one such solution since data are collected in an untargeted manner and mass measurements can be used to distinguish drugs from M-proteins. In this study, we found that the MALDI-TOF MS assay can distinguish daratumumab from IgG kappa M-proteins in most (84%) samples and is more specific than immunofixation. Our study provides further support that MALDI-TOF MS could serve as a useful replacement for IFE [9,11].
However, the MALDI-TOF MS assay could not distinguish daratumumab from M-proteins in all samples due to the relatively poor resolution of a linear MALDI-TOF instrument. Previous studies using liquid chromatography quadrupole time-of-flight mass spectrometry (LC-QTOF MS) showed that mAb drugs could be differentiated from M-proteins in 100% of the samples tested [5,12]. Compared to MALDI-TOF MS, the LC-QTOF method has an additional purification step (i.e. the LC separation) and provides superior mass resolution. However, it may not be practical for routine use considering the ~15-minute run time per sample. In addition, the high cost of an LC-QTOF (~$500,000-$600,000) and the significant technical expertise required to operate this mass spectrometer may limit this method to reference laboratories and large academic centers.
The use of mass spectrometry to detect M-proteins offers several advantages over current electrophoretic methods and will likely replace SPEP and IFE in the future. The ability to resolve mAb drugs from M-proteins is an important advantage that will allow clinicians and pathologists to accurately monitor disease in patients who are receiving mAb drugs. However, with the use of more sensitive techniques, we are likely to see mAbs that were previously undetectable by immunofixation. Therefore, it will be important to know the patient’s history (i.e. the mass of the M-protein) and the mass of mAb drugs. Future work should focus on determining when to use the different mass spectrometry techniques, and on building a library of therapeutic mAb masses, which will be critical for the proper interpretation of spectra.
Supplementary Material
Highlights:
The mass of light chains can be used to distinguish daratumumab from M-proteins.
Mass spectrometry is more specific than immunofixation for this purpose.
The analytical specificity will depend on the mass resolution of the instrument.
Acknowledgments
This work was supported by a grant from the Society of Memorial Sloan Kettering Cancer Center (to K.L.T.) and by the Memorial Sloan Kettering Core Grant (P30 CA008748) funded by the National Cancer Institute.
Non-standard abbreviations:
- (MALDI-TOF MS)
Matrix-assisted laser desorption/ionization time-of-flight mass spectrometry
- (M-protein)
monoclonal protein
- (mAb)
monoclonal antibody
- (FDA)
Food and Drug Administration
- (SPEP)
serum protein electrophoresis
- (IFE)
immunofixation
- (MSKCC)
Memorial Sloan Kettering Cancer Center
Footnotes
Publisher's Disclaimer: This is a PDF file of an unedited manuscript that has been accepted for publication. As a service to our customers we are providing this early version of the manuscript. The manuscript will undergo copyediting, typesetting, and review of the resulting proof before it is published in its final citable form. Please note that during the production process errors may be discovered which could affect the content, and all legal disclaimers that apply to the journal pertain.
Declarations of interest: none
References
- [1].Touzeau C, Moreau P, Daratumumab for the treatment of multiple myeloma, Expert Opin Biol Ther 17 (2017) 887–893. doi: 10.1080/14712598.2017.1322578. [DOI] [PubMed] [Google Scholar]
- [2].Mateos M-V, Dimopoulos MA, Cavo M, Suzuki K, Jakubowiak A, Knop S, Doyen C, Lucio P, Nagy Z, Kaplan P, Pour L, Cook M, Grosicki S, Crepaldi A, Liberati AM, Campbell P, Shelekhova T, Yoon S-S, Iosava G, Fujisaki T, Garg M, Chiu C, Wang J, Carson R, Crist W, Deraedt W, Nguyen H, Qi M, San-Miguel J, Daratumumab plus Bortezomib, Melphalan, and Prednisone for Untreated Myeloma, New England Journal of Medicine 378 (2018) 518–528. doi: 10.1056/NEJMoa1714678. [DOI] [PubMed] [Google Scholar]
- [3].Murata K, McCash SI, Carroll B, Lesokhin AM, Hassoun H, Lendvai N, Korde NS, Mailankody S, Landau HJ, Koehne G, Chung DJ, Giralt SA, Ramanathan LV, Landgren O, Treatment of multiple myeloma with monoclonal antibodies and the dilemma of false positive M-spikes in peripheral blood, Clin. Biochem 51 (2018) 66–71. doi: 10.1016/j.clinbiochem.2016.09.015. [DOI] [PMC free article] [PubMed] [Google Scholar]
- [4].McCudden CR, Jacobs JFM, Keren D, Caillon H, Dejoie T, Andersen K, Recognition and management of common, rare, and novel serum protein electrophoresis and immunofixation interferences, Clin. Biochem 51 (2018) 72–79. doi: 10.1016/j.clinbiochem.2017.08.013. [DOI] [PubMed] [Google Scholar]
- [5].Willrich MAV, Ladwig PM, Andreguetto BD, Barnidge DR, Murray DL, Katzmann JA, Snyder MR, Monoclonal antibody therapeutics as potential interferences on protein electrophoresis and immunofixation, Clin. Chem. Lab. Med 54 (2016) 1085–1093. doi: 10.1515/cclm-2015-1023. [DOI] [PubMed] [Google Scholar]
- [6].Mills JR, Murray DL, Identification of Friend or Foe: The Laboratory Challenge of Differentiating M-Proteins from Monoclonal Antibody Therapies, The Journal of Applied Laboratory Medicine 1 (2017) 421–431. doi: 10.1373/jalm.2016.020784. [DOI] [PubMed] [Google Scholar]
- [7].McCudden CR, Voorhees PM, Hainsworth SA, Whinna HC, Chapman JF, Hammett-Stabler CA, Willis MS, Interference of Monoclonal Antibody Therapies with Serum Protein Electrophoresis Tests, Clinical Chemistry 56 (2010) 1897–1899. doi: 10.1373/clinchem.2010.152116. [DOI] [PubMed] [Google Scholar]
- [8].Ruinemans-Koerts J, Verkroost C, Schmidt-Hieltjes Y, Wiegers C, Curvers J, Thelen M, van LM, Interference of therapeutic monoclonal immunoglobulins in the investigation of M-proteins, Clinical Chemistry and Laboratory Medicine (CCLM) 52 (2014) e235–e237. doi: 10.1515/cclm-2013-0898. [DOI] [PubMed] [Google Scholar]
- [9].Mills JR, Kohlhagen MC, Dasari S, Vanderboom PM, Kyle RA, Katzmann JA, Willrich MAV, Barnidge DR, Dispenzieri A, Murray DL, Comprehensive Assessment of M-Proteins Using Nanobody Enrichment Coupled to MALDI-TOF Mass Spectrometry, Clin. Chem 62 (2016) 1334–1344. doi: 10.1373/clinchem.2015.253740. [DOI] [PubMed] [Google Scholar]
- [10].Thoren KL, Pianko MJ, Maakaroun Y, Landgren CO, Ramanathan LV, Distinguishing Drug from Disease by Use of the Hydrashift 2/4 Daratumumab Assay, The Journal of Applied Laboratory Medicine (2018) jalm.2018.026476. doi: 10.1373/jalm.2018.026476. [DOI] [PMC free article] [PubMed] [Google Scholar]
- [11].Milani P, Murray DL, Barnidge DR, Kohlhagen MC, Mills JR, Merlini G, Dasari S, Dispenzieri A, The utility of MASS-FIX to detect and monitor monoclonal proteins in the clinic, Am. J. Hematol 92 (2017) 772–779. doi: 10.1002/ajh.24772. [DOI] [PubMed] [Google Scholar]
- [12].Mills JR, Kohlhagen MC, Willrich MAV, Kourelis T, Dispenzieri A, Murray DL, A universal solution for eliminating false positives in myeloma due to therapeutic monoclonal antibody interference, Blood (2018) blood-2018–05-848986. doi: 10.1182/blood-2018-05-848986. [DOI] [PubMed] [Google Scholar]
Associated Data
This section collects any data citations, data availability statements, or supplementary materials included in this article.


