Abstract
Background
Development of equine platelet concentrate (PC) would aid management of cases requiring transfused platelets (PLTs), where adminstration of whole‐blood or platelet‐rich plasma (PRP) might be contraindicated.
Objectives
To test and validate a method for production of an equine PRP‐PC product.
Animals
Six healthy Thoroughbred geldings from a research herd.
Methods
In this prospective experimental study, whole blood was collected and processed through multiple centrifugation steps to yield 120 mL of PC. The PC was stored at 22°C and gently and continuously agitated. Measurements of PLT count, pH, and concentrations of glucose, lactate, electrolytes, lactate dehydrogenase (LDH), and aspartate aminotransferase (AST), as well as partial pressures of oxygen and carbon dioxide were performed on days 0, 1, 2, 3, 5, and 7. Platelet aggregometry and bacterial culture were also performed.
Results
The PC always had a PLT count of ≥550 × 103 cells/μL. Aggregometry graph amplitude (P < .0001) and area under the curve (P < .05) significantly decreased over time. Sodium, chloride, lactate (P < .0001), and oxygen (P < .01) concentrations significantly increased over time. pH (P < .001), glucose and bicarbonate concentrations (P < .0001) significantly decreased over time. There was no significant difference in potassium concentration, PLT count, LDH and AST activities and no bacterial growth from culture.
Conclusions and Clinical Importance
The described technique yielded a PC that meets the standards of the American Association of Blood Banks for human PC.
Keywords: horse, thrombocyte, thrombocytopenia, transfusion
Abbreviations
- AST
aspartate aminotransferase
- AUC
area under the curve
- BC
buffy coat
- IMTP
immune mediated thrombocytopenia
- LDH
lactate dehydrogenase
- PC
platelet concentrate
- pCO2
partial pressure of carbon dioxide
- PLT
platelet
- pO2
partial pressure of oxygen
- PRP
platelet‐rich plasma
- PSL
platelet storage lesion
- RBC
red blood cell
- WBC
white blood cell
1. INTRODUCTION
Interactions of platelets with von Willebrand Factor, collagen, phospholipids, and soluble coagulation factors induce PLT adherence to vessel walls, as well as activation, aggregation, and formation of the primary hemostatic plug. Clinical signs in animals with life‐threatening thrombocytopenia or PLT function disorders include mucous membrane petechiation, and both internal and external hemorrhage. Platelet transfusions might be administered to humans or animals with thrombocytopenia or PLT function disorders (congenital, metabolic, or medication‐induced) when there is active PLT‐related hemorrhage or prophylactically in cases at immediate, serious risk of hemorrhage. Thrombocytopenia is unlikely to cause spontaneous hemorrhage unless PLT count drops below 10 000‐20 000/μL and a higher threshold might be necessary in cases of PLT function disorder.1 Prolonged bleeding and propensity for hematoma formation might be noted with PLT counts below 40 000/μL.1 Regardless of the exact number, thrombocytopenic horses are significantly more likely to die or to be euthanized than are horses with normal platelet counts,2 highlighting the clinical importance of thrombocytopenia of any degree. Five of 6 neonatal foals with ulcerative dermatitis, thrombocytopenia, and neutropenia syndrome were treated with whole blood or platelet‐rich plasma (PRP) transfusions due to life‐threatening thrombocytopenia.3
Platelet transfusions can be provided in the form of whole blood, PRP, or platelet concentrate (PC). Platelet concentrate is often preferred over whole blood to prevent polycythemia and alloimmunization against red blood cells (RBCs), and over both whole blood and PRP to prevent transfusion‐associated circulatory overload. Platelet concentrate is used in both human and canine medicine but has not yet been developed for transfusion use in horses. It is of particular benefit in neonates with immune‐mediated thrombocytopenia (IMTP) and have a relatively small circulating blood volume, which puts them at increased risk of transfusion‐associated circulatory overload. The use of PC allows administration of a high concentration of platelets in a small volume of plasma, which would otherwise require a large volume of whole blood or plasma to match the PLT count.
Platelet concentrates can be produced with either a buffy coat (BC) or PRP protocol. In humans, the PRP method is used more commonly in North America and the BC technique is used more often in Europe. In a study comparing these 2 methods to produce canine PC, PRP‐PC had less white blood cell (WBC) and RBC contamination and superior PLT function compared to the BC‐PC.4 The objectives of this study were to test and validate the methodology for production of an equine PRP‐PC product, including assessment of PLT, WBC, and RBC concentrations, in vitro PLT function, microbial growth and markers of platelet storage lesion (PSL) throughout storage.
2. MATERIALS AND METHODS
2.1. Horses
Blood was drawn from 6 healthy Thoroughbred geldings (range 10‐24 years old, median 16 years old) from the research herd. Horses were deemed healthy based on physical examination, CBC, and serum biochemical evaluation. The experimental protocol was approved by the Institutional Animal Care and Use Committee of the University of California‐Davis.
2.2. Blood collection
For blood collection from each horse, an area over the jugular vein was clipped and prepared following standard aseptic protocols (chlorhexidine and alcohol). One liter of blood was collected with the 16 g needle (already attached to the bagset) into a Terumo T‐1000 Transfer bag (Terumo Corporation, Tokyo, Japan) containing 147 mL of citrate phosphate dextrose adenine for each horse. The bagset was placed onto a tared scale for collection of blood until the scale read 1000 g. The line was then clamped with a plastic hemostat, and the air exhausted out of the bag before tying it closed.
2.3. PC processing
Platelet count was performed on the whole blood after collection, and the blood bags were then centrifuged at 1000g for 5 minutes and 45 seconds using a RC12BP Sorvall Centrifuge (Thermo Fisher Scientific, Waltham, Massachusetts) to make PRP. A plasma press was used to transfer the plasma (PRP) into a welded‐on XT‐612 transfer bag (Terumo Corporation, Tokyo, Japan). The transfer bags were centrifuged this time at 2000g for 8 minutes. The plasma was again pressed into another welded‐on XT‐612 transfer bag until only 120 mL plus the PLT pellet remained. The pellet and plasma were allowed to sit, undisturbed, for 1 hour at which time the pellet was massaged to resuspend into the plasma. If the RBC count at this time was >0.10 × 10⁶ cells/μL, the bag was hung for an additional 2‐4 hours to allow the RBCs to drop to the bottom of the bag. Another XT‐612 bag was welded on and the plasma was pressed off leaving the red cell pellet behind. Platelet counts of 550 × 103 cells/μL or greater were considered adequate for PC (blood banking standard).
2.4. Blood storage and sampling
The bags containing the PC were kept at 22°C on a rocker, and each bag was tested for PLT count, pH, and concentrations of glucose, lactate, bicarbonate, sodium, potassium, chloride, lactate dehydrogenase (LDH), and aspartate aminotransferase (AST), as well as partial pressure of carbon dioxide (pCO2) and partial pressure of oxygen (pO2), on days 0, 1, 2, 3, 5, and 7; platelet aggregometry and microbial culture were also performed.
2.5. Platelet counts
Platelet counts were performed on all samples at all time points using the Siemens Advia 120 Hematology System (Siemens Healthcare Solutions, Erlangen, Germany).
2.6. Biochemical analysis
Biochemical analysis was performed on all samples at all time points using the Cobas c501 (Roche Diagnostics, Indianapolis, Indiana).
2.7. Blood gas analysis
Blood gas analysis, including blood lactate concentration, was performed on all samples at all time points using the ABL800 Flex Blood Gas Analyzer (Radiometer Medical ApS, Brønshøj, Denmark).
2.8. Platelet aggregometry
Platelet function was evaluated by light transmission aggregometry. The system measures 4 variables: lag time (the time to onset of activation), slope (the speed of the reaction), amplitude (the degree of the reaction %), and the area under the curve (AUC; an additional measure of the extent of the reaction). For aggregometry, the PC was decanted into 1.5 mL conical tubes and depending on the PLT count, samples were diluted in platelet‐poor plasma from the same donor horse to achieve a final concentration of approximately 250 000 PLTs/μL (±80 000). Aggregometry was performed with a temperature‐controlled aggregometer (Chronolog Corporation Optical Aggregometer model 490; Havertown, Pennsylvania) after activation by human γ‐thrombin (Thrombin, Sigma Chemical Co, St. Louis, Missouri; final concentration 0.5 U/mL). Software (Chronolog Corporation) analysis was performed to calculate amplitude and slope.
2.9. Bacterial culture
Routine cultures of each PC bag was performed for every time point. Samples were aseptically aspirated from each bag and submitted to the VMTH Microbiology Laboratory for standard aerobic and anaerobic cultures.
2.10. Statistical analysis
The data were tested for normality using the Kolmogorov‐Smirnov test. Changes in the measured variables were compared over time for the 6 bags of PC. Repeated‐measures analysis of variance was used to assess parametric data including PLT count, RBC count, bicarbonate, chloride, glucose, lactate, and potassium concentrations as well as AST, pH, oxygen and carbon dioxide tensions, and aggregometry AUC and amplitude over time (days 0, 1, 2, 3, 5, and 7). Post hoc analysis was performed using the Tukey‐Kramer test for statistically significant data. Sodium concentration, LDH and WBC count were assessed over time using the Friedman test for nonparametric data, and post hoc analysis was performed using the Dunn's test for statistically significant data. Statistical analysis was performed using a commercial software program (Graph Pad InStat, La Jolla California). In all cases, P < .05 was considered significant.
3. RESULTS
Mean PLT counts in the PC ranged from 713 333 cells/μL on day 0 up to 759 667 cells/μL on day 3; however, there was no statistically significant change in PLT count over the time of the experiments. The RBC and WBC counts both decreased significantly over time in the PC (day 3 versus day 7 for RBC, day 0 versus days 5 and 7 for WBC counts, P < .05) (Figure 1A, B).
Figure 1.
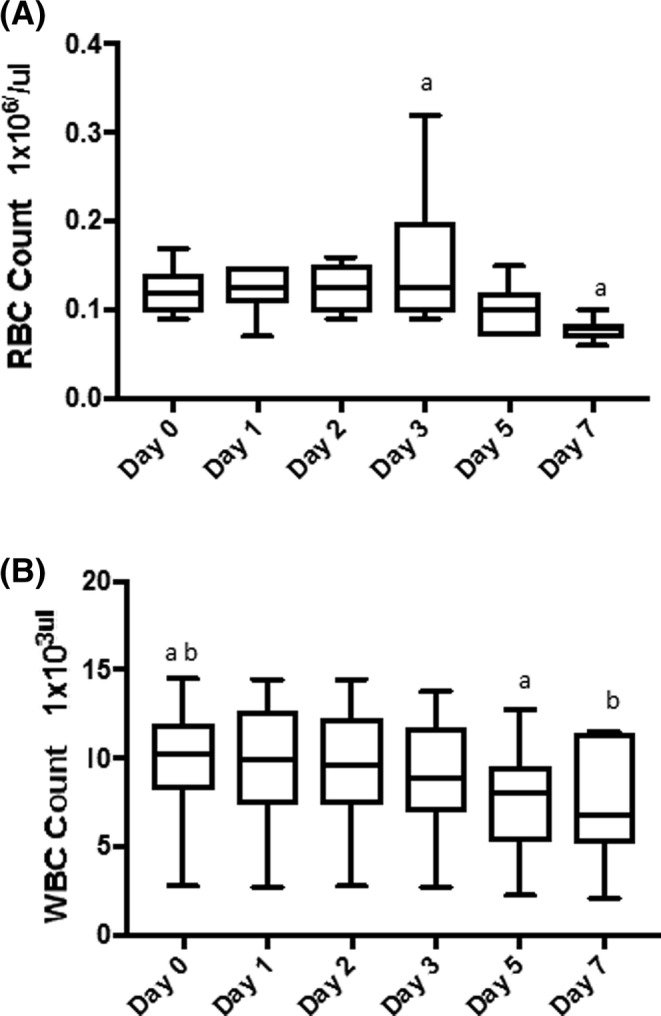
Box plots of red blood cell (RBC) count (A) and white blood cell (WBC) count (B) in the platelet concentrate during each day of storage. A, The RBC count decreased significantly over time. a P < .05. B, The WBC count also decreased over time. ab P < .05
Lactate concentration was increased as compared to baseline, with statistically significant increases days 2‐7 (Figure 2A). A similar but inverse pattern was seen with bicarbonate and glucose concentrations, with statistically significant decreases occurring each days 2‐7 (Figure 2B,C). Glucose concentrations were significantly lower on days 2‐7 (P < .0001) (Figure 2A‐C). There were no statistically significant changes in the pH until day 7, when there was a statistically significant decrease as compared to all other days (Figure 3A). The PO2 varied significantly throughout the study period P < .01 it initially decreased, then increased, resulting in a statistically significant increase between days 1, 2, and 3 versus 7 (Figure 3B). The pCO2 showed a statistically significant decline each day (Figure 3C). Sodium concentrations had a statistically significant increase on days 5 and 7 relative to days 0‐2 (Figure 4A). Chloride showed a statistically significant decrease on day 5 relative to all other days, followed by a statistically significant increase on day 7 relative to all other days (Figure 4B).
Figure 2.
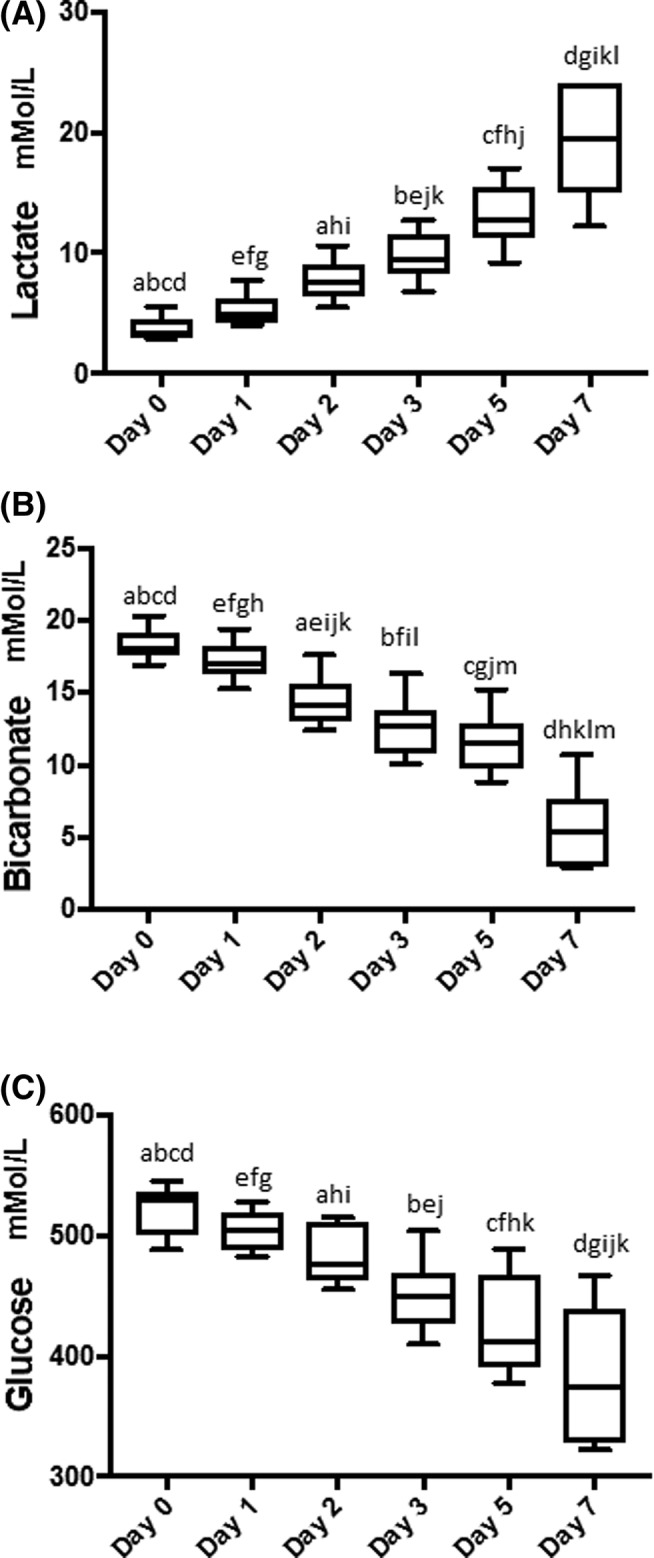
Box plots of lactate (A), bicarbonate (B), and glucose (C) concentrations in the platelet concentrate during each day of storage. A, Lactate concentrations significantly increased each day. ae P < .01, bcdfghikl P < .001, j P < .05. B, Conversely, bicarbonate concentrations significantly decreased each day. abcdefghjklm P < .001, i P < .05. C, Glucose concentrations decreased in a similar manner to the decrease in bicarbonate concentrations over time. ak P < .05, bcdefghij P < .001
Figure 3.
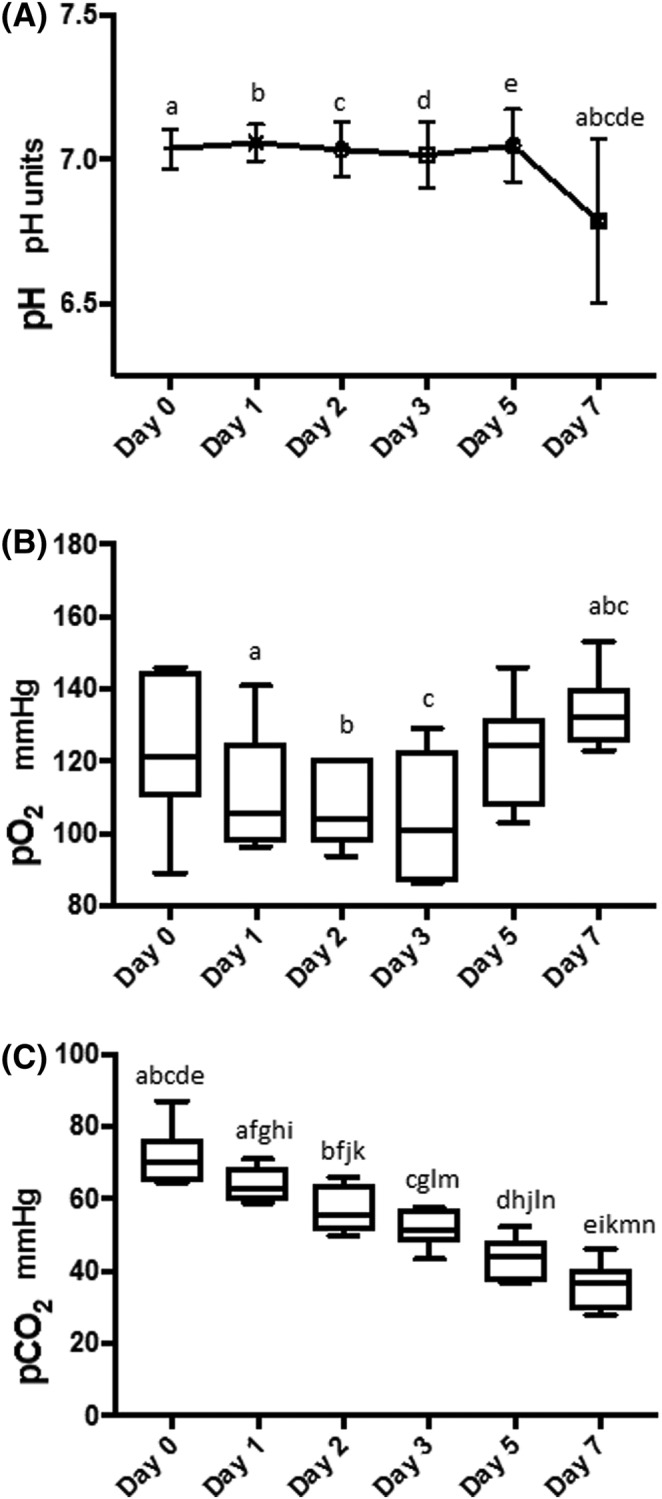
Graph illustrating pH (A), and box plots illustrating the partial pressures of oxygen (pO2) (B) and carbon dioxide (pCO2) (C) in the platelet concentrate during each day of storage. A, There was a statistically significant decrease in pH on day 7 compared to each of the other days. acd P < .01, be P < .001. B, There was significant variation of pO2 over the study period ending with a significant increase on day 7. a P < .05, bc P < .01. C, Partial pressures of carbon dioxide decreased significantly over time with the most marked decrease between days 0 and 7. afn P < .05, bcdeghijkm P < .001, l P < .001
Figure 4.
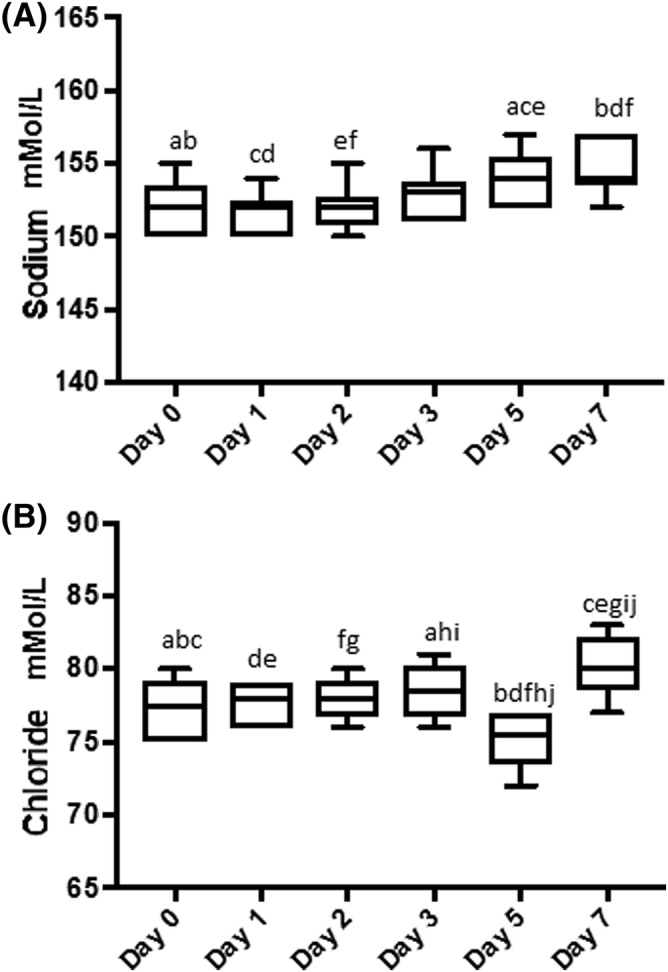
Box plots of sodium (A) and chloride (B) concentrations in the platelet concentrate during each day of storage. Sodium concentrations increased significantly on days 5 and 7 abef P < .05, cd P < .01 (A); and similarly chloride concentrations also increased significantly on day 7 (B) a P < .05, bcdefghj P < .001, i P < .01
Potassium concentration, and LDH and AST activities were not significantly altered during the experimental time period.
Platelet function: There was no statistically significant variation in lag time over time (P = .30). There also were no statistically significant changes in slope or rate of platelet activation over time. The amplitude of the response to agonist was significantly decreased over time, and these decreases were statistically significantly different from baseline on days 3 (P < .05), 5 (P < .01), and 7 (P < .001). Other statistically significant decreases in amplitude occurred from days 1 to 5 (P < .05) and days 1 to 7 (P < .01), and between days 2 and 5 (P < .05) and 2 and 7 (P < .01). Area under the curve also decreased over time (P < .05); however, none of the pairwise comparisons in post hoc analyses were statistically significantly different. There were no other statistically significant differences in platelet aggegrometry on days 1, 2, 3, 5, or 7. Aggregometry data are summarized in Table 1, and example aggregometry traces for days 0 and 7 are illustrated in Figure 5A, B.
Table 1.
Aggregometry variables over time for the platelet concentrate
| Day 0 | Day 1 | Day 2 | Day 3 | Day 5 | Day 7 | |
|---|---|---|---|---|---|---|
| AUC (AU × min), mean ± SD | 170.37 ± 94.92 | 179.62 ± 87.77 | 112.35 ± 115.69 | 75.95 ± 53.81 | 65.40 ± 49.44 | 59.57 ± 61.55 |
| Amplitude (%), mean ± SD | 39.00 ± 19.18abc | 33.83 ± 23.69de | 32.17 ± 17.28fg | 14.50 ± 9.09a | 8.67 ± 5.61bdf | 5.50 ± 7.01ceg |
| Slope (AU/min), median (range) | 46.5 (36‐53) | 47.0 (40‐53) | 47.0 (44‐53) | 48.0 (27‐53) | 53 (44‐58) | 33.5 (12‐51) |
| Lag time (min), median (range) | 26 (10‐147) | 11 (9‐134) | 130.5 (13‐486) | 9.5 (8‐486) | 14 (10‐488) | 246 (6‐490) |
Statistically significant differences are demonstrated by superscripted letters. adf P < .05, beg P < .01, c P < .001.
Abbreviation: AUC, area under the curve.
Figure 5.
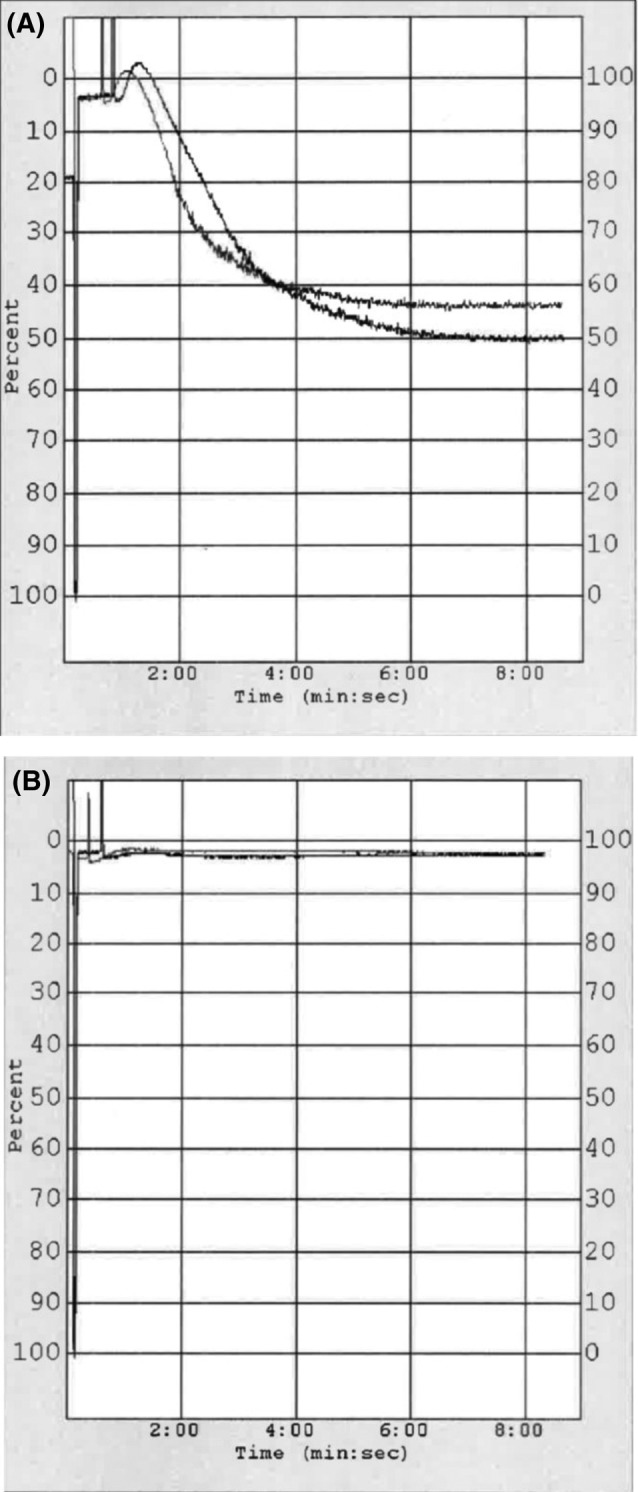
Platelet aggregometry graph traces taken from 2 different bags of the platelet concentrate on day 0 (A) and day 7 (B). Traces demonstrate the percentage of light transmission between the light source and photo cell, which increases as platelets aggregate in response to the agonist. On day 0 (A), both traces demonstrate a strong response to the agonist, as illustrated by the graph amplitude, compared to minimal response on day 7 (B)
Bacterial culture: No bacterial growth was present in any of the samples.
4. DISCUSSION
This study demonstrates a method of PC production from equine whole blood. A previous study demonstrated the production of autologous filter‐prepared PC for the treatment of suspensory branch injuries of horses yielding a 6‐mL product for intralesional use.5 Platelet concentrate production for the purpose of transfusion has not previously been described in horses and is of particular importance in neonatal foals with conditions including IMTP. The unit of PC with a final volume of approximately 120 mL allows a high concentration of PLTs to be delivered in a relatively small volume of plasma, thereby avoiding the adverse effects associated with volume overload of the cardiovascular system and excess protein and antigen administration.
All the units of PC reached the target of ≥5.5 × 10¹⁰ PLTs/unit and had a plasma pH ≥6.2 at the end of the 5‐day storage time, thus meeting the American Association of Blood Banks standards for human PC.6 Interestingly, when PRP and BC protocols were compared for preparation of canine PC, none of the PC units met this requirement.4 Another study evaluating a PRP method for production of canine PC demonstrated a mean PLT yield of 8 × 10¹⁰ per PC unit.7 Minimizing both WBC and RBC contamination in PC is important as RBC and WBC can enhance PLT aggregation and contribute to PLT activation. The presence of increased WBC in PC increases lactate production and glucose utilization and as such can considerably affect the metabolic activity of PC and therefore the quality of transfused PLTs.8 Furthermore, RBC contamination might result in reactions including hemolysis, alloimmunization, and allergic or anaphylactic reactions. Human PLT products might contain varying concentrations of WBC depending on the technique used in preparation. Some units might also contain more than trace RBC, which occurs more frequently with whole‐blood derived PLTs. In human medicine, RBC compatibility testing is performed when the PLT product is a pink to salmon color indicating more than trace RBC contamination.6 None of the PC products produced during this study were pink to salmon in color, and WBC and RBC counts were at acceptable levels in the PC produced using this methodology (quality requirement for WBC in PRP‐PC is <5 × 10⁶ cells/μL and <2 mL of RBC).6
Platelet concentrate products must be stored at room temperature, in gas‐soluble bags and constantly agitated to maintain viability of the PLTs.9 It is possible to keep human PLTs for as long as 8‐13 days; however, PLT components are the most likely blood products to be contaminated with bacteria, most commonly gram‐positive skin flora. Because of the risks of bacterial contamination, the recommended storage time is 5 days.10 There was no bacterial growth from the PC at any time point in the study, although it would still be pertinent to exercise the same caution with limiting the storage of the PC to 5 days as in other species.
Platelets undergo a variety of in vitro changes during storage, collectively known as the PSL. This lesion is characterized by a change in shape from discoid to spherical, increased lactate production, decrease in pH, release of granule contents, decrease in PLT function, and reduction in post‐transfusion PLT recovery and survival.11 The analysis of markers of PSL of the equine PC in this study was suggestive of ongoing PLT activation, with significantly higher lactate concentrations and lower bicarbonate and glucose concentrations over time in the PC. However, LDH activity did not show a statistically significant increase, which is usually associated with PSL in other species. The statistically significant decrease in aggregometry graph amplitude and AUC also support this hypothesis, suggesting a general diminishment of platelet function in vitro (ie, thrombin response) around days 3‐5 of storage.
Glucose is required for PLT metabolism and is used during PC storage; hence, the decrease in glucose concentrations in the PC over time was expected. This glucose metabolism also results in an expected increase in lactate production, as was demonstrated, along with a concurrent decrease in bicarbonate concentration and pH. The increase in PO2 over time in the PC was likely because of oxygen exchange across the gas permeable bags, potentially compounded by a decrease in cellular metabolic activity (and cell death) over time as would be expected with PSL where there is a decrease in oxygen utilization. Similarly, the decrease in PCO2 likely represents diffusion across the bag lining.
In dogs, transfused PLT survival in the circulation depends on the degree of thrombocytopenia and the type of PLT processing. As a set number of PLTs are needed for endothelial maintenance, in thrombocytopenic conditions, more PLTs will be utilized for this purpose, resulting in a decrease in PLT circulation time.12, 13 Studies in multiple species have shown that products containing platelets that are minimally handled, including fresh whole blood and fresh PC, survive the longest in the circulation with a half‐life of 3.5‐7 days.14, 15 This information remains unknown for horses.
Although the production of PC using the technique described does not require highly qualified staff, it does require specialized equipment which is a limitation in general practice. Furthermore, the overall time required to produce the product can range from 2 to 6 hours (depending on whether further processing is required due to increased RBC contamination), which might be too long in an acute hemorrhagic crisis situation. It is possible however to prepare product as needed (eg, for a neonatal foal) and store it for later use (and dispose of any unused at 5 days). It is unlikely that equine clinics would utilize platelet products on a regular enough basis to always have some on hand, as is the case for canine and human PC in many blood banks. Further studies are indicated to evaluate in vivo use of equine PC, including post‐transfusion survival of the PLTs and the effect of transfusion on the outcome of the case. Until that time, this product might be used for critical neonates with uncontrolled hemorrhage caused by thrombocytopenia or PLT dysfunction, to aid in short‐term hemostasis.
CONFLICT OF INTEREST DECLARATION
Authors declare no conflict of interest.
OFF‐LABEL ANTIMICROBIAL DECLARATION
Authors declare no off‐label use of antimicrobials.
INSTITUTIONAL ANIMAL CARE AND USE COMMITTEE (IACUC) OR OTHER APPROVAL DECLARATION
University of California, Davis IACUC approval, number 19571.
HUMAN ETHICS APPROVAL DECLARATION
Authors declare human ethics approval was not needed for this study.
ACKNOWLEDGMENT
The paper was presented as an abstract at The 2017 International Veterinary Emergency and Critical Care Symposium in Nashville, Tennessee.
Bozorgmanesh R, Magdesian KG, Sutton‐Burges JW, Owens SD, Tablin F. Equine platelet concentrate preparation and validation. J Vet Intern Med. 2019;33:1500–1506. 10.1111/jvim.15472
The work was performed at the School of Veterinary Medicine, University of California, Davis, California.
Funding information The Roberta A. and Carla Henry Endowed Chair in Emergency Medicine and Critical Care, University of California, Davis; Veterinary Blood Bank, University of California Davis
REFERENCES
- 1. Johns JL. Alterations in hemostasis In: Smith BP, ed. Large Animal Internal Medicine. 5th ed. St. Louis, MO: Mosby; 2015:393‐398. [Google Scholar]
- 2. Sellon DC, Levine J, Millikin E, Palmer K, Grindem C, Covington P. Thrombocytopenia in horses: 35 cases (1989‐1994). J Vet Intern Med. 1996;10:127‐132. [DOI] [PubMed] [Google Scholar]
- 3. Perkins GA, Miller WH, Divers TJ, Clark CK, Belgrave RL, Sellon DC. Ulcerative dermatitis, thrombocytopenia, and neutropenia in neonatal foals. J Vet Intern Med. 2005;19:211‐216. [DOI] [PubMed] [Google Scholar]
- 4. Hoareau GL, Jandrey KE, Burges J, Bremer D, Tablin F. Comparison of the platelet‐rich plasma and buffy coat protocols for preparation of canine platelet concentrates. Vet Clin Path. 2014;43:513‐518. [DOI] [PubMed] [Google Scholar]
- 5. Castelijns G, Crawford A, Scaffer J, Ortolano GA, Beauregard T, Smith RKW. Evaluation of filter‐prepared platelet concentrate for the treatment of suspensory branch injuries in horses. Vet Comp Orthop Traumatol. 2011;24:363‐369. [DOI] [PubMed] [Google Scholar]
- 6. Brecher ME. American Association of Blood Banks Technical Manual. Vol 35 Bethesda, MD: American Association of Blood Banks; 2002. [Google Scholar]
- 7. Abrams‐Ogg ACG, Kruth SA, Carter RF, Valli VE, Kamel‐Reid S, Dubé ID. Preparation and transfusion of canine platelet concentrates. Am J Vet Res. 1993;54:635‐642. [PubMed] [Google Scholar]
- 8. Gottschall JL, Johnston VL, Rzad L, Anderson AJ, Aster RH. Importance of white blood cells in platelet storage. Vox Sang. 1984;47:101‐107. [DOI] [PubMed] [Google Scholar]
- 9. Davidow EB, Brainard B, Martin LG, et al. Use of fresh platelet concentrate or lypophilized platelets in thrombocytopenic dogs with clinical signs of hemorrhage: a preliminary trial in 37 dogs. J Vet Emerg Crit Care. 2012;22:116‐125. [DOI] [PubMed] [Google Scholar]
- 10. American Association of Blood Banks . Standards for Blood Banks and Transfusion Services. 27th ed. Bethesda, MD: American Association of Blood Banks; 2011:51. [Google Scholar]
- 11. Brecher ME. American Association of Blood Banks Technical Manual. 15th ed. Bethesda: AABB; 2005. [Google Scholar]
- 12. Callan MB, Appleman EH, Sachais BS. Canine platelet transfusions. J Vet Emerg Crit Care. 2009;19:401‐415. [DOI] [PubMed] [Google Scholar]
- 13. Botsch V, Kuchenhoff H, Hartmann K, Hirschberger J. Retrospective study of 871 dogs with thrombocytopenia. Vet Rec. 2009;164:647‐651. [DOI] [PubMed] [Google Scholar]
- 14. Appleman EH, Sachais BS, Patel R, et al. Cryopreservation of canine platelets. J Vet Intern Med. 2009;23:138‐145. [DOI] [PubMed] [Google Scholar]
- 15. Valeri CR, MacGregor H, Barnard MR, Summaria L, Michelson AD, Ragno G. Survival of baboon biotin‐X‐N‐hydroxysuccinimide and 111In‐oxine labeled autologous fresh and lyophilized reconstituted platelets. Vox Sang. 2005;88:122‐129. [DOI] [PubMed] [Google Scholar]


