Abstract
Background
The protein 4.1 family is a family of cytoskeletal proteins that play an important role in maintaining normal cell morphology and cell adhesion, migration, division, and intercellular signaling. The main aim of this study was to explore the prognostic significance of the protein 4.1 family in breast cancer (BC) patients and to provide new biomarkers and therapeutic targets for the diagnosis and treatment of BC.
Material/Methods
The expression of 4.1 family members in various tumor types was compared to normal controls using the ONCOMINE and GOBO databases. The prognostic significance of the 4.1 family in BC patients was determined by Kaplan-Meier Plotter.
Results
EPB41L2 (4.1G) was expressed at higher levels in normal tissues compared with BC patients for all 4.1 family members. In survival analysis, 4.1G and EPB41 (4.1R) mRNA high expressions were associated with better survival in BC patients. Moreover, 4.1G high expression was significantly associated with longer overall survival (OS) in luminal A and protracted relapse-free survival (RFS) in luminal B subtype BC patients who received Tamoxifen treatment. In addition, high expression of each 4.1 family member also showed better prognostic value in different molecular subtypes of BC.
Conclusions
These results indicate that the protein 4.1 family can be regarded as novel biomarkers and potential therapeutic targets for BC. Further research is needed to explore the detailed biological functions.
MeSH Keywords: Biological Markers, Breast Neoplasms, Prognosis
Background
Breast cancer (BC) is a common malignancy that seriously threatens the health of women. In developed regions such as Europe and the United States, BC is the most prevalent cancer in females [1]. In China, the incidence of BC is increasing every year, and the average age of BC patients is gradually becoming younger [2]. Therefore, the diagnosis and treatment of BC are important, and new methods to accurately diagnose BC are urgently needed.
The protein 4.1 family plays a crucial role in the assembly and stability of protein complexes in plasma membranes [3]. It consists of 4 members, of which EPB41L3 (4.1B), EPB41L1 (4.1N), and EPB41 (4.1R) are expressed by sensory neurons in the peripheral nervous system, whereas EPB41L2 (4.1G) is expressed by myelinating Schwann cells [4–6]. This family of proteins is composed of 3 highly conserved domains: an N-terminal FERM domain, a spectrin-actin-binding domain (SABD), and a C-terminal domain (CTD) [6,7], which is responsible for the interconnection of cellular cortical skeleton with transmembrane proteins such as adhesion proteins and growth factor receptors [8]. It also regulates cell polarity, adhesion, movement, proliferation, and survival, and affects tumor cell movement, proliferation, invasion, and metastasis [9].
In recent years, many reports have confirmed that the expression of the protein 4.1 family in many malignancies is decreased or absent in varying degrees, and its abnormal expression can lead to tumorigenesis and tumor progression [9–11]. Although the protein 4.1 family has been identified as crucial in solid tumors [7,12] and many researchers have reported the significance of individual 4.1 family member expression [13,14], but the effect of different 4.1 members on tumorigenesis in BC is largely unknown.
In the present work, we compared the expression patterns of the 4.1 family between BC and normal tissues by using large databases to assess their prognostic values in various subtypes of BC.
Material and Methods
ONCOMINE analysis
By analyzing the ONCOMINE database (www.oncomine.org), we determined mRNA levels of 4.1 family members in different types of cancer. The thresholds were restricted as follows: p value: 0.05; fold change: 2; gene rank: 10%.
GOBO analysis
GOBO (http://co.bmc.lu.se/gobo/gsa.pl) is an online tool that allows quick estimation of gene expression levels, identification of co-expressed genes, and association with the results of individual genes, gene sets, or gene signatures in BC data sets. The transcription levels of the protein 4.1 family and its co-expressed genes were analyzed by uploading the corresponding Affymetrix probes to the GOBO database.
KM plotter database analysis
Prognostic values of characteristic 4.1 family members with specific high expression were found in BC samples by using a Kaplan-Meier plotter (http://kmplot.com/analysis/) [15] to show recurrence-free survival (RFS). The desired probe IDs representing the 4 genes were separately entered into the database to obtain the Kaplan-Meier plotter. Number of cases, median values of mRNA expression levels, HRs, 95% Cis, and p-values were extracted from the KM plotter webpage.
Results
Expression of the Protein 4.1 Family in BC
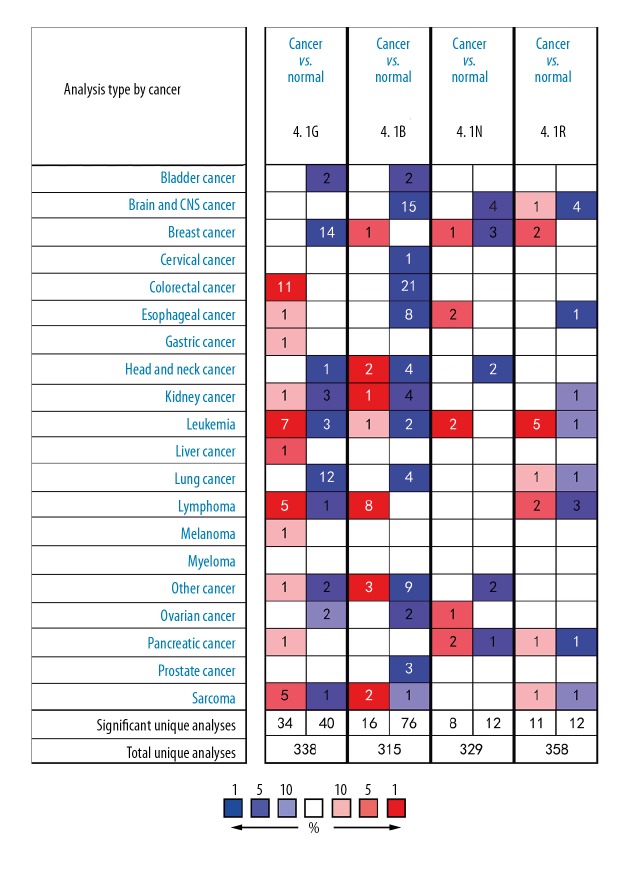
Four members of the 4.1 family have been found in human carcinoma, as well as hematological malignancies and solid tumors (Figure 1). In analysis of various datasets of different cancer types by ONCOMINE, all 14 studies exhibited decreased expression of 4.1G in BC compared with normal tissues. As illustrated in Table 1, a group of the datasets was investigated, including Curtis, TCGA, Richardson, Ma, Sorlie, and Radvanyi. The Curtis database, with 1556 samples, showed that protein 4.1G was 2.396-fold higher in normal tissues samples as compared to BC (p=1.37e–62) (Table 1). The TCGA database demonstrated protein 4.1G was 2.374-fold higher in normal tissues samples contrast to that in BC (p=8.51e–06). Several other datasets also revealed statistically significant differences in 4.1G high expression between normal tissues and BC. For 4.1B, only 1 dataset showed a statistically significant difference in 4.1B expression in cancer tissues than in normal tissues. According to the Turashvili dataset, 4.1B expression was 5.558-fold higher in BC compared with ductal breast cells and lobular breast cells (p=0.004) (Table 1). Moreover, there were 4 studies illustrating a significant difference in 4.1N, of which 1 showed that mRNA expression of 4.1N was higher in BC than in normal tissues, while 3 showed the opposite result (Table 1). Finally, 2 studies found that 4.1R expression in BC was significantly different from that in normal tissues. The Radvanyi dataset showed that 4.1R expression in invasive lobular breast carcinoma and invasive mixed breast carcinoma was 4.357-fold and 4.015-fold higher, respectively, than in normal tissues (Table 1).
Figure 1.
The mRNA expression of 4.1 family members in overall cancers. The figure shows the numbers of datasets with statistically significant mRNA overexpression (red) or underexpression (blue) of the target gene (cancer vs. normal tissue) with thresholds as follows: p value: 0.05; fold change: 2; gene rank: 10%; data type: mRNA. The number in the colored cell represents the number of analyses meeting these thresholds. Cell color is determined by the best gene rank percentile for the analyses within the cell.
Table 1.
Analyses of 4.1 family members in breast cancer.
| Gene | Dataset | Normal (Case) | Tumor (Case) | Fold change | P-value | t-Test |
|---|---|---|---|---|---|---|
| 4.1G | Curtis breast | Breast (144) | Invasive ductal breast carcinoma (1556) | −2.396 | 1.37E–62 | −26.734 |
| Breast (144) | Invasive lobular breast carcinoma (148) | −2.165 | 8.00E–52 | −18.777 | ||
| Breast (144) | Invasive ductal and invasive Lobular breast carcinoma (90) |
−2.273 | 7.05E–43 | −17.468 | ||
| Breast (144) | Tubular breast carcinoma (67) | −2.113 | 1.37E–33 | −15.415 | ||
| Breast (144) | Mucinous breast carcinoma (46) | −2.557 | 1.13E–27 | −16.042 | ||
| Breast (144) | Invasive breast carcinoma (21) | −2.49 | 7.86E–10 | −9.273 | ||
| Breast (144) | Ductal breast carcinoma in situ (10) | −2.327 | 4.03E–05 | −6.346 | ||
| TCGA-breast | Breast (61) | Mixed lobular and ductal breast carcinoma (7) | −2.374 | 8.51E–06 | −6.286 | |
| Breast (61) | Invasive ductal and lobular breast carcinoma (3) | −2.321 | 2.00E–03 | −5.734 | ||
| Breast (61) | Mucinous breast carcinoma (4) | −2.13 | 0.006 | −4.11 | ||
| Richardson breast 2 | Breast (7) | Ductal breast carcinoma (40) | −2.693 | 2.36E–05 | −4.859 | |
| Ma breast 4 | Breast (14) | Ductal breast carcinoma in situ epithelia (9) | −2.057 | 2.00E–03 | −3.583 | |
| Sorlie breast | Breast (4) | Lobular breast carcinoma (4) | −2.456 | 0.04 | −2.275 | |
| Radvanyi breast | Breast (9) | Ductal breast carcinoma in situ (3) | −2.177 | 4.10E–02 | −1.984 | |
| 4.1B | Turashvili breast | Ductal breast cell (10) Lobular breast cell (10) |
Invasive ductal breast carcinoma (5) | 5.558 | 4.00E–03 | 0.004 |
| 4.1N | Turashvili breast | Ductal breast cell (10) Lobular breast cell (10) |
Invasive ductal breast carcinoma (5) | −2.154 | 5.00E–03 | −2.836 |
| Sorlie breast | Breast (4) | Fibroadenoma (3) | −2.311 | 0.011 | −3.992 | |
| Sorlie breast (2) | Breast (4) | Fibroadenoma (3) | −2.104 | 2.40E–02 | −3.22 | |
| Radvanyi breast | Breast (9) | Invasive lobular breast carcinoma (6) | 2.254 | 0.016 | 2.393 | |
| 4.1R | Radvanyi breast | Breast (5) | Invasive lobular breast carcinoma (7) | 4.357 | 8.00E–03 | 2.948 |
| Breast (5) | Invasive mixed breast carcinoma (3) | 4.015 | 0.009 | 3.644 |
Expression of 4.1 family in different molecular subtypes of BC
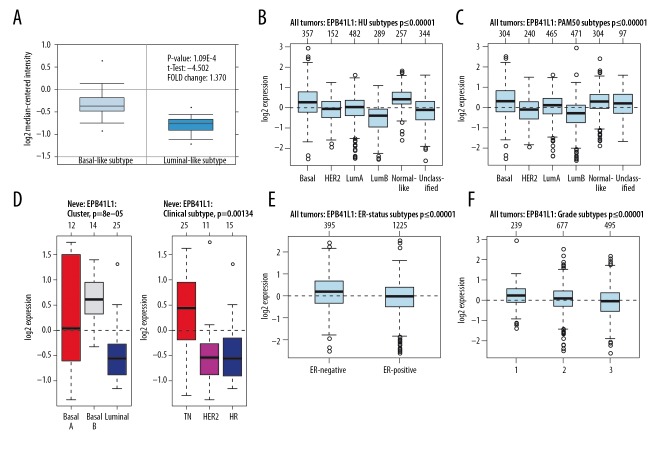
The potential significance of mRNA expression level of the 4.1 family was analyzed in different molecular subtypes of BC. The Farmer dataset [16] revealed that 4.1G expression was 1.370-fold higher in basal-like BC samples as compared to Luminal-like BC (p=1.09e–04) (Figure 2A). According to GOBO analysis [17], the 4.1G expression in basal-like BC cell samples was higher than that in luminal-like subtypes of BC. Analysis of tumor tissues demonstrated that 4.1G expression was the highest in basal and the lowest in luminal B subtypes of BC (Figure 2B, 2C). A similar result was found in cell lines, in which 4.1G expression in basal A and basal B cells were significantly higher than in luminal-like subtypes of BC (Figure 2D). Simultaneously, triple-negative (TN) cancer also expressed higher levels of 4.1G than hormone receptor (HR) and human epidermal growth factor receptor-2 (HER2+) subtypes of BC (Figure 2D). In addition, we found that the expression of 4.1G in estrogen receptor (ER)-positive BC was significantly higher than in ER-negative subtype BC (Figure 2E). As to BC grading, it appeared that the higher the grade, the lower expression of 4.1G (Figure 2F).
Figure 2.
The interrelationship of 4.1G expression in different subtypes of breast cancer (BC). (A) In ONCOMINE analysis, the level of 4.1G in basal-like BC was significantly higher than in luminal-like subtype of BC. (B–D) In GOBO analysis, basal-like expression was higherin 4.1G BC than in luminal A, luminal B, and human epidermal growth factor receptor-2 (HER2+) subtype of BC. In addition, triple-negative (TN) sensitive expression was higher in 4.1G than in HER2+ and hormone receptor (HR) subtype of BC. (E) Overexpression of 4.1G in estrogen receptor (ER)-negative BC was significantly higher than in ER-positive subtype of BC. (F) The expression of 4.1G was highest in grade l and lowest in grade 3 of BC.
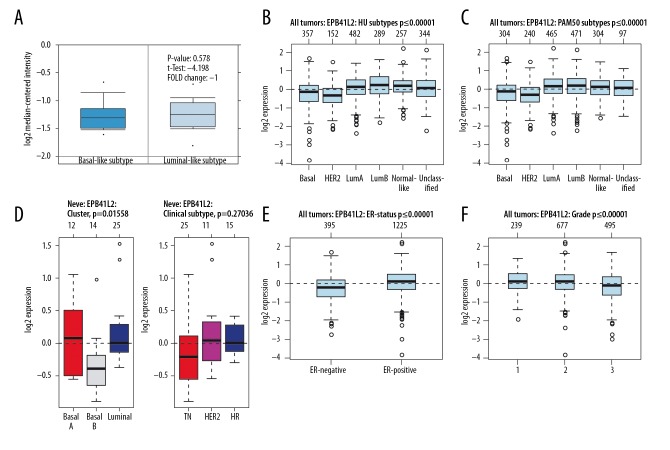
For 4.1N, there were no significant differences between basal-like BC and Luminal-like BC (p=0.578) (Figure 3A). In BC tissues, the highest 4.1N expression was seen in luminal B and the lowest expression was found in HER2+ subtypes of BC (Figure 3B, 3C). Analysis of cell lines indicated that 4.1N expression in basal B was distinctly lower than that in basal A and luminal subtypes of BC (Figure 3D). When compared with ER-negative BC, 4.1N was higher in ER-positive subtype of BC (Figure 3E), and it was negatively correlated with the BC classification (Figure 3F).
Figure 3.
The interrelationship of 4.1N expression in different subtypes of BC. (A) In ONCOMINE analysis, 4.1N expression showed no significant difference between basal-like and luminal-like subtype of BC. (B, C) In GOBO analysis, luminal A and luminal B express higher 4.1N than basal-like subtype of BC. (D) There was no significant difference of 4.1N expression between basal-like and luminal-like subtype of BC, while TN was expressed at a lower level in 4.1N than in HER2+ and HR subtypes of BC. (E) The ER-positive expression was higher in 4.1N than in ER-negative of BC. (F) The expression of 4.1G was highest in grade l and lowest in grade 3 of BC.
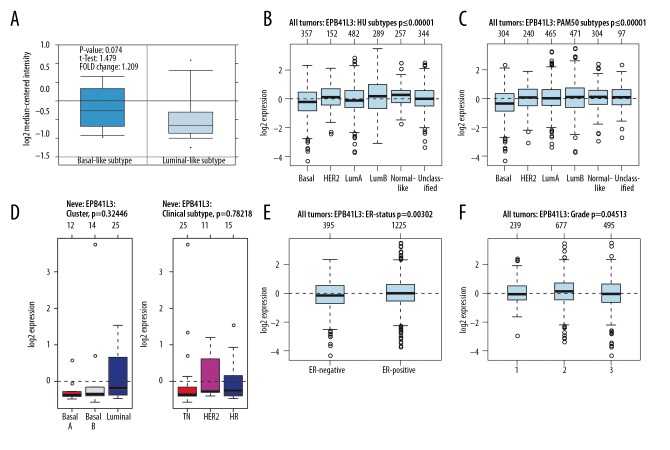
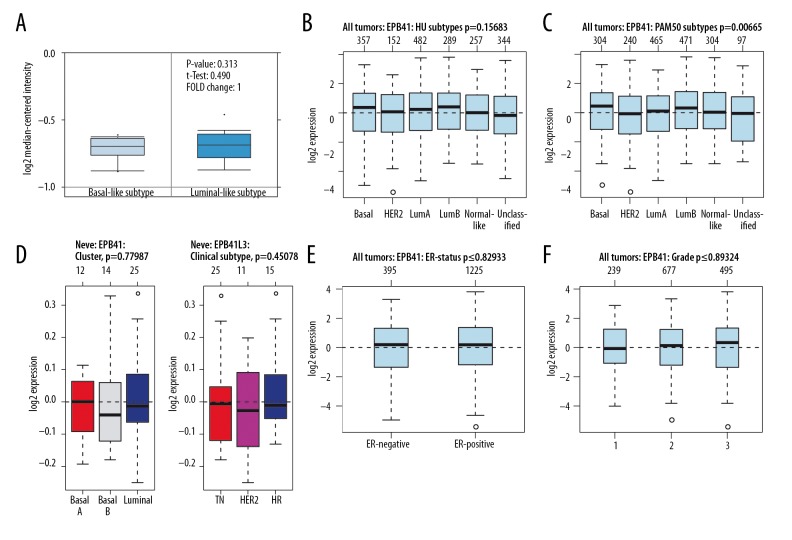
No significant difference was found in the mRNA expression of 4.1B between basal-like and luminal-like subtypes of BC (p=0.074) (Figure 4A). In BC tissues, the expression of 4.1B was the highest in luminal B and the lowest in basal-like subtypes of BC (Figure 4B, 4C). However, the expression of 4.1B had no significant difference in cell lines (Figure 4D). 4.1B expression was shown to be upregulated in ER-positive BC, which was reversed in ER-negative subtype of BC (Figure 4E). In BC grading, the highest expression of 4.1B was grade 2 (Figure 4F). Similarly, we found that the expression of 4.1R was not significantly different between basal-like and luminal-like subtypes of BC (p=0.313) (Figure 5A). Moreover, there was no significant difference in 4.1R expression between basal-like and luminal-like subtypes of BC, both in tissue samples and cell lines, and similar outcomes were found in TN, HER2+, and HR subtypes of BC (Figure 5B–5D). Likewise, no significant difference was found in ER subtypes and tumor grade (Figure 5E, 5F).
Figure 4.
The interrelationship of 4.1B expression in different subtypes of BC. (A) In ONCOMINE analysis, 4.1B expression showed no significant difference between basal-like and luminal-like subtype of BC. (B–D) In GOBO analysis, there was no significant difference of 4.1B expression between basal-like and luminal-like subtype of BC. The same result was also reflected in TN, HER2+, and HR subtypes of BC. (E) ER-positive express higher 4.1B than ER-negative subtype of BC. (F) The expression of 4.1B was highest in grade 2.
Figure 5.
The interrelationship of 4.1R expression in different subtypes of BC. (A) In ONCOMINE analysis, 4.1R expression showed no significant difference between basal-like and luminal-like subtype of BC. (B–D) In GOBO analysis, there was no significant difference of 4.1R expression between basal-like and luminal-like subtypes of BC, similar to TN, HER2+, and HR subtypes of BC. (E) No significant difference was found in 4.1R expression between ER-positive and ER-negative subtypes of BC. (F) The expression of 4.1R was highest in grade 3 and lowest in grade 1 of BC.
Transcription levels and prognostic significance of 4.1 family in different molecular subtypes of BC
The prognostic effect of mRNA expression level of each 4.1 family member in BC was evaluated using the KM Plotter database. Subsequently, different prognoses for the 4.1 protein family members in different BC subtypes were analyzed and are discussed separately.
4.1G and prognosis
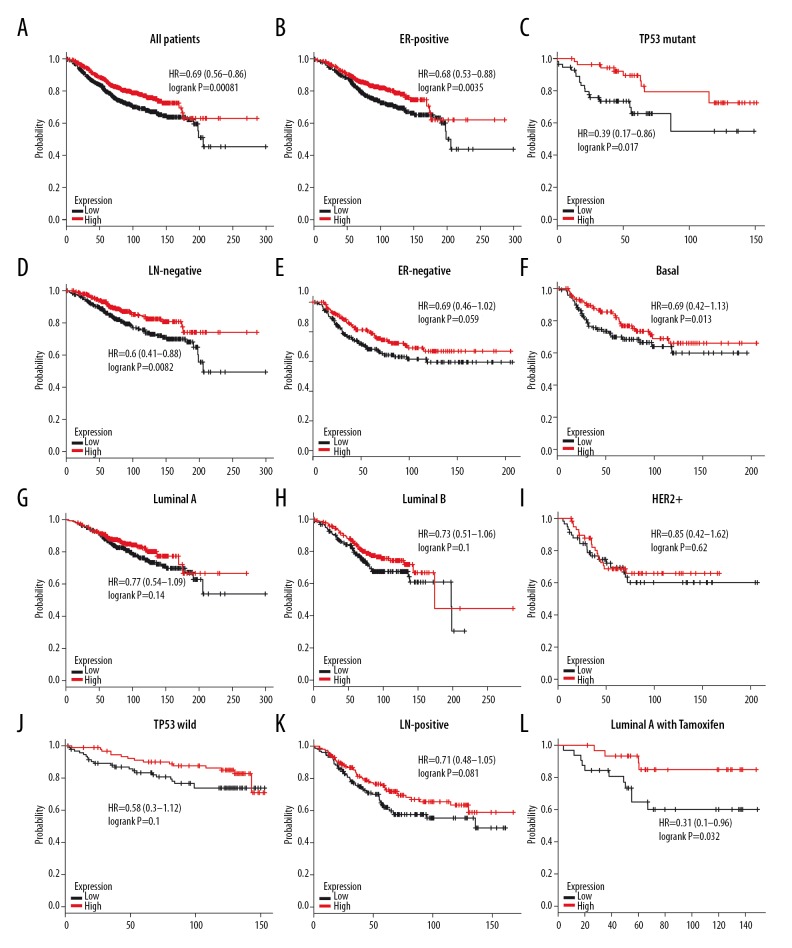
It was found that patients with high expression of 4.1G mRNA had better overall survival (OS) (HR=0.69, P=0.00081) in BC (Figure 6A). Subgroup analysis showed that increased mRNA levels of 4.1G was also related to better OS with ER-positive (HR=0.68, P=0.0035), TP53 mutation (HR=0.39, P=0.017), and lymph node (LN)-negative BC (HR=0.6, P=0.0082), but not in ER-negative (HR=0.69, P=0.059), basal-like (HR=0.69, P=0.13), luminal A (HR=0.77, P=0.14), luminal B (HR=0.73, P=0.1), and HER2+ (HR=0.85, P=0.62) subtypes of BC (Figure 6B–6I). Similarly, there was no significant difference in other BC subtypes, including TP53 wild (HR=0.58, P=0.1) and LN-positive (HR=0.71, P=0.081) subtypes of BC (Figure 6J, 6K). We further analyzed the correlation between prognosis and 4.1G expression in luminal-like subtype of BC patients after receiving Tamoxifen treatment, finding that patients with high expression of 4.1G showed better OS in luminal A BC (HR=0.31, P=0.032) (Figure 6L).
Figure 6.
The overall survival (OS) of 4.1G in BC. (A) High mRNA level of 4.1G was associated with longer OS in all BC patients. (B–D) High mRNA level of 4.1G was associated with longer OS in ER-positive, TP53 mutant, and LN-negative subtype BC patients. (E–K) High mRNA level of 4.1G was not associated with longer OS in basal-like, luminal A, luminal B, HER2+, TP53 wild, or LN-positive subtype BC patients. (L) High mRNA level of 4.1G was associated with longer OS in luminal A subtype BC patients with Tamoxifen treatment.
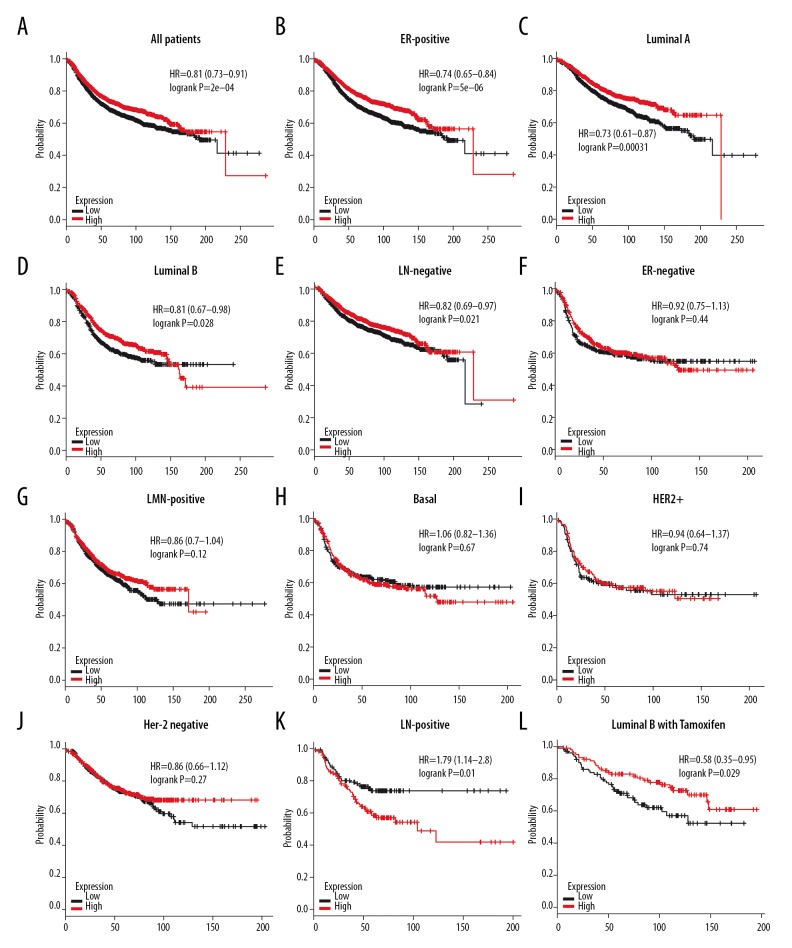
Likewise, patients with high expression of 4.1G mRNA had better FRS (HR=0.81, P=2e–04) (Figure 7A). Four subtypes of BC – ER-positive (HR=0.74, P=5e–06), luminal A (HR=0.73, P=0.00031), luminal B (HR=0.81, P=0.028), and LN-negative (HR=0.82, P=0.021) – with high 4.1G expression had longer RFS (Figure 7B–7E). Unfortunately, no significant difference was found in ER-negative (HR=0.92, P=0.44), LN-positive (HR=0.86, P=0.12), basal-like (HR=1.06, P=0.67), HER2+ (HR=0.94, P=0.74), and Her-2-negative BC (HR=0.86, P=0.27), and worse RFS was found in Her-2-positive (HR=1.79, P=0.01) subtype BC patients (Figure 7F–7K). We also found that 4.1G high expression showed better RFS in luminal A BC patients after receiving Tamoxifen treatment (HR=0.58, P=0.029) (Figure 7L).
Figure 7.
The relapse-free survival (RFS) of 4.1G in BC. (A) High mRNA level of 4.1G was associated with longer RFS in all BC patients. (B–E) High mRNA level of 4.1G was associated with longer RFS in ER-positive, luminal A, luminal B, and LN-negative subtype BC patients. (F–J) High mRNA level of 4.1G was not associated with longer RFS in ER-negative, LN-positive, basal-like, HER2+, or Her-2 negative subtype BC patients. (K) High mRNA level of 4.1G was associated with worse RFS in Her-2-positive subtype BC patients. (L) High mRNA level of 4.1G was associated with longer RFS in luminal B subtype BC patients with Tamoxifen treatment.
4.1B and prognosis
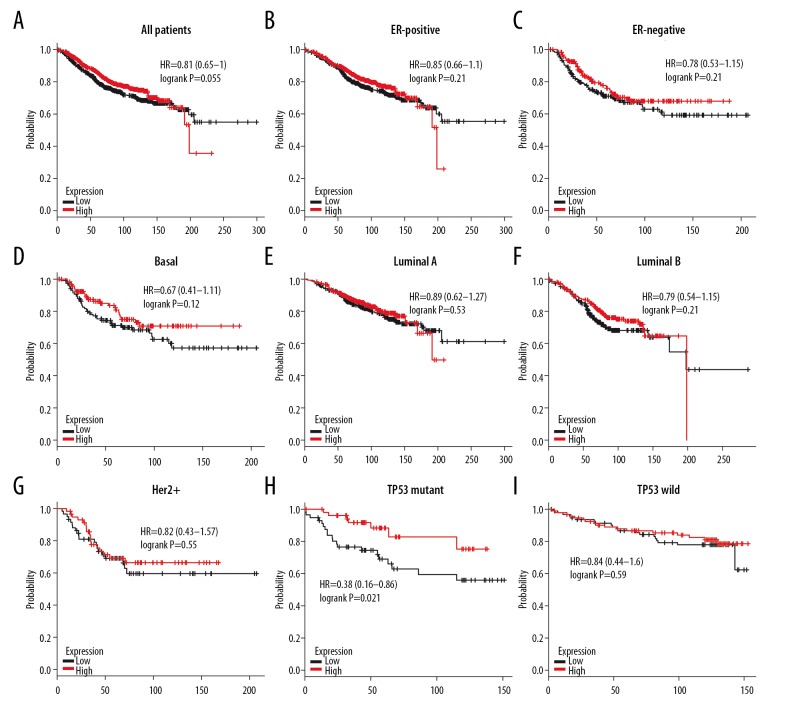
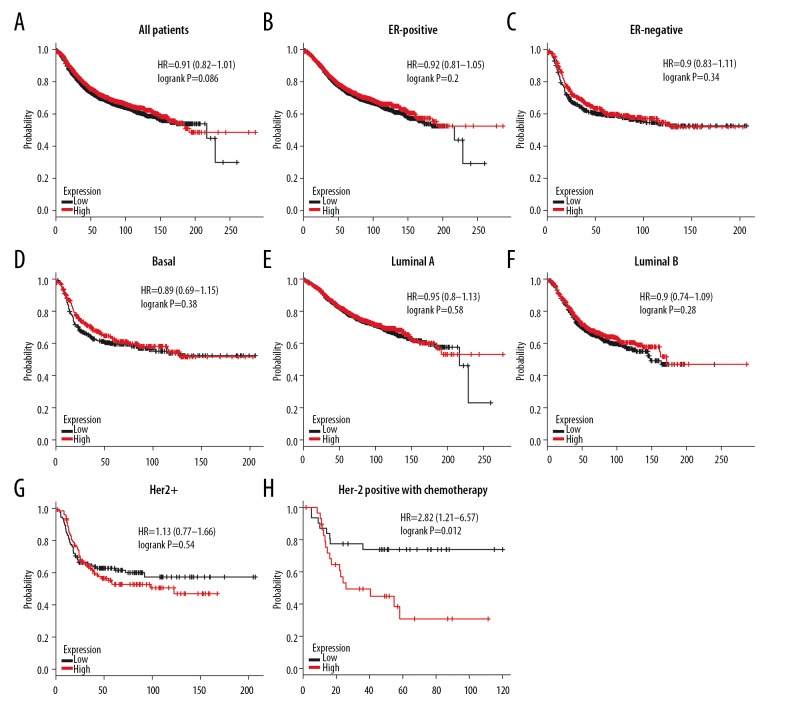
High expression of 4.1B did not show better OS (HR=0.81, P=0.055) in all BC patients (Figure 8A). Subgroup analysis also demonstrated that 4.1B overexpression did not give better OS in patients with ER-positive (HR=0.85, P=0.21), ER-negative (HR=0.78, P=0.21), basal-like (HR=0.67, P=0.12), luminal A (HR=0.89, P=0.53), luminal B (HR=0.79, P=0.21), or HER2+ BC (HR=0.82, P=0.55) (Figure 8B–8G). Conversely, high 4.1B expression had longer OS in TP53 mutant (HR=0.38, P=0.021), but no difference was found in TP53 wild BC (HR=0.84, P=0.59) (Figure 8H–8I). Similarly, 4.1B expression did not show better RFS in all BC patients’ RFS (HR=0.91, P=0.086) (Figure 9A). Subgroup analysis also found that 4.1B overexpression in patients with ER-positive (HR=0.92, P=0.2), ER-negative (HR=0.9, P=0.34), basal-like (HR=0.89, P=0.38), luminal A (HR=0.95, P=0.58), luminal B (HR=0.9, P=0.28), and HER2+ BC (HR=1.13, P=0.54) did not have better RFS (Figure 9B–9G). Unfortunately, we found worse RFS in Her-2-positive (HR=2.82, P=0.012) subtype BC patients with adjuvant chemotherapy (Figure 9H). These results indicate that 4.1B has a latent effect in TP53 mutant and Her-2-positive subtypes BC patients after having adjuvant chemotherapy.
Figure 8.
The OS of 4.1B in BC. (A) High mRNA level of 4.1B was not associated with longer OS in all BC patients. (B, C) High mRNA level of 4.1B was not associated with longer OS both in ER-positive or ER-negative BC patients. (D–G) High mRNA level of 4.1B was not associated with longer OS in basal-like, luminal A, luminal B, or HER2+ BC patients. (H, I) High mRNA level of 4.1B was associated with longer OS in TP-mutant, but not in TP-wild subtype BC patients.
Figure 9.
The RFS of 4.1B in BC. (A) High mRNA level of 4.1B was not associated with longer RFS in all BC patients. (B, C) High mRNA level of 4.1B was not associated with longer RFS both in ER-positive and ER-negative BC patients. (D–G) High mRNA level of 4.1B was not associated with longer RFS in basal-like, luminal A, luminal B, or HER2+ BC patients. (H) High mRNA level of 4.1B was associated with worse RFS in Her-2-positive subtype BC patients with chemotherapy.
4.1N and prognosis
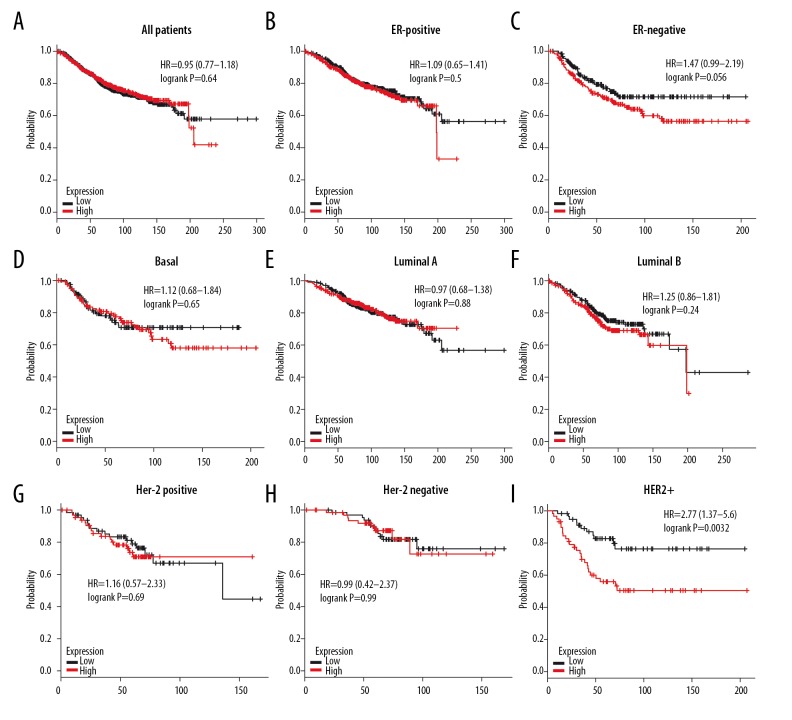
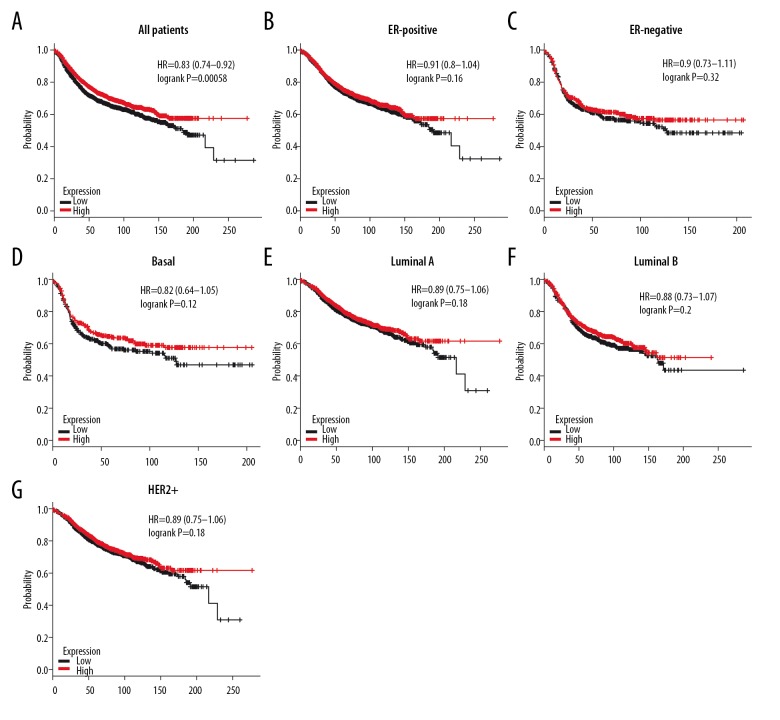
High expression of 4.1N was not associated with longer OS in all BC patients (HR=0.95, P=0.64) (Figure 10A). Similarly, high mRNA level of 4.1N revealed no better OS in ER-positive (HR=1.09, P=0.5), ER-negative (HR=1.47, P=0.056), basal-like (HR=1.12, P=0.65), luminal A (HR=0.97, P=0.88), luminal B (HR=1.25, P=0.24), Her-2-positive (HR=1.16, P=0.69), and Her-2-negative (HR=0.99, P=0.99) BC subtypes according to subgroup analysis (Figure 10B–10H). However, high expression of 4.1N showed a strong association with decreased OS in HER-2-positive (HR=2.77, P=0.0032) BC patients (Figure 10I). Fortunately, 4.1N high expression was associated with longer RFS in all BC patients (HR=0.83, P=0.00058) (Figure 11A), but not in ER-positive (HR=0.91, P=0.16), ER-negative (HR=0.9, P=0.32), basal-like (HR=0.82, P=0.12), luminal A (HR=0.89, P=0.18), luminal B (HR=0.88, P=0.2), and HER2+ (HR=0.89, P=0.18) subtypes (Figure 11B–11G). These results indicate that high 4.1N level might be a favorable factor for RFS of all BC patients, but was associated with high risk in HER2+ subtype patients.
Figure 10.
The OS of 4.1N in BC. (A) High mRNA level of 4.1N was not associated with longer OS in all BC patients. (B–H) High mRNA level of 4.1N was not associated with longer OS in ER-positive, ER-negative, basal-like, luminal A, luminal B, Her-2-positive, or Her-2-negative subtype BC patients. (I) High mRNA level of 4.1N was associated with worse OS in HER2+ subtype BC patients.
Figure 11.
The RFS of 4.1N in BC. (A) High mRNA level of 4.1N was not associated with longer RFS in all BC patients. (B, C) High mRNA level of 4.1N was not associated with longer RFS both in ER-positive and ER-negative BC patients. (D–G) High mRNA level of 4.1N was not associated with longer RFS in basal-like, luminal A, luminal B, or HER2+ BC patients.
4.1R and prognosis
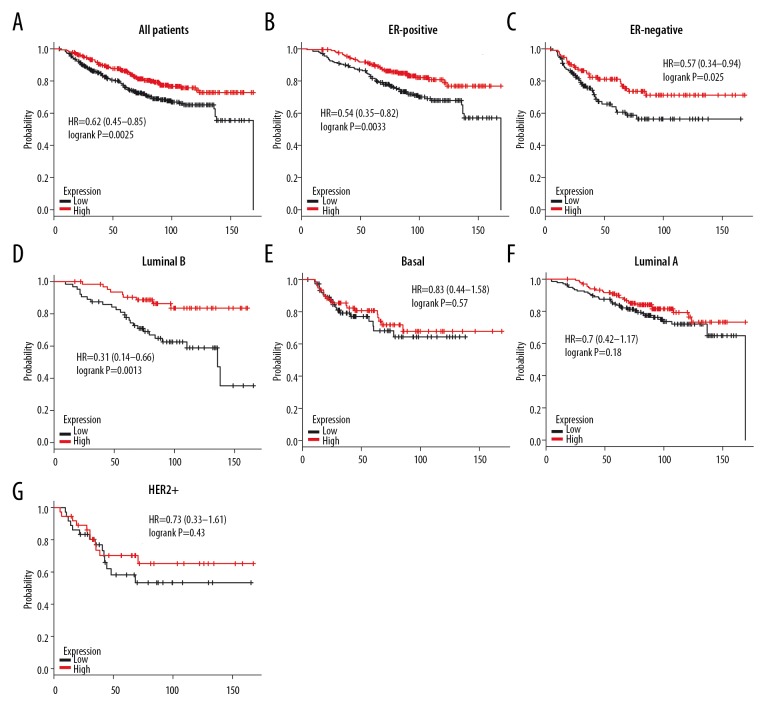
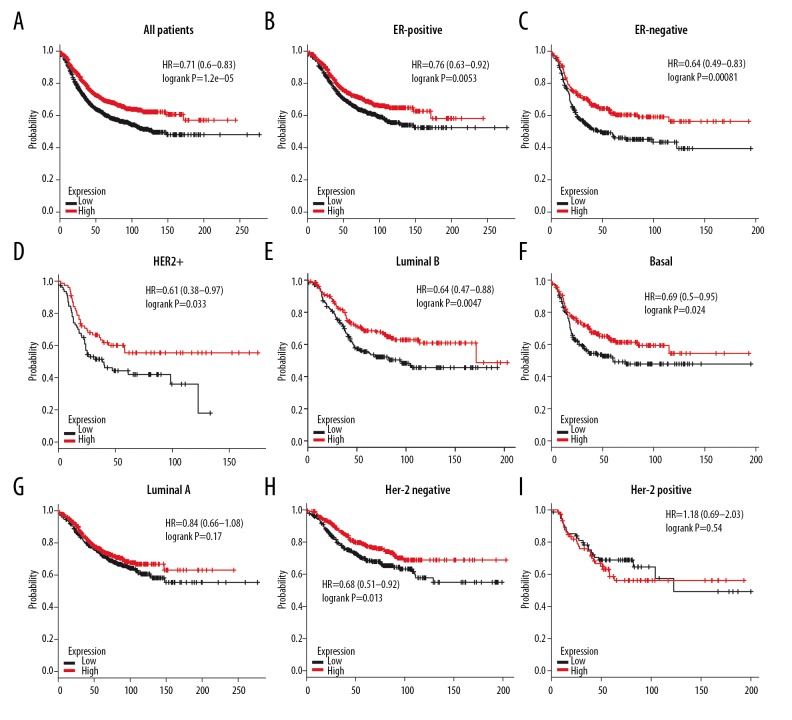
As demonstrated in Figure 12A, high level of 4.1R attained better OS in all BC patients (HR=0.62, P=0.0025). Subgroup analysis showed that high expression of 4.1R had better OS in ER-positive (HR=0.54, P=0.0033), ER-negative (HR=0.57, P=0.025), and luminal B BC (HR=0.31, P=0.0013), but not in basal-like (HR=0.83, P=0.57), luminal A (HR=0.7, P=0.18) and HER2+ (HR=0.73, P=0.43) subtypes BC patients (Figure 12B–12G), and high mRNA level of 4.1R achieved longer RFS in all BC patients (HR=0.71, P=1.2e–05) (Figure 13A). Subgroup analysis also demonstrated better RFS in ER-positive (HR=0.76, P=0.0053), ER-negative (HR=0.64, P=0.00081), HER2+ (HR=0.61, P=0.033), luminal B (HR=0.64, P=0.0047), and basal-like (HR=0.69, P=0.024), but not in luminal A (HR=0.84, P=0.17) subtypes of BC patients (Figure 13B–13G). Furthermore, we found a significant association between RFS and expression of 4.1R in Her-2-negative (HR=0.68, P=0.013) subtype BC patients but not in Her-2-negative BC patients (HR=1.18, P=0.54) (Figure 13H, 13I). In summary, 4.1R may has an important prognostic value for BC, especially for ER-positive, ER-negative, and luminal B subtype BC patients, and its high expression indicates a better survival rate.
Figure 12.
The OS of 4.1R in BC. (A) High mRNA level of 4.1R was associated with longer OS in all BC patients. (B, C) High mRNA level of 4.1R was associated with longer OS both in ER-positive and ER-negative BC patients. (D–G) High mRNA level of 4.1R was associated with longer OS in luminal B, but not in basal-like, luminal A and HER2+ BC patients.
Figure 13.
The RFS of 4.1R in BC. (A) High mRNA level of 4.1R was associated with longer RFS in all BC patients. (B, C) High mRNA level of 4.1R was associated with longer RFS both in ER-positive and ER-negative BC patients. (D–G) High mRNA level of 4.1R was associated with longer RFS in HER2+, luminal B, and basal-like, but not in luminal B BC patients. (H, I) High mRNA level of 4.1G was associated with longer RFS in Her-2 negative, but not in Her-2-positive subtype BC patients.
Discussion
BC is the leading cause of female death and the most common cancer among women worldwide [18]. Treatment of BC has been transformed from conventional surgery combined with radiotherapy or chemotherapy to comprehensive physical, endocrine, and biological treatments [19,20]. However, invasion and metastasis are still the primary factors affecting the prognosis of BC patients [21,22]. Epithelial-to-mesenchymal transition (EMT) may play an important role in the pathogenesis and progression of breast carcinoma [23,24]. Recently, a new theory from Scimeca et al. showed a correlation between EMT phenomenon and the formation of cells responsible for bone metastasis formation [25, 26]. They demonstrated that breast epithelial cells that acquire mesenchymal characteristics through the EMT phenomenon can assume an osteoblast-like phenotype under “bone morphogenetic proteins” induction [26]. There may be a potential link between 4.1 protein family and bone morphogenetic proteins, which provides a new direction for our future research.
Protein 4.1 family not only takes parts in maintaining cell morphology, linking cell surface mucin and cytoskeleton [27], but also plays a critical regulatory role in the development of cancer [22,28]. ONCOMINE co-expression analysis showed that mRNA expression level of 4.1 family was generally higher in normal tissues than in BC, and it also gave better OS and RFS in all BC patients. The result is consistent with a pilot study of ependymomas by Rajaram et al., revealing that mRNA expression of 4.1 family members in ependymomas had declined to varying degrees, and predicted a worse prognosis [11]. Although 4.1G expression in basal-like BC was higher than that in luminal-like subtypes of BC according to GOBO analysis, results did not show 4.1G overexpression had better progression in basal-like subtype BC patients. Conversely, high mRNA level of 4.1G was associated with better prognosis in luminal-like subtype BC patients and it also predicted better prognosis in ER-positive BC, which is regarded as a biomarker of luminal-like subtype. 4.1G overexpression acquired longer OS and RFS in luminal-like subtypes BC patients after receiving Tamoxifen treatment. Therefore, it was extrapolated that 4.1G may interacted with ER to improve prognosis in luminal-like subtype BC patients and it might be a sensitizer of Tamoxifen. In addition, 4.1G may also contribute to delay the progression of BC in other types, such as LN-negative and TP53-Mutant subtypes. It is confusing that 4.1G overexpression is associated with worse prognosis in Her-2-positive BC, although it was not significantly different in HER2+ subtype BC patients. These results suggest that 4.1G plays a unique role in inhibiting the development of some BC subtypes. However, due to the largely unexplored functions of 4.1G, there have been few investigations of the correlation between BC and 4.1G, which is regarded as a membrane skeletal protein. Chen et al. reported that the adhesion, spreading, and migration of 4.1G knockout mouse embryonic fibroblasts cells were significantly influenced through the β1 integrin pathway [29]. Therefore, we assumed that 4.1G may also interact with β1 integrin in BC to accelerate invasion and metastasis of cancer cells. Cui et al. found that CD147/basigin, a tumor-associated glycoprotein that carries β1, 6-N-acetylglucosamine (β1, 6-GlcNAc) glycans, was upregulated during EMT, which was correlated with tumor metastasis in hepatocellular carcinoma patients. By interrupting β1, 6-GlcNAc glycan modification in HCC cell lines affects the interaction of CD147/basigin with integrin β1 [30]. These results suggest that the integrin β1 pathway is one of the most important signaling pathways affecting EMT of tumors, and 4.1G may be one of the upstream signal transcription factors of the β1 integrin pathway, which regulates the invasion and metastasis of BC. Further well-designed and larger studies are necessary to confirm our assumptions.
The present results show that high expression of 4.1B is not associated with better prognosis in all patients nor in 4 molecular subtypes, but it contributes to longer OS in TP53 mutant subtype BC patients. However, high mRNA level of 4.1B was associated with worse RFS in Her-2-positive BC patients receiving adjuvant chemotherapy, but not in HER2+ subtype BC patients. Interestingly, Wong et al. found that loss of 4.1B promoted metastasis in an orthotopic xenotransplant model of prostate cancer, and 4.1B may act as a negative regulator of tumor progression [31]. Another study showed that hypermethylation of 4.1B genes and aberrant 4.1B were detected in primary BC [32]. Hence, it was hypothesized that 4.1B is an antagonist of adjuvant chemotherapy in Her-2-positive BC, and it is a favorable factor in TP53 subtype of BC.
High expression of 4.1N was associated with better RFS in general, and it had worse OS in HER2+ subtype BC patients. Perhaps 4.1N was an unfavorable factor for prognosis in HER2+ subtype. However, many studies have been proved that 4.1N inhibits tumor invasion and metastasis [33–35]. Zhang et al. also demonstrated that 4.1N inhibits hypoxia-induced EMT of epithelial ovarian cancer cells, at least partly via the regulation of HIF-1α [36]. Thus, it is difficult to draw firm conclusions about the diagnostic value of 4.1N and 4.1 B in BC. Further studies focusing more on these proteins are needed.
4.1R is a key membrane skeletal protein in erythrocytes, which contain a highly conserved region known as the FERM domain [36,37] that binds membrane proteins and lipids. It has been reported that 4.1R acts as a linker between the actin cytoskeleton and components of tight junctions and adherens junctions [37,38] and is involved in cell volume regulation and cell morphology [39]. Herein, we found that 4.1R overexpression provided longer OS and RFS in all BC patients and it also showed better prognosis in ER-positive and ER-negative subtypes BC patients according to subgroup analysis, as was also found in basal and luminal B subtypes BC patients. These results demonstrate there is no significant difference in the prognosis of 4.1R expression between basal-like and luminal-like subtypes, and 4.1R appears to have no direct correlation with gene ER. Additionally, 4.1R high expression is also correlated with better RFS in HER2+ and Her-2-negative BC, but not in Her-2-positive subtype BC patients; therefore, the association between 4.1R and the gene Her-2 could not be directly established. However, Ruiz-Saenz et al. reported that 4.1R interacts with cortical CLASP2 and also controls binding of CLASP2 to MTs at the cell edge to affect the movement of cells [40]. Therefore, we hypothesized that, due to the low expression of 4.1R in BC cells, the cancer cells lost their polarity and ability to migrate and invade, although the specific cellular mechanism remains unknown.
Conclusions
In the present study we systematically analyzed the mRNA expression levels and prognostic significance of 4.1 family in BC. 4.1G was expressed at higher levels in normal tissues than in BC tissues. Furthermore, 4.1G and 4.1R showed great prognostic significance for BC patients, and might be useful therapeutic targets and distinctive biomarkers in breast cancer.
Footnotes
Source of support: This work was sponsored by the Program for the Cultivation of Youth Talents in China, Association of Chinese Medicine (Shanming Ruan, no. QNRC2-C08, http://www.cacm.org.cn/); the Zhejiang Provincial Program for the Cultivation of High-Level Innovative Health Talents (Shanming Ruan, no. 2015-43, http://www.zjwjw.gov.cn/); the Zhejiang Provincial Program for the Cultivation of the Young and Middle-Aged Academic Leaders in Colleges and Universities (Shanming Ruan, no. 2017-248, http://www.zjedu.gov.cn/); and the Zhejiang Provincial Project for the key discipline of traditional Chinese Medicine (Yong Guo, no. 2017-XK-A09, http://www.zjwjw.gov.cn/)
Conflict of interest
None.
References
- 1.Siegel RL, Miller KD, Jemal A. Cancer statistics, 2018. Cancer J Clin. 2018;68(1):7–30. doi: 10.3322/caac.21442. [DOI] [PubMed] [Google Scholar]
- 2.Chen W, Zheng R, Baade PD, et al. Cancer Statistics in China, 2015. Cancer J Clin. 2018;68(1):7–30. doi: 10.3322/caac.21338. [DOI] [PubMed] [Google Scholar]
- 3.Cheng CL, Molday RS. Interaction of 4.1G and cGMP-gated channels in rod photoreceptor outer segments. J Cell Sci. 2013;126(Pt 24):5725–34. doi: 10.1242/jcs.137679. [DOI] [PMC free article] [PubMed] [Google Scholar]
- 4.Ivanovic A, Horresh I, Golan N, et al. The cytoskeletal adapter protein 4.1G organizes the internodes in peripheral myelinated nerves. J Cell Biol. 2012;196(3):337–44. doi: 10.1083/jcb.201111127. [DOI] [PMC free article] [PubMed] [Google Scholar]
- 5.Zhang J, Yang S, An C, Wang J, et al. Comprehensive characterization of protein 4.1 expression in epithelium of large intestine. Histochem Cell Biol. 2014;142(5):529–39. doi: 10.1007/s00418-014-1224-z. [DOI] [PubMed] [Google Scholar]
- 6.Wang L, Wang Y, Li Z, et al. Functional characterization of protein 4.1 homolog in amphioxus: Defining a cryptic spectrin-actin-binding site. Sci Rep. 2013;3:2873. doi: 10.1038/srep02873. [DOI] [PMC free article] [PubMed] [Google Scholar]
- 7.Sun CX, Robb VA, Gutmann DH. Protein 4.1 tumor suppressors: Getting a FERM grip on growth regulation. J Cell Sci. 2002;115(Pt 21):3991–4000. doi: 10.1242/jcs.00094. [DOI] [PubMed] [Google Scholar]
- 8.Baines AJ, Lu HC, Bennett PM. The Protein 4.1 family: Hub proteins in animals for organizing membrane proteins. Biochim Biophys Acta. 2014;1838(2):605–19. doi: 10.1016/j.bbamem.2013.05.030. [DOI] [PubMed] [Google Scholar]
- 9.Jung Y, McCarty JH. Band 4.1 proteins regulate integrin-dependent cell spreading. Biochem Biophys Res Commun. 2012;426(4):578–84. doi: 10.1016/j.bbrc.2012.08.129. [DOI] [PMC free article] [PubMed] [Google Scholar]
- 10.Zheng XY, Qi YM, Gao YF, et al. [Expression and significance of membrane skeleton protein 4.1 family in non-small cell lung cancer]. Ai Zheng. 2009;28(7):679–84. doi: 10.5732/cjc.008.10851. [in Chinese] [DOI] [PubMed] [Google Scholar]
- 11.Rajaram V, Gutmann DH, Prasad SK, et al. Alterations of protein 4.1 family members in ependymomas: A study of 84 cases. Mod Pathol. 2005;18(7):991–97. doi: 10.1038/modpathol.3800390. [DOI] [PubMed] [Google Scholar]
- 12.Men YL, Kang QZ, Ding C, et al. [Expression of protein 4.1 family in melanoma cell lines and its effect on cell proliferation]. Nan Fang Yi Ke Da Xue Xue Bao. 2016;36(5):649–54. [in Chinese] [PubMed] [Google Scholar]
- 13.Robb VA, Li W, Gascard P, Perry A, et al. Identification of a third Protein 4.1 tumor suppressor, Protein 4.1R, in meningioma pathogenesis. Neurobiol Dis. 2003;13(3):191–202. doi: 10.1016/s0969-9961(03)00071-8. [DOI] [PubMed] [Google Scholar]
- 14.Nagata M, Sakurai-Yageta M, Yamada D, et al. Aberrations of a cell adhesion molecule CADM4 in renal clear cell carcinoma. Int J Cancer. 2012;130(6):1329–37. doi: 10.1002/ijc.26160. [DOI] [PubMed] [Google Scholar]
- 15.Lanczky A, Nagy A, Bottai G, et al. miRpower: A web-tool to validate survival-associated miRNAs utilizing expression data from 2,178 breast cancer patients. Breast Cancer Res Treat. 2016;160(3):439–46. doi: 10.1007/s10549-016-4013-7. [DOI] [PubMed] [Google Scholar]
- 16.Farmer P, Bonnefoi H, Becette V, et al. Identification of molecular apocrine breast tumours by microarray analysis. Oncogene. 2005;24(29):4660–71. doi: 10.1038/sj.onc.1208561. [DOI] [PubMed] [Google Scholar]
- 17.Ringnér M, Fredlund E, Häkkinen J, et al. GOBO: Gene expression-based outcome for breast cancer online. PLoS One. 2011;6(3):e17911. doi: 10.1371/journal.pone.0017911. [DOI] [PMC free article] [PubMed] [Google Scholar]
- 18.van de Rest O, Berendsen AA, Haveman-Nies A, de Groot LC. Dietary patterns, cognitive decline, and dementia: A systematic review. Adv Nutr. 2015;6(2):154–68. doi: 10.3945/an.114.007617. [DOI] [PMC free article] [PubMed] [Google Scholar]
- 19.Kurebayashi J. Current clinical trials of endocrine therapy for breast cancer. Breast Cancer. 2007;14(2):200–14. doi: 10.2325/jbcs.954. [DOI] [PubMed] [Google Scholar]
- 20.Bischof J, Ignatov A. The role of targeted agents in the treatment of metastatic breast cancer. Breast Care (Basel) 2010;5(3):134–4. doi: 10.1159/000314996. [DOI] [PMC free article] [PubMed] [Google Scholar]
- 21.Tang X, Shi L, Xie N, et al. SIRT7 antagonizes TGF-β signaling and inhibits breast cancer metastasis. Nat Commun. 2017;8:318. doi: 10.1038/s41467-017-00396-9. [DOI] [PMC free article] [PubMed] [Google Scholar]
- 22.Lv B, Ma L, Tang W, et al. FXR acts as a metastasis suppressor in intrahepatic cholangiocarcinoma by inhibiting IL-6-induced epithelial-mesenchymal transition. Cell Physiol Biochem. 2018;48(1):158–72. doi: 10.1159/000491715. [DOI] [PubMed] [Google Scholar]
- 23.Zou R, Chen X, Jin X, et al. Up-regulated BCAR4 contributes to proliferation and migration of cervical cancer cells. Surg Oncol. 2018;27(2):306–13. doi: 10.1016/j.suronc.2018.05.013. [DOI] [PubMed] [Google Scholar]
- 24.Gyamfi J, Lee YH, Eom M, Choi J. Interleukin-6/STAT3 signalling regulates adipocyte induced epithelial-mesenchymal transition in breast cancer cells. Sci Rep. 2018;8(1):8859. doi: 10.1038/s41598-018-27184-9. [DOI] [PMC free article] [PubMed] [Google Scholar]
- 25.Scimeca M, Urbano N, Bonfiglio R, et al. Breast osteoblast-like cells: A new biomarker for the management of breast cancer. Br J Cancer. 2018;119(9):1129–32. doi: 10.1038/s41416-018-0255-y. [DOI] [PMC free article] [PubMed] [Google Scholar]
- 26.Scimeca M, Antonacci C, Toschi N, et al. Breast osteoblast-like cells: A reliable early marker for bone metastases from breast cancer. Clin Breast Cancer. 2018;18(4):e659–69. doi: 10.1016/j.clbc.2017.11.020. [DOI] [PubMed] [Google Scholar]
- 27.Yu H, Zhang Y, Ye L, Jiang WG. The FERM family proteins in cancer invasion and metastasis. Front Biosci (Landmark Ed) 2011;16:1536–50. doi: 10.2741/3803. [DOI] [PubMed] [Google Scholar]
- 28.Schulz WA, Ingenwerth M, Djuidje CE, et al. Changes in cortical cytoskeletal and extracellular matrix gene expression in prostate cancer are related to oncogenic ERG deregulation. BMC Cancer. 2010;10:505. doi: 10.1186/1471-2407-10-505. [DOI] [PMC free article] [PubMed] [Google Scholar]
- 29.Chen L, Wang T, Wang Y, et al. Protein 4.1G regulates cell adhesion, spreading, and migration of mouse embryonic fibroblasts through the β1 integrin pathway. J Biol Chem. 2016;291(5):2170–80. doi: 10.1074/jbc.M115.658591. [DOI] [PMC free article] [PubMed] [Google Scholar]
- 30.Cui J, Huang W, Wu B, et al. N-glycosylation by N-acetylglucosaminyltransferase V enhances the interaction of CD147/basigin with integrin β1 and promotes HCC metastasis. J Pathol. 2018;245(1):41–52. doi: 10.1002/path.5054. [DOI] [PMC free article] [PubMed] [Google Scholar]
- 31.Wong SY, Haack H, Kissil JL, et al. Protein 4.1B suppresses prostate cancer progression and metastasis. Proc Natl Acad Sci USA. 2007;104(31):12784–89. doi: 10.1073/pnas.0705499104. [DOI] [PMC free article] [PubMed] [Google Scholar]
- 32.Takahashi Y, Iwai M, Kawai T, et al. Aberrant expression of tumor suppressors CADM1 and 4.1B in invasive lesions of primary breast cancer. Breast Cancer. 2012;19(3):242–52. doi: 10.1007/s12282-011-0272-7. [DOI] [PubMed] [Google Scholar]
- 33.Ji Z, Shi X, Liu X, et al. The membrane-cytoskeletal protein 4.1N is involved in the process of cell adhesion, migration and invasion of breast cancer cells. Exp Ther Med. 2012;4(4):736–40. doi: 10.3892/etm.2012.653. [DOI] [PMC free article] [PubMed] [Google Scholar]
- 34.Wang Z, Ma B, Li H, et al. Protein 4.1N acts as a potential tumor suppressor linking PP1 to JNK-c-Jun pathway regulation in NSCLC. Oncotarget. 2016;7(1):509–23. doi: 10.18632/oncotarget.6312. [DOI] [PMC free article] [PubMed] [Google Scholar]
- 35.Xi C, Ren C, Hu A, et al. Defective expression of protein 4.1N is correlated to tumor progression, aggressive behaviors and chemotherapy resistance in epithelial ovarian cancer. Gynecol Oncol. 2013;131(3):764–71. doi: 10.1016/j.ygyno.2013.08.015. [DOI] [PubMed] [Google Scholar]
- 36.Zhang L, Hu A, Li M, et al. 4.1N suppresses hypoxia-induced epithelial-mesenchymal transition in epithelial ovarian cancer cells. Mol Med Rep. 2016;13(1):837–44. doi: 10.3892/mmr.2015.4634. [DOI] [PubMed] [Google Scholar]
- 37.Azouzi S, Collec E, Mohandas N, et al. The human Kell blood group binds the erythroid 4.1R protein: New insights into the 4.1R-dependent red cell membrane complex. Br J Haematol. 2015;171(5):862–71. doi: 10.1111/bjh.13778. [DOI] [PMC free article] [PubMed] [Google Scholar]
- 38.Yang S, Guo X, Debnath G, et al. Protein 4.1R links E-cadherin/beta-catenin complex to the cytoskeleton through its direct interaction with beta-catenin and modulates adherens junction integrity. Biochim Biophys Acta. 2009;1788(7):1458–65. doi: 10.1016/j.bbamem.2009.03.022. [DOI] [PMC free article] [PubMed] [Google Scholar]
- 39.Bazzini C, Benedetti L, Civello D, et al. ICln: Anew regulator of non-erythroid 4.1R localisation and function. PLoS One. 2014;9(10):e108826. doi: 10.1371/journal.pone.0108826. [DOI] [PMC free article] [PubMed] [Google Scholar]
- 40.Ruiz-Saenz A, van Haren J, Sayas CL, et al. Protein 4.1R binds to CLASP2 and regulates dynamics, organization and attachment of microtubules to the cell cortex. J Cell Sci. 2013;126(Pt 20):4589–601. doi: 10.1242/jcs.120840. [DOI] [PubMed] [Google Scholar]


