Abstract
While colonoscopy is the gold standard for diagnosis and classification of colorectal cancer (CRC), its sensitivity and specificity are operator-dependent and are especially poor for small and flat lesions. Contemporary imaging modalities, such as optical coherence tomography (OCT) and near-infrared (NIR) fluorescence, have been investigated to visualize microvasculature and morphological changes for detecting early stage CRC in the gastrointestinal (GI) tract. In our study, we developed a multimodal endoscopic system with simultaneous co-registered OCT and NIR fluorescence imaging. By introducing a contrast agent into the vascular network, NIR fluorescence is able to highlight the cancer-suspected area based on significant change of tumor vascular density and morphology caused by angiogenesis. With the addition of co-registered OCT images to reveal subsurface tissue layer architecture, the suspected regions can be further investigated by the altered light scattering resulting from the morphological abnormality. Using this multimodal imaging system, an in vivo animal study was performed using a F344-ApcPircUwm rat, in which the layered architecture and microvasculature of the colorectal wall at different time points were demonstrated. The co-registered OCT and NIR fluorescence images allowed the identification and differentiation of normal colon, hyperplastic polyp, adenomatous polyp, and adenocarcinoma. This multimodal imaging strategy using a single imaging probe has demonstrated the enhanced capability of identification and classification of CRC compared to using any of these technologies alone, thus has the potential to provide a new clinical tool to advance gastroenterology practice.
1. Introduction
Colorectal cancer (CRC) is the third most common type of cancer, consisting of about 10% of all cancer cases globally [1]. In 2012 alone, approximately 1.4 million new cases of, and almost 0.7 million deaths from, CRC were reported [2]. Colonoscopy (i.e., white light endoscopy) is the gold standard for CRC diagnostics as it provides visualization of abnormal tissue growth on the mucous membrane in the colon or rectum, known as colorectal polyps. In addition to CRC screening, physicians also utilize colonoscopy to excise small polyps, and biopsy larger polyps or tumors for further diagnosis, in a minimally invasive manner. However, several disadvantages of colonoscopy exist. While being the standard imaging technique, colonoscopy provides only surface morphology of the rectal wall and cannot resolve the abnormal layer architecture and subsurface microvasculature which are highly associated with CRC. Hence, cancer staging often requires biopsy, which not only is more invasive and time-consuming but also has diminishing accuracy limited by the sample number (four and six biopsy specimens yield accuracies of 68% and 78%, respectively) [3,4]. The size of the polyp also affects the accuracy of CRC diagnostics. The miss rate increases significantly in smaller sized polyps which is estimated to be as high as 26% for small polyps (< 5 mm) [5]. An imaging system that provides a high sensitivity and specificity for differentiating all kinds of polyps is therefore necessary.
To address the limitations of conventional colonoscopy, many endoscopic imaging modalities, such as endoscopic ultrasound (US), optical coherence tomography (OCT), Doppler OCT, photoacoustic (PA), and near-infrared (NIR) fluorescence imaging [6–20], have been applied in GI tract to visualize the layered architecture or subsurface vascular network for better CRC staging and management. Each modality has its own strengths and limitations. To improve the diagnostics accuracy, many groups focus on developing multimodality imaging systems (such as combined OCT/US, PA/US, and OCT/NIR fluorescence). Among them, combining OCT and NIR fluorescence allows cross-sectional visualization of the tissue morphology and vasculature with high spatial resolution and sensitivity, providing a powerful tool to monitor the hallmarks of CRC (i.e., morphological abnormality and angiogenesis). Furthermore, integrated OCT/NIR fluorescence imaging decreases the procedure cost and time as only one imaging probe is used to acquire both OCT and NIR fluorescence data in one session. Several multimodal OCT/NIR fluorescence systems [9,18,21–24] have been reported, demonstrating their capability of visualizing tissue morphology and molecular composition simultaneously. However, a successful clinical adaptation for CRC diagnostic imaging requires a combination of miniaturized endoscopic packing, FDA approved contrast agent, high-speed and high-resolution 3-dimensional (3D) imaging, and animal model validation. Currently, none of the reported systems has achieved all of the above prerequisites.
In this study, we combined OCT and NIR fluorescence into one imaging system and packaged the imaging probe into a miniature endoscope. OCT and NIR fluorescence imaging were performed simultaneously with high speed and high resolution. Using an FDA approved contrast agent ICG, we validated the multimodal system with a diseased rat model by demonstrating the capability to visualize the change in vascular density and morphology through NIR fluorescence and study the tissue layer architecture via co-registered OCT images. This allowed for real-time identification of suspect lesions with microscopic detail in vivo, leading to better determination of GI tract disorders. Through the animal study, our preliminary results from a rat model demonstrated the potential of the multimodality imaging system for detection of CRC and differentiation of cancer stages.
2. Methods
2.1 Contrast agent
Indocyanine green (ICG) is a fluorescent dye used in medical imaging as an indicator substance and was approved by the FDA in 1959. ICG binds 98% to plasma proteins and accumulates in the tumor region more than normal tissue after intravenous injection due to the “enhanced permeability and retention” effect caused by angiogenesis [25,26]. For this reason, ICG is widely used for angiogram and tumor border delineation [27,28]. Because of tumor vasculature is more dense and highly tortuous, the morphology and density of tumor vasculature can be used as biomarker for tumor detection. In this study, ICG was used to perform angiogram and identify the suspected tumor region based on the altered density and morphology of vasculature. ICG has a short half-life (~3 minutes) and is cleared from circulation exclusively by the liver to bile juice quickly. Therefore, the imaging will be performed right after the intravenous injection and finished in 3 minutes.
2.2 Animal model
Male rats from the F344-ApcPircUwm strain were used for this study. The rat model carries a knockout allele in the gatekeeper gene adenomatous polyposis coli (Apc) and has been designated the polyposis in the rat colon (Pirc) kindred, which can develop spontaneous intestinal lesions starting at the 45 days of age which then eventually expand to the colon and rectum [29]. This model has been widely used in longitudinal analysis of colorectal tumor biology, chemoprevention, microbiome effects, chemotherapy, and early detection.
2.3 Multimodal OCT and NIR fluorescence imaging system
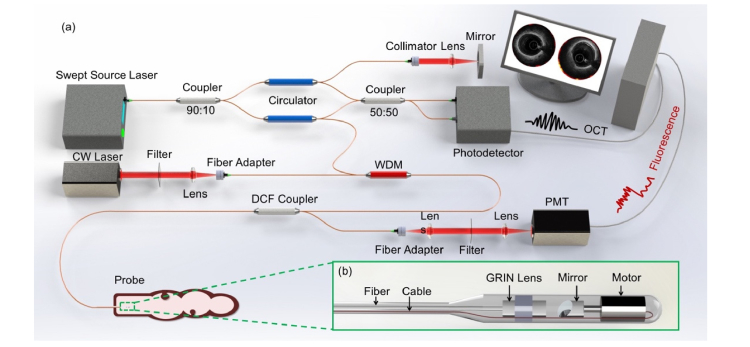
Figure 1(a) shows the schematic of the integrated multimodal OCT and NIR fluorescence imaging system. A wavelength division multiplexer (WDM) and a double clad fiber (DCF) are utilized to fully integrate OCT and NIR fluorescence together. Figure 1(b) shows a micromotor-based imaging probe, which is able to perform stable and fast 3D scanning. The system setup and probe design have been described previously [30]. In comparison to our previous design, the outer diameter of the imaging probe has been reduced to 1.6 mm to readily access the colon. In addition, an upgraded micromotor and correction algorithm were applied to provide a stable cross-sectional OCT/NIR fluorescence images. All the software was written entirely in C + + utilizing the graphics processing unit, which allows fast data processing and real-time display during the rat imaging.
Fig. 1.
(a) Overall design of endoscopic multimodality OCT and NIR fluorescence system. (b) Multimodality imaging probe. WDM: wavelength division multiplexer. PMT: photomultiplier tube. DCF coupler: double clad fiber coupler. OCT: optical coherence tomography. CW: continuous wavelength. GRIN: gradient index.
2.4 Imaging protocol
The male rats with a certified report were purchased from Rat Resource & Research Center. The rats were kept on a normal diet upon arrival and were imaged at weeks 1 (after 1 week of acclimatization), 4, and 8 to track the development of the colorectal tumor. To anesthetize the rat for the imaging procedure, the rat was first placed in a hermetically sealed plexiglass chamber for general anesthesia induction and was then removed from the chamber for an intraperitoneal injection of a ketamine-xylazine mixture (87 mg/kg and 10mg/kg, respectively). After the rat was anesthetized, an enema was performed to remove fecal matter from the rectum. Then, a plastic tube was inserted to inflate the rectum. After gently warming the rat tail, ICG (1.5mg/kg) was then administrated intravenously through either of the lateral tail veins, followed by immediate imaging in consideration of the fast-hepatic uptake and the short half-life of ICG (3-4 minutes). The entire imaging was performed and finished within less than 3 minutes after the ICG injection. 1,200 cross-sectional OCT/fluorescence images were acquired in each experiment by a ~4-cm longitudinal scan. The rat was sacrificed for hematoxylin and eosin (H&E) staining right after the last imaging (at week 8). All procedures were reviewed and approved by the Institutional Animal Care and Use Committee at the University of California, Irvine, under protocol #2016-3198.
3. Results
3.1 Dual modality imaging
Using our multimodal imaging system, the disease progression of CRC can be visualized by NIR fluorescence with co-registered OCT images. For NIR fluorescence imaging, the signal intensity is determined by the concentration of ICG and the distance from probe. A calibration map (intensity-to-distance) was obtained by measuring the intensity of fluorescence signal of a plastic tube filled with ICG at different distances. Then, NIR fluorescence image was calibrated using this calibration map according to the distance extracted from corresponding OCT images.
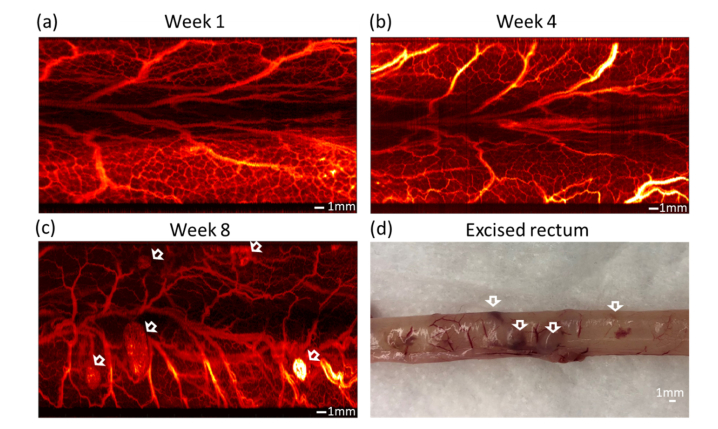
Figure 2 shows the representative fluorescence imaging results obtained at weeks 1, 4, and 8 from one of the mutation rats. Well-defined microvasculature without abnormality was demonstrated in the fluorescence images of week 1 [Fig. 2(a)] and week 4 [Fig. 2(b)]. No lesion was identified at these two time points. At week 8, several abnormal masses were found in the fluorescence image, indicative of lesions [Fig. 2(c), white arrows]. Figure 2(d) shows the excised rectum that corresponded to these lesions.
Fig. 2.
Unfolded NIR fluorescence images of rectal wall with different time points. (a) NIR fluorescence image at week 1. (b) NIR fluorescence image at week 4. (c) NIR fluorescence image at week 8. (d) Photo of the excised rectum. Scale bar: 1mm
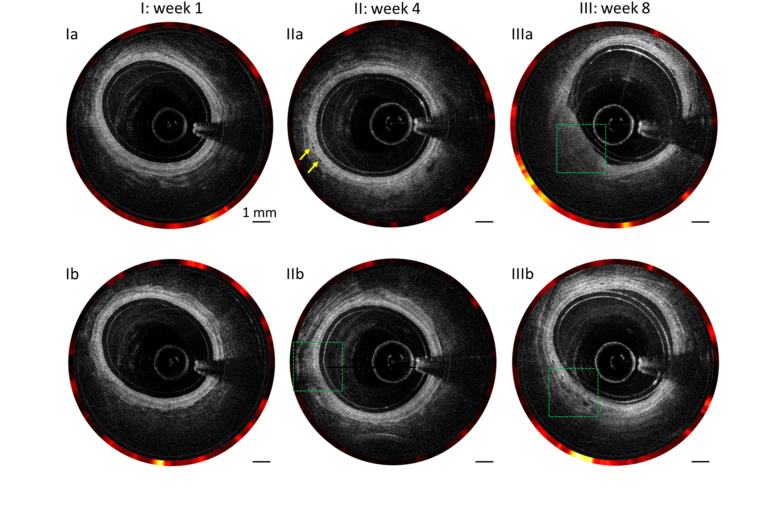
Figure 3 shows the corresponding co-registered OCT (inner) and NIR fluorescence (outer) images of the rat rectum at three time points. At week 1, the layer structures were well delineated and easily observed [Figs. 3(Ia) and (Ib)]. At week 4, the boundary between different layers indicated by the green dashed box in Fig. 3(IIb) became blurred. In addition, several small gaps, indicated by the yellow arrows, between the layers can be found in Fig. 3(IIa). At week 8, a large polyp [Fig. 3(IIIa)] and suspected adenocarcinoma [Fig. 3(IIIb)] were observed.
Fig. 3.
Combined OCT and NIR fluorescence B-scan images of colorectal wall with different time points: (I) week 1, (II) week 4, (III) week 8. Green dashed boxes: abnormal lesions. Yellow arrows: small gaps between different layers.
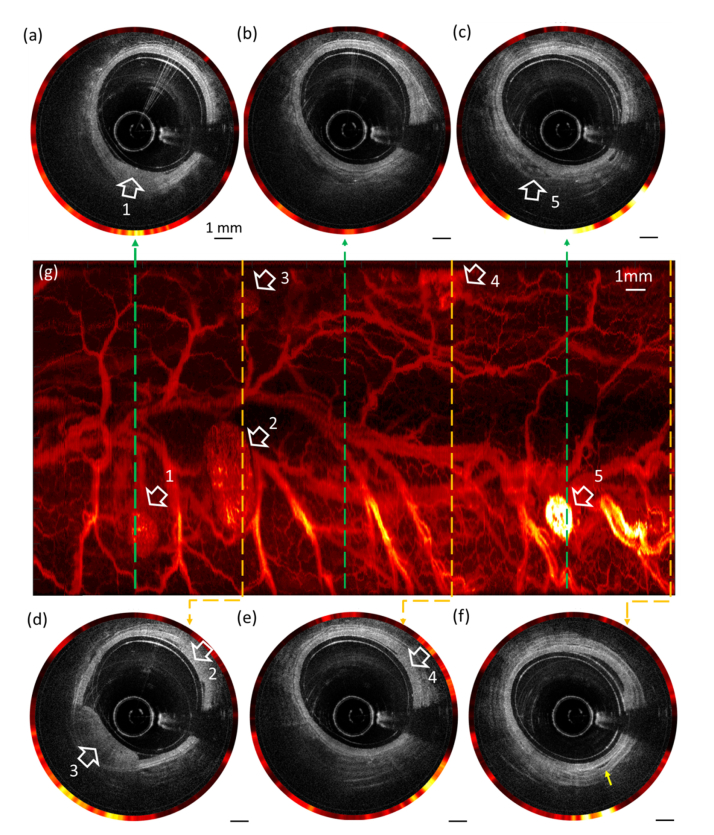
To demonstrate the benefit of dual modality imaging, Fig. 4 shows the en face 2D NIR fluorescence image and the corresponding co-registered OCT and NIR fluorescence images with abnormal morphology. From these 2D fluorescence images, polyps can be identified clearly, but the polyp’s types (raised or flat one) cannot be determined due to the lack of depth information. The white arrows in Fig. 4(g) indicate lesions, and each corresponds to a cross-sectional OCT image for better visualization of the abnormality. Figures 4(a), 4(c), 4(d), and 4(e) show the polyps in varying sizes. In Fig. 4(c), a region of low intensity with a disrupted layer structure can be observed, indicative of adenoma/adenocarcinoma. In Fig. 4(f), layer detachment can be found (indicated by the yellow arrows). In the NIR fluorescence image, the density of vasculature is much higher in abnormal regions (i.e., adenoma and hyperplastic polyps) and thus can help identify lesions and abnormalities quickly as the first step. In contrast, a healthy layered architecture is accompanied by a more homogenous NIR fluorescence signal [Fig. 4(b)].
Fig. 4.
Combined OCT and NIR fluorescence images and en face NIR fluorescence images of colorectal wall. (a)-(f) Combined OCT and NIR fluorescence images at different longitudinal positions. (g) En face NIR fluorescence images.
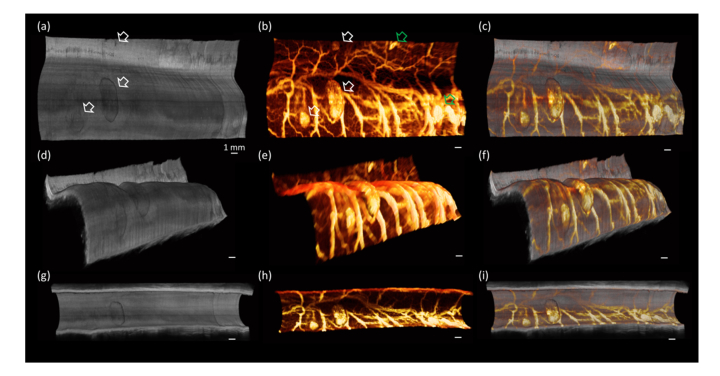
Figure 5 shows the 3D OCT, NIR fluorescence, and combined images of the colorectal wall. 3D reconstruction of OCT provides information on the shape of the lumen, and the fluorescence data is transformed and morphed into 3D rendering according to the lumen shape. The fluorescence images shown in 3D allows visualization and identification of polyp types (flat polyp or raised polyp). In Fig. 5, several polyps indicated by white arrows can be clearly identified from both 3D OCT and NIR images. With respect to the small polyps and flat polyps indicated by green arrows which are often missed by conventional colonoscopy, they can also be visualized by 3D NIR fluorescence images. Although small and flat polyps are difficult to find in 3D OCT images, they can be clearly identified by cross-sectional OCT images as shown in Figs. 3 and 4.
Fig. 5.
3D OCT and NIR fluorescence images. (a)-(f) En face 3D images of colorectal wall with different views (field of view: 0°-360°). (g)-(h) Volumetric 3D images of colorectal wall (field of view: 0°-250°).
3.2 Histological comparison
Histology of the sample was obtained and compared with the images obtained from the dual modality system for histological confirmation. All the histology photos were read by a histopathologist. Cases of a healthy rectum, a hyperplastic polyp, an adenoma, and adenocarcinoma are representatively presented as follows.
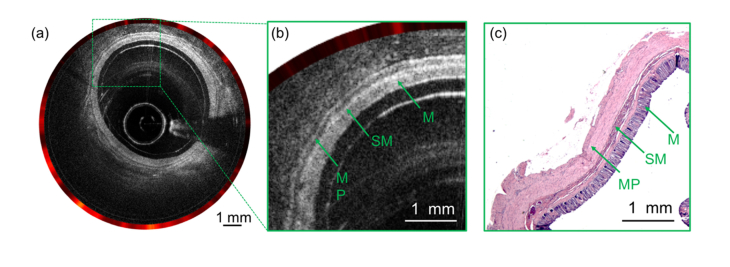
Healthy rectum: As demonstrated in Fig. 6, the OCT image shows well-defined layer structures and allows the differentiation of mucosa, submucosa, and muscularis propria [Fig. 6(b)] which is confirmed by histology [Fig. 6(c)]. In Fig. 6(a), the intensity of the NIR fluorescence signals is shown at the circumference of the OCT image, and the discrete brightness corresponds to the presence of the blood vessels.
Fig. 6.
Normal rectum. (a) The combined OCT and NIR fluorescence image. (b) Enlarged view of the dashed box in (a). (c) Histology. M: mucosa; SM: submucosa; MP: muscularis propria.
Hyperplastic polyp: Fig. 7 shows the results from a hyperplastic polyp. In the OCT image, the thickening in the mucosal layer can be observed, accompanied by a slight increase in the NIR fluorescence data. This thickened mucosa exhibits similar intensity with the adjacent healthy tissue, suggestive of a hyperplastic polyp (HP). Corresponding histology supporting findings of hyperplastic polyp with the dual modality data is shown in Fig. 7(c).
Fig. 7.
Hyperplastic polyp. (a) The combined OCT and NIR fluorescence image. (b) Enlarged view of the dashed box in (a). (c) Histology. HP: hyperplastic polyp.
Adenomatous polyp: In comparison to the hyperplastic polyp, adenoma exhibits further thickening in the mucosal layer [Fig. 8(b)]. In addition, due to the increased thickening, lower intensity in the deeper tissue layers with respect to the neighboring healthy tissue is also observed. In the deeper region, several dark patches are observed, indicating increased secretion of the optically transparent mucus by the cancer cells. The NIR fluorescence signal is also increased [Fig. 8(a)]. The corresponding histological evidence is shown in Fig. 8(c) in which the tubular structure can be clearly visualized.
Fig. 8.
Adenomatous polyp. (a) The combined OCT and NIR fluorescence image. (b) Enlarged view of the dashed box in (a). (c) Histology. AP: adenomatous polyp.
Adenocarcinoma: Fig. 9 shows a combined OCT and NIR fluorescence image of a rectum with adenocarcinoma. The OCT image shows the thickened mucosal layer and uneven dark areas, which are caused by high signal absorption in the necrotic tissue. Furthermore, the corresponding NIR fluorescence images show increased intensity. From the histology, a darker area, thickened mucosa, and large numbers of cancer cells can be identified that match the images well.
Fig. 9.
Adenocarcinoma. (a) The combined OCT and NIR fluorescence image. (b) Enlarged view of the dashed box in (a). (c) Histology.
4. Conclusion
While OCT and NIR fluorescence imaging each can individually provide clinically valuable information to supplement conventional white-light colonoscopy, combining these two imaging modalities further enhances the practicality of this dual-modality system. Colonoscopy allows viewing of the colorectal surface morphology and is intuitive for the surgeon, but because of lower sensitivity and specificity it cannot access information from subsurface tissue layers. With the multimodal imaging system, NIR fluorescence imaging can be used to identify the suspect lesions rapidly, and OCT endoscopy helps visualize the microanatomy of the subsurface layer structures with microscopic detail for further diagnosis, allowing better staging and diagnosis of GI tract disorders.
With histological confirmation, our results demonstrated the capability of the multimodal imaging system to identify and differentiate healthy tissue, hyperplastic polyps, adenomatous polyps, and adenocarcinoma. In NIR fluorescence images, the contrast is from vascular network. The vascular density gradually increases, and vascular morphology becomes more tortuous with disease progression. In OCT images, tissue layered architecture alters as the disease progresses. We observed that different types of polyps exhibit unique patterns, which can be used for differentiating polyps. In healthy colorectal wall, well-defined layers can be visualized: the intensity of each layer is uniform, and boundaries are well-demarcated. In hyperplastic polyps, mucosal thickening is observed, and the OCT signal intensity of the thickened mucosa is similar to the neighboring healthy tissue. In adenomatous polyps, mucosal thickening is also visualized, but the OCT signal intensity is reduced in contrast with the surrounding normal tissue due to lowered light scattering. For the adenocarcinoma, boundaries are blurred and intensity of OCT images are non-uniform (e.g., the uneven dark areas in Fig. 9).
The endoscopic multimodal imaging is minimally invasive and can be performed in real time. With its small size (probe outer diameter < 3 mm), the multimodal imaging probe can access the colon through the accessory channel of a commercial endoscope. This approach can be easily integrated into clinical practice as surgeons can still rely on intuitive colonoscopy guidance but also gain additional subsurface information provided by the multimodal imaging system. Such integration can help differentiate polyps observed by colonoscopy to provide a better diagnostic yield.
Future studies will focus on determining sensitivity and specificity of the proposed multimodal imaging system with respect to colorectal cancer. A larger sample size will be proposed for quantitative analysis. Additionally, it is also possible to utilize autofluorescence rather than NIR fluorescence, which can eliminate the need of a contrast agent, further reducing the invasiveness of our multimodal approach.
Acknowledgments
This research is supported by grants to Z. Chen from National Institutes of Health (R01HL-125084, R01HL-127271, R01EY-026091, and R01EY-028662); and Air Force Office of Scientific Research (FA9550-17-1-0193). Y. Li is supported by American Heart Association (18PRE34050021); J. Chen is supported by National Science Foundation (DGE-1839285); and S. Kim and P. S. Chung are supported by Ministry of Science and ICT (NRF-2018K1A4A3A02060572).
Funding
National Institutes of Health (R01HL-125084, R01HL-127271, R01EY-026091, and R01EY-028662); Air Force Office of Scientific Research (FA9550-17-1-0193); American Heart Association (18PRE34050021); National Science Foundation (DGE-1839285); Ministry of Science and ICT (NRF-2018K1A4A3A02060572).
Disclosures
Dr. Chen has a financial interest in OCT Medical Imaging, Inc., which, however, did not support this work.
References
- 1.Bray F., Ferlay J., Soerjomataram I., Siegel R. L., Torre L. A., Jemal A., “Global cancer statistics 2018: GLOBOCAN estimates of incidence and mortality worldwide for 36 cancers in 185 countries,” CA Cancer J. Clin. 68(6), 394–424 (2018). 10.3322/caac.21492 [DOI] [PubMed] [Google Scholar]
- 2.Stewart B. W., Wild C., International Agency for Research on Cancer, and World Health Organization, World cancer report 2014, pp. xiv, 630 pages. [Google Scholar]
- 3.Winawer S. J., Leidner S. D., Hajdu S. I., Sherlock P., “Colonoscopic biopsy and cytology in the diagnosis of colon cancer,” Cancer 42(6), 2849–2853 (1978). [DOI] [PubMed] [Google Scholar]
- 4.Gado A., Ebeid B., Abdelmohsen A., Axon A., “Improving the Yield of Histological Sampling in Patients With Suspected Colorectal Cancer During Colonoscopy by Introducing a Colonoscopy Quality Assurance Program,” Gastroenterol. Res. 4(4), 157–161 (2011). 10.4021/gr334w [DOI] [PMC free article] [PubMed] [Google Scholar]
- 5.van Rijn J. C., Reitsma J. B., Stoker J., Bossuyt P. M., van Deventer S. J., Dekker E., “Polyp miss rate determined by tandem colonoscopy: a systematic review,” Am. J. Gastroenterol. 101(2), 343–350 (2006). 10.1111/j.1572-0241.2006.00390.x [DOI] [PubMed] [Google Scholar]
- 6.Tsai T. H., Ahsen O. O., Lee H. C., Liang K., Figueiredo M., Tao Y. K., Giacomelli M. G., Potsaid B. M., Jayaraman V., Huang Q., Cable A. E., Fujimoto J. G., Mashimo H., “Endoscopic optical coherence angiography enables 3-dimensional visualization of subsurface microvasculature,” Gastroenterology 147(6), 1219–1221 (2014). 10.1053/j.gastro.2014.08.034 [DOI] [PMC free article] [PubMed] [Google Scholar]
- 7.Harewood G. C., “Assessment of clinical impact of endoscopic ultrasound on rectal cancer,” Am. J. Gastroenterol. 99(4), 623–627 (2004). 10.1111/j.1572-0241.2004.04116.x [DOI] [PubMed] [Google Scholar]
- 8.Iseki K., Tatsuta M., Iishi H., Sakai N., Yano H., Ishiguro S., “Effectiveness of the near-infrared electronic endoscope for diagnosis of the depth of involvement of gastric cancers,” Gastrointest. Endosc. 52(6), 755–762 (2000). 10.1067/mge.2000.110455 [DOI] [PubMed] [Google Scholar]
- 9.Yuan S., Roney C. A., Wierwille J., Chen C. W., Xu B., Griffiths G., Jiang J., Ma H., Cable A., Summers R. M., Chen Y., “Co-registered optical coherence tomography and fluorescence molecular imaging for simultaneous morphological and molecular imaging,” Phys. Med. Biol. 55(1), 191–206 (2010). 10.1088/0031-9155/55/1/011 [DOI] [PMC free article] [PubMed] [Google Scholar]
- 10.Li Y., Jing J., Qu Y., Miao Y., Zhang B., Ma T., Yu M., Zhou Q., Chen Z., “Fully integrated optical coherence tomography, ultrasound, and indocyanine green-based fluorescence tri-modality system for intravascular imaging,” Biomed. Opt. Express 8(2), 1036–1044 (2017). 10.1364/BOE.8.001036 [DOI] [PMC free article] [PubMed] [Google Scholar]
- 11.Mascagni D., Corbellini L., Urciuoli P., Di Matteo G., “Endoluminal ultrasound for early detection of local recurrence of rectal cancer,” Br. J. Surg. 76(11), 1176–1180 (1989). 10.1002/bjs.1800761121 [DOI] [PubMed] [Google Scholar]
- 12.Kirtane T. S., Wagh M. S., “Endoscopic Optical Coherence Tomography (OCT): Advances in Gastrointestinal Imaging,” Gastroent. Res. Pract. 2014, 376367 (2014). 10.1155/2014/376367 [DOI] [PMC free article] [PubMed] [Google Scholar]
- 13.Kubo T., Akasaka T., “Optical coherence tomography imaging: current status and future perspectives : Current and future developments in OCT,” Cardiovasc. Interv. Ther. 25(1), 2–10 (2010). 10.1007/s12928-009-0006-3 [DOI] [PubMed] [Google Scholar]
- 14.Yang V. X., Tang S. J., Gordon M. L., Qi B., Gardiner G., Cirocco M., Kortan P., Haber G. B., Kandel G., Vitkin I. A., Wilson B. C., Marcon N. E., “Endoscopic Doppler optical coherence tomography in the human GI tract: initial experience,” Gastrointest. Endosc. 61(7), 879–890 (2005). 10.1016/S0016-5107(05)00323-8 [DOI] [PubMed] [Google Scholar]
- 15.Iftimia N., Iyer A. K., Hammer D. X., Lue N., Mujat M., Pitman M., Ferguson R. D., Amiji M., “Fluorescence-guided optical coherence tomography imaging for colon cancer screening: a preliminary mouse study,” Biomed. Opt. Express 3(1), 178–191 (2012). 10.1364/BOE.3.000178 [DOI] [PMC free article] [PubMed] [Google Scholar]
- 16.Li Y., Jing J., Heidari E., Zhu J., Qu Y., Chen Z., “Intravascular Optical Coherence Tomography for Characterization of Atherosclerosis with a 1.7 Micron Swept-Source Laser,” Sci. Rep. 7(1), 14525 (2017). 10.1038/s41598-017-15326-4 [DOI] [PMC free article] [PubMed] [Google Scholar]
- 17.Ughi G. J., Wang H., Gerbaud E., Gardecki J. A., Fard A. M., Hamidi E., Vacas-Jacques P., Rosenberg M., Jaffer F. A., Tearney G. J., “Clinical Characterization of Coronary Atherosclerosis With Dual-Modality OCT and Near-Infrared Autofluorescence Imaging,” JACC Cardiovasc. Imaging 9(11), 1304–1314 (2016). 10.1016/j.jcmg.2015.11.020 [DOI] [PMC free article] [PubMed] [Google Scholar]
- 18.Mavadia J., Xi J., Chen Y., Li X., “An all-fiber-optic endoscopy platform for simultaneous OCT and fluorescence imaging,” Biomed. Opt. Express 3(11), 2851–2859 (2012). 10.1364/BOE.3.002851 [DOI] [PMC free article] [PubMed] [Google Scholar]
- 19.Li Y., Zhu Z. K., Jing J. C., Chen J. J., Heidari A. E., He Y. M., Zhu J., Ma T., Yu M. Y., Zhou Q. F., Chen Z. P., “High-Speed Integrated Endoscopic Photoacoustic and Ultrasound Imaging System,” IEEE J. Sel. Top. Quant. 25, 1 (2019). 10.1109/JSTQE.2018.2869614 [DOI] [PMC free article] [PubMed] [Google Scholar]
- 20.Li Y., Lin R., Liu C., Chen J., Liu H., Zheng R., Gong X., Song L., “In vivo photoacoustic/ultrasonic dual‐modality endoscopy with a miniaturized full field‐of‐view catheter,” J. Biophoton. 11, e201800034 (2018). 10.1002/jbio.201800034 [DOI] [PubMed] [Google Scholar]
- 21.Pahlevaninezhad H., Lee A. M., Hohert G., Lam S., Shaipanich T., Beaudoin E. L., MacAulay C., Boudoux C., Lane P., “Endoscopic high-resolution autofluorescence imaging and OCT of pulmonary vascular networks,” Opt. Lett. 41(14), 3209–3212 (2016). 10.1364/OL.41.003209 [DOI] [PubMed] [Google Scholar]
- 22.Winkler A. M., Rice P. F., Weichsel J., Watson J. M., Backer M. V., Backer J. M., Barton J. K., “In vivo, dual-modality OCT/LIF imaging using a novel VEGF receptor-targeted NIR fluorescent probe in the AOM-treated mouse model,” Mol. Imaging Biol. 13(6), 1173–1182 (2011). 10.1007/s11307-010-0450-6 [DOI] [PMC free article] [PubMed] [Google Scholar]
- 23.Tumlinson A. R., Hariri L. P., Utzinger U., Barton J. K., “Miniature endoscope for simultaneous optical coherence tomography and laser-induced fluorescence measurement,” Appl. Opt. 43(1), 113–121 (2004). 10.1364/AO.43.000113 [DOI] [PubMed] [Google Scholar]
- 24.Yoo H., Kim J. W., Shishkov M., Namati E., Morse T., Shubochkin R., McCarthy J. R., Ntziachristos V., Bouma B. E., Jaffer F. A., Tearney G. J., “Intra-arterial catheter for simultaneous microstructural and molecular imaging in vivo,” Nat. Med. 17(12), 1680–1684 (2011). 10.1038/nm.2555 [DOI] [PMC free article] [PubMed] [Google Scholar]
- 25.Wang H., Li X., Tse B. W. C., Yang H., Thorling C. A., Liu Y., Touraud M., Chouane J. B., Liu X., Roberts M. S., Liang X., “Indocyanine green-incorporating nanoparticles for cancer theranostics,” Theranostics 8(5), 1227–1242 (2018). 10.7150/thno.22872 [DOI] [PMC free article] [PubMed] [Google Scholar]
- 26.Yoneya S., Saito T., Komatsu Y., Koyama I., Takahashi K., Duvoll-Young J., “Binding properties of indocyanine green in human blood,” Invest. Ophthalmol. Vis. Sci. 39(7), 1286–1290 (1998). [PubMed] [Google Scholar]
- 27.DeLong J. C., Chakedis J. M., Hosseini A., Kelly K. J., Horgan S., Bouvet M., “Indocyanine green (ICG) fluorescence-guided laparoscopic adrenalectomy,” J. Surg. Oncol. 112(6), 650–653 (2015). 10.1002/jso.24057 [DOI] [PubMed] [Google Scholar]
- 28.Shen R., Zhang Y., Wang T., “Indocyanine Green Fluorescence Angiography and the Incidence of Anastomotic Leak After Colorectal Resection for Colorectal Cancer: A Meta-analysis,” Dis. Colon Rectum 61(10), 1228–1234 (2018). 10.1097/DCR.0000000000001123 [DOI] [PubMed] [Google Scholar]
- 29.Amos-Landgraf J. M., Kwong L. N., Kendziorski C. M., Reichelderfer M., Torrealba J., Weichert J., Haag J. D., Chen K. S., Waller J. L., Gould M. N., Dove W. F., “A target-selected Apc-mutant rat kindred enhances the modeling of familial human colon cancer,” Proc. Natl. Acad. Sci. U.S.A. 104(10), 4036–4041 (2007). 10.1073/pnas.0611690104 [DOI] [PMC free article] [PubMed] [Google Scholar]
- 30.Li Y., Jing J., Yu J., Zhang B., Huo T., Yang Q., Chen Z., “Multimodality endoscopic optical coherence tomography and fluorescence imaging technology for visualization of layered architecture and subsurface microvasculature,” Opt. Lett. 43(9), 2074–2077 (2018). 10.1364/OL.43.002074 [DOI] [PMC free article] [PubMed] [Google Scholar]


