Abstract
Phase-based OCT angiography of retinoblastoma regression patterns with a novel handheld 1050 nm clinical imaging system is demonstrated for the first time in children between 0 and 4 years old under general anesthesia. Angiography is mapped at OCT resolution by flow detection at every pixel with en-face projection from the volume between nerve fiber layer and retinal pigment epithelium. We show a striking difference between blood vasculature of healthy retina, and retinoblastoma regression patterns after chemotherapy, as well as varying complexity of abnormal vasculature in regression patterns types 2, 3, and 4. We demonstrate abnormal, tortuous and prominent vasculature in type 3 regression patterns having the highest risk of tumor recurrences and a lower probability to reduction into flat scars. The ability to visualize 3-D angiography might offer new insights in understanding of retinoblastoma development and its response to therapy.
1. Introduction
1.1 Retinoblastoma
Retinoblastoma (RB) is a retinal form of cancer that rapidly develops in infancy [1,2]. As a standard of clinical care, RB is diagnosed, staged and monitored by contact-mode funduscopy, ultrasonography, magnetic resonance imaging, and lately optical coherence tomography (OCT). Patients younger than 4 years of age are routinely imaged under inhalation anesthesia. The main challenges for the established diagnostic modalities are the real-time determination of tumor location, margins and vitality as well as differentiation between the vital tumor mass, types of regression patterns, and benign retinoma masses. Such clinical decisions are critical for both the initial diagnosis and monitoring treatment efficacy in follow-up imaging sessions. These follow-up evaluations under anesthesia are often the only reliable approach ocular oncologists have to validate their therapeutic decisions as the real-time visualization often leaves ambiguity. Critical time might be lost allowing for tumor (re)growth before it is detectable with the sensitivity and specificity of the standard imaging modalities. Moreover, a variety of local and systemic treatment options exists, and disease management is individualized for each patient. Deciding the optimal choice between chemotherapy treatment options (drug and dosage, local vs. systemic) requires subjective evaluation of standard funduscopy and any other imaging data by an expert. The improved local treatment modalities developed in recent years significantly increase the chances of eye preservation, but still leave the whole retina at risk of developing new tumors and recurrences. Therefore, there is a pressing need for real-time detection of active tumors, their recurrence and new tumors as early as possible to minimize the chances of unnecessary or overdue treatments, increasing the effectiveness of new localized treatment options, and ultimately preserve a better eye functionality.
In our clinical observation of retinoblastoma patients both within and beyond the cohort of this study, in some cases an RB tumor can consist of active and inactive region. After a treatment the active part can degrade fast leaving an inactive volume (retinoma/regression pattern) visible at a follow-up, where it can be misdiagnosed as a recurring malignancy. The structural OCT could not resolve this reliably in our ongoing study.
In this clinical trial we focused on retinoblastoma regression patterns developed in patients after chemotherapy. The regression patterns are classified into 5 types: no visible remnant (type 0), completely calcified remnant (type 1), completely non-calcified remnant (type 2), partially calcified remnant (type 3), and atrophic chorioretinal flat scar (type 4) [3]. Previous studies [4–6] have identified the primary factors that determine regression type after chemoreduction: subretinal seeds, size and location of the initial tumor; however a clear mechanism for their genesis has not been proposed. Types 3 and 4 were the most common regression patterns after treatment [5,7], especially for macular tumors. Predominantly type 2 and 3 regression patterns were reported to evolve over time into a different type appearance [4–6]. In a study by Palamar et. al. [4] type 2 masses remained stable only 41% of the time, compared to 71% of the time for type 3 masses.
1.2 Phase-based OCT angiography (OCTA)
In our concurrent study [8] we demonstrated that the intensity-based structural OCT B-scans provide ophthalmologists with valuable additional information on 3D morphology of RB-affected retina at the resolution on the order of micrometers, and assist in characterizing the types of regression patterns. However, structural OCT alone cannot clearly and objectively confirm the vitality of the suspect masses in RB patients after treatment. To this end we have implemented phase-based OCTA imaging capability in our handheld clinical OCT system, and demonstrate for the first time angiography imaging of blood vasculature inside and around regression patterns in pediatric RB patients after chemotherapy treatments.
Angiographic mapping of blood vasculature is a well-established functional technique in OCT imaging that has been demonstrated in the eye [9–11], brain [12], and skin [13]. Using the Doppler effect of phase changes in the OCT signal caused by moving light-scattering particles [14–17] the discrimination between static tissues and vessels is made for every pixel of an OCT image. In a phase-resolved OCT, the flow is detected from the phase difference between two subsequent A-scans at the same location [13]:
| (1) |
where τ is the time interval between the A-scans (a few milliseconds for the typical values of blood flow velocity), n is the refractive index of the tissue, λ0 is the central wavelength of the OCT light source, and α is the so-called Doppler angle between the directions of the OCT beam and the blood flow (70-90°in retinal blood vessels [18,19]). The sensitivity to slow values of blood flow is fundamentally limited by the noise of the phase difference. The latter is caused by the signal-to-noise ratio of the system and motion artifacts resulting in an imperfect overlap between the compared A-scans [11,20–22].
2. Handheld 1050 nm OCTA clinical system
We demonstrate a novel handheld OCT imaging system with phase-based angiography capabilities specifically developed and validated for retinoblastoma tumor diagnostics in a non-contact mode. A deeper penetration into the choroid layers of the retina is achieved by using a longer central wavelength of 1050 nm [23]. This prototype is designed for infant patients younger than 4 years who must be imaged in supine position under inhalation anesthesia as a standard of clinical care. To the best of our knowledge this is the first demonstration of a handheld angiographic OCT instrument for RB patients in a clinical trial.
To this day, only one commercial Spectral Domain OCT system with a handheld module (Envisu, Leica Microsystems, Morrisville, NC) is used at only a few specialized centers worldwide [24,25]. The light source is centered at 860 nm resulting in a faster attenuation in tissue, and no angiography capabilities exist for this system. A promising ultrahigh speed swept-source OCT system with a handheld module was recently demonstrated by Lu et. al. [26] Their instrument uses MEMS mirror for scanning, operates at 1060 nm center wavelength and delivers 350kHz axial scan rate at 10 µm axial resolution.
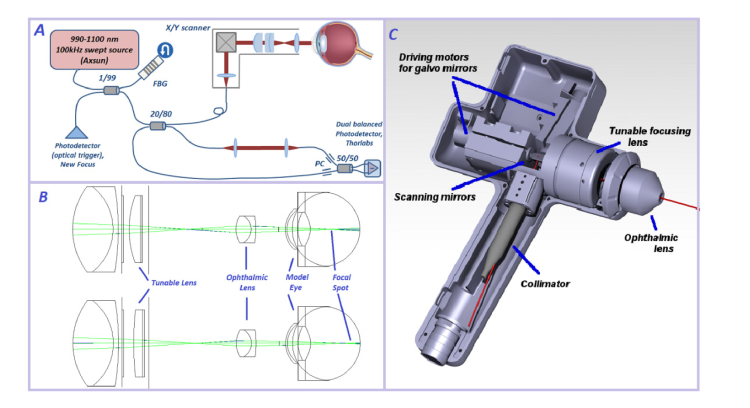
Our imaging system is based on a standard OCT configuration with a 100 kHz swept-source (Axsun) as shown in Fig. 1a. The optical trigger is generated for every laser sweep by a fiber Bragg grating (reflecting at 991nm). The 20/80 fiber coupler splits light between the sample and reference arm, respectively. The handheld module has a pair of galvo mirrors (Cambridge Technology), and a focusing mechanism described below. The signal from patient’s retina interferes with the light passing through the reference arm in the 50/50 coupler and arrives at the balanced photo-receiver (PDC-130, Thorlabs, USA). The measured signal is filtered to reduce high-frequency noise (filter BLP200 + , Mini-Circuits, NY, USA) and digitized by a 12-bit data acquisition board with a 250MHz sampling rate (ATS9351-2G, Alazar Technologies, Canada). The data acquisition is synchronized with the digital waveform generation board (NI PCIe 6363, National Instruments, TX, USA) which drives the galvo mirrors in the hand-held module. The scanning and data acquisition is operated with software custom-written in LabVIEW (National Instruments, TX, USA).
Fig. 1.
Novel handheld OCT imaging system layout. A. OCT setup in a classic configuration with Fiber Bragg Grating (FBG) to generate optical trigger for every laser sweep, Mach-Zender interferometer, handheld module in the sample arm, and a dual-balanced detection. B. Ray-propagating model made with Zemax software illustrates focusing inside the patient’s eye with a tunable lens that changes curvature when an operator rotates the mechanical ring. C. Technical drawing of the handheld scanning module.
We performed a literature search and determined the wide range of optical parameters (curvature of cornea, axial length, power of crystalline lens) that change rapidly during the first few years of life [24,27]. Our optical design incorporates the required tuning of the focal range to be suitable for infant patients. We designed the optical system with Zemax light-propagating software, the optical layout of the optimized configuration is shown Fig. 1b. The collimated excitation beam (3.5mm diameter) is scanned in 2 dimensions by the set of X-Y galvo mirrors and de-magnified to a 2.0 mm diameter by the scan lens unit consisting of an achromatic lens (Thorlabs, USA) and a mechanically tunable lens (Optotune, Switzerland). This engineering solution to the focusing requirements allowed us to completely avoid any longitudinal translation of the ophthalmic lens towards the cornea of the patient. This means that adjustment of the tunable lens to match the patient’s eye properties results in a slightly diverging / converging laser beam (Fig. 1b).
No contact is made with patient’s cornea during imaging (working distance of the ophthalmic lens is 1cm), and artificial tears eye gel is applied during imaging. The power of the collimated laser beam entering the cornea is 1.65mW - well below the safe maximum exposure power of 1.83 mW for continuous swept laser source at 1050nm according to the EU application of risk management to medical devices (ISO 14971:2009) and the EU law on medical devices (council directive 93/42/EEC). The lateral resolution can vary between 10 and 18μm for different patients, depending on the optical parameters of the eye, while axial resolution is below 8μm in tissue. The lateral field of view (up to +/− 14 degrees in the retina), the rate of sampling (number of pixels), and the mode of scanning (repeated B-scan, full x-y scan, angiography x-y scan) can be tuned by the operator, while the custom software written in LabVIEW displays selected cross-sectional images (B-scans) and a coarse en-face image to facilitate navigation during an active scan. The 100 kHz sweep rate of the Axsun laser and data acquisition with the 500MS/s digitizer result in a 6-seconds time for an x-y-z scan of 625x625x704 pixels, including writing the data to a file. In angiography mode every B-scan is repeated resulting in twice the time needed for the same scan. Rapid eye motions do not occur under anesthesia, so no active lateral motion correction solutions were needed for our system.
The full volume is calculated in post-processing as a stack of B-scans. For data sets with repeated B-scans in angiography mode further processing includes bulk and fine motion correction, and layer segmentation before we can distinguish between the pixels corresponding to static tissue or blood flow. In the performance analysis experiment we measured a phase stability of our imaging system at 6 mrad for a stationary fiber – mirror configuration, vs. 330 mrad with the system powered on and a zero voltage sent to the driving motors of the galvo mirrors.
The handheld implementation of the new OCTA system has been designed with consideration of optical performance, user friendliness, ergonomics, and patient safety. Clinically approved and biocompatible POM C thermoplastic material is used for housing of the handheld unit (Fig. 1c). Since the galvo mirrors mount is inevitably the heaviest part of the handheld module, we made an effort to minimize the weight of all other components, including the focusing mechanism. A tuning ring (Fig. 1c) that controls the focusing range is placed between the contact ophthalmic lens and grip handle. A thermal sensor attached to the galvo mirrors mount triggers shutdown of driving currents to the galvos should the temperature reach a threshold level. A 1.5m long flexible cord provides optical and electric connection between the handheld unit and the electronic control box mounted on a mobile cart. Our design incorporates clinically compliant shielding of the internal electric circuit by opto-couplers. The voltage waveforms that drive galvo scanners are generated within the internal electric circuit with digitally encoded commands from the computer board.
3. Results and discussion
3.1 Morphological features are enhanced in en-face intensity projection
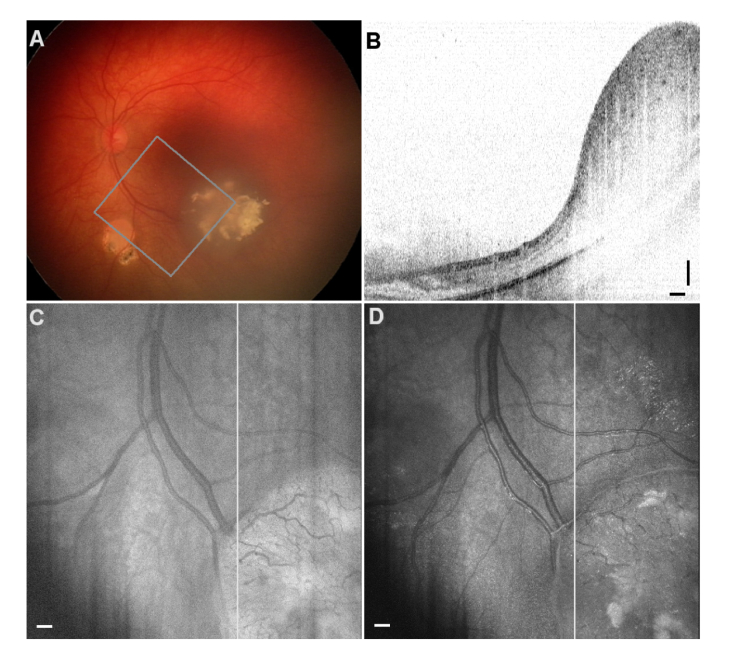
OCT intensity images are presented as B-scans on a logarithmic scale, and in order to create a top-view image an en-face projection is made from the series of B-scans. Normally, the logarithmic values are summed up along the A-lines (axial direction) to provide the intensityprocedure, where the linear values are added first, and the resulting en-face projection is then displayed on a logarithmic scale. Both calculations are easy to implement in standard OCT data processing without any additional processing time. For some RB-related masses these two approaches visually enhance different features while providing a top view familiar for clinicians using standard funduscopy. We demonstrate this finding in the case of regression pattern type 3 after four chemotherapy treatments with carboplatin (Fig. 2). The fundus photo (panel A) shows the regression pattern mass and the partially overlapping region of interest imaged with OCT. Because the axial dimension of the abnormal mass occupies the whole field of view a typical B-scan through this regression pattern (panel B) suffers from wrapping of the OCT data, as evident on the left side of the scan in the healthy part of the retina. The en-face projections created with the two methods are shown with white lines indicating the displayed B-scan. After summation the projection values for both images were grayscale coded between 0 and 255 corresponding to their respective minima and maxima values. The standard summation of logarithmic OCT values (panel C) already improves the level of detail compared with that of the fundus image, specifically in smaller blood vessels are visible in the abnormal mass, suggesting that it is not benign. The alternative summation of linear OCT values enhances the contrast of calcifications making them stand out for a clinical assessment. While all this information is already contained in the individual B-scans we stress the importance of presenting both projections and the fundus photo to the clinician who has to make therapeutic decisions right after imaging the RB patient. In this patient case the follow-up examinations revealed RB recurrences and further treatments were necessary.
Fig. 2.
RB patient with Regression Pattern type 3 after four chemotherapy treatments. A. Fundus photo of the affected retina showing the region of interest imaged with OCT. B. A sample B-scan through the regression pattern. C. En-face projection created with the standard approach: summation of logarithmic data for every A-line enhances the contrast in small blood vessels. D. En-face projection from the proposed summation of OCT intensity values on a linear scale, then displayed in logarithmic scale. Calcifications are clearly visible here. The straight white lines correspond to the location of the B-Scan in panel B. Scale bars: 0.25 mm.
3.2. Angiography data processing
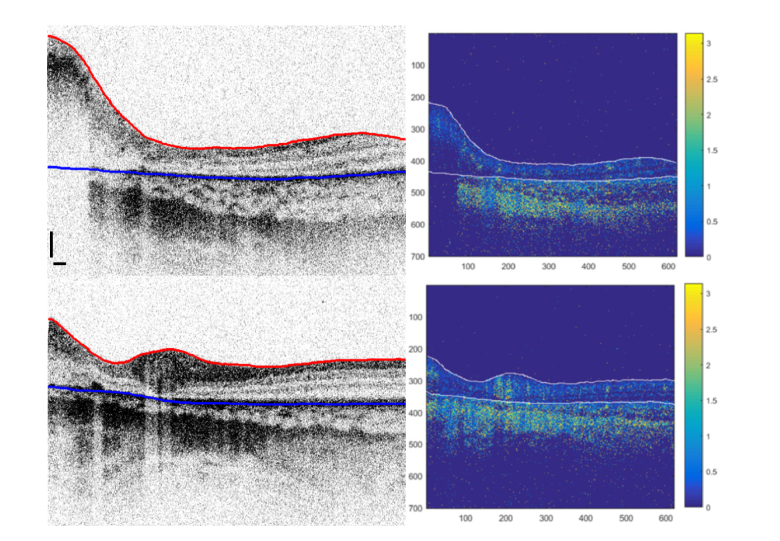
We consider another regression type 3 case after 6 cycles of combined chemotherapy with vincristine, etoposide, and carboplatin (VEC) in Fig. 3 to describe the details of creating an angiography map. The healthy part of the retina and the RB tumor mass are clearly visible in the intensity OCT B-scans (Fig. 3, left). First the upper surface (i.e., the nerve fiber layer for the healthy part of the retina, or in case of RB - top edge of a tumor / scar / retinoma, respectively) is identified in the B-scan (Fig. 3, left panel, red line). The upper surface of the retina was segmented using a shortest path search algorithm [28]. We calculated the vertical gradient, gz, of each intensity image in the vertical direction (along the A-lines). Then, a function f = 1 -gz /max(gz) was used to find the minimum cost path among its eight neighboring pixels in the direction from left to right. Our algorithm was initialized automatically by adding two extra nodes with zero cost before the first and after the last A-line of every B-scan.
Fig. 3.
Left: Two example B-scans of an RB-affected retina with regression pattern type 3 showing segmented upper surface (red line) and RPE layer (blue line). Scale bars: 0.25 mm. Right: Corresponding maps of phase differences in radians for every pixel in the OCT image. Note the regions with high phase differences corresponding to strong blow flow. The choroid region below RPE exhibits non-static pixels throughout the volume.
Then sub-pixel motion correction [17,29] was applied to the repeated B-scan using a cross-correlation followed by histogram normalization, where distribution of phase differences for every A-line was centered at 0 rad [10]. To create an en-face projection angiogram the pixels from the choroid must be excluded, otherwise the stronger choroidal blood flow would dominate the flow data in the retina in the angiography projection image. This requires a reliable segmentation of the retinal pigment epithelium (RPE) layer (Fig. 3, left panel, blue line). We have attempted segmentation of OCT intensity B-scans using two-dimensional and three-dimensional approaches. These algorithms included active contours [30], level sets on attenuation coefficient images [31], graph cuts [32], as well as dynamic algorithms using an hierarchical approach [33]. Since RB damage to the retina is manifested in a variety of distorted tissue – active tumors, regression patterns of 4 different types, retinoma masses, and scars, while the variability and image quality varies between the patients, we have not found a single algorithm that can segment the RPE layer in all B-scans reliably. Thus, for many of the B-scans with retinal structure distorted by RB we performed a manual segmentation using the ITK-SNAP software package and a touch-screen computer. After motion correction is applied [17] the phase difference is calculated for every pixel, followed by thresholding at the level of 0.33 radians. Finally, the image is multiplied by an intensity-based binary mask in order to exclude pixels with a low SNR. The resulting map of the pixels where the zones with blood flow are clearly identifiable by a higher phase difference is shown for the two B-scans (Fig. 3, right panel).
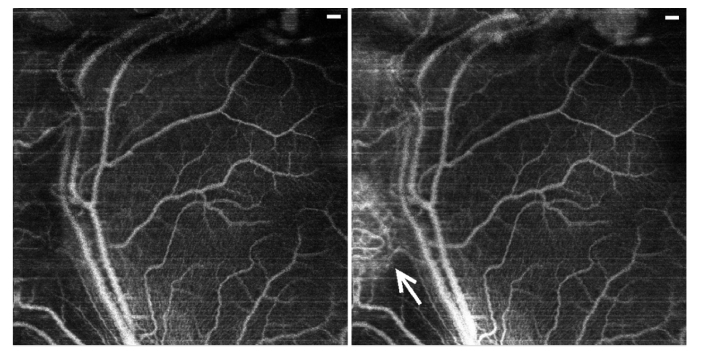
The phase difference values for the pixels from the volume between the upper surface and the RPE are summed up in the axial direction to create an en-face projection of blood vessels. Here, we observed a striking difference between the healthy and RB-affected retinal vasculature (Fig. 4). The angiography projection in the left panel was calculated from the full volume between the upper surface and the RPE, while the projection in the right panel corresponds to the top 90 µm starting at the top surface. Note that the central and right regions of both images exhibit the same healthy network of blood vessels without any additional contributions from deeper layers. In contrast, in the region of the regression pattern (arrow, left) the angiography projection reveals a dense system of blood vessels with abnormal branching patterns. Most of these vessels are located throughout the mass of the regression pattern and vanish for the projection within the 90 µm from the top surface, in contrast to a healthy retina.
Fig. 4.
Angiography image of an RB patient with regression pattern type 3, B-scans and segmentation discussed in Fig. 3. Left panel: Angiographic projection over the volume between upper surface and the depth of 90 µm below. Right panel: Angiographic projection from the full volume between the upper surface and the RPE. The white arrow points to an abnormally dense network of blood vessels within the regression pattern. Notice that most of the abnormal blood vessels are not present within the upper layer of the regression pattern. Scale bars: 0.25 mm.
3.3. Abnormal blood vasculature observed in post-treatment regression patterns
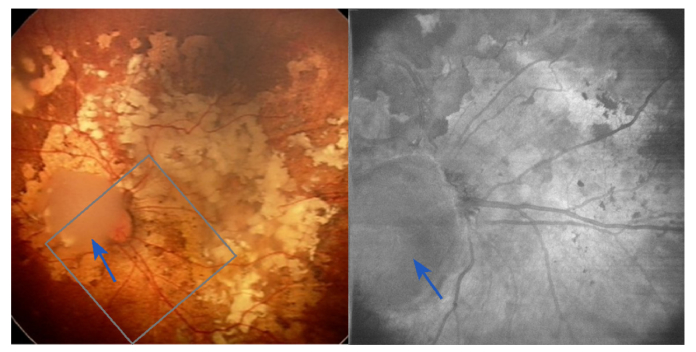
We expected to find abnormal and dense vasculature as a characteristic feature of an active tumor, but angiography map demonstrated abnormal blood vessels network in the regression pattern type 3. To further illustrate this finding in RB-affected retinas provided by Doppler OCT we discuss the case of another RB patient after 5 cycles of selective intra-arterial chemotherapy. Here the field of view includes regression patterns of type 2 (blue arrows) and type 3. The wide-field fundus photo from a RetCam commercial system (routinely used as a standard of care) is shown in Fig. 5.
Fig. 5.
Regression patterns of type 2 on top of the optic nerve (blue arrows), and 3 elsewhere in the image in the first follow-up after systemic chemotherapy. Left panel: Fundus photo with the region of interest probed with Doppler OCT. Right panel: en-face projection from the intensity OCT.
The main blood vessels are visible although partially blocked by the abnormal structures. A distinctly opaque mass partially overlapping the optic nerve (regression pattern type 2, completely non-calcified) is different from the type 3 (partially calcified) patterns throughout the rest of the retina. The en-face OCT intensity projection for the region of interest already improves the visibility of the blood vessels, and highlights the opaque type 2 mass grown on top of the optic nerve.
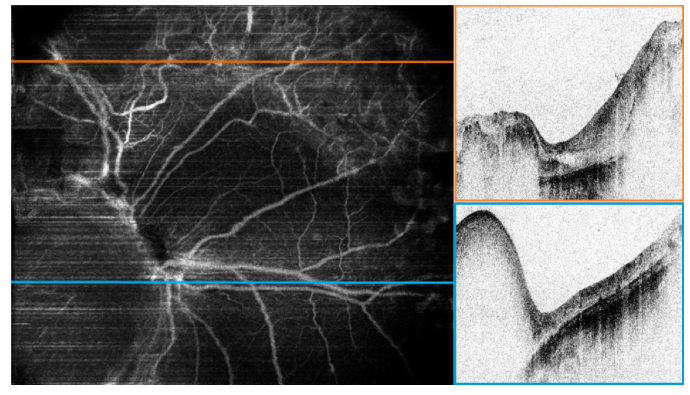
The angiography map reveals more morphological details and clearly separates the three distinctly different regions (Fig. 6, left). The region without any tumor mass (regression pattern type 0, no remnant) having the expected normally looking blood vessel structure lies in the lower part of the image to the right from the optic nerve (B-scan along the blue line is shown on the left). The intensity B-scan in the upper part (Fig. 6, top right) along the orange line (Fig. 6, left) shows retinal tissue completely replaced with the regression pattern type 3 where OCT signal fully attenuates in the thicker parts and reaches the atrophic choroid in the center. The angiography image (Fig. 6, left) identifies a complex, dense and abnormal vasculature throughout the whole regression pattern in the upper region. As opposed to the healthy retinal vasculature this network lacks normal branching directionality, appears more tortuous with some vessel connections looking disrupted. In contrast, the type 2 mass on top of the optic nerve has stronger attenuation properties, with almost no flow except 2 remaining short vessels detected in the portion of its volume accessible with OCT. A 3D rotating angiography map of this case is shown in supplementary material (Visualization 1 (6.3MB, avi) ). Later follow-up examinations without the angiographic imaging confirmed a stable regression pattern with no tumor recurrence in the central region.
Fig. 6.
Angiography map reveals three different regions based on blood vessels network (left panel) Right panels: Intensity B-scans along the orange (type 3) and blue (type 2) lines drawn on the angiography map. (Visualization 1 (6.3MB, avi) ).
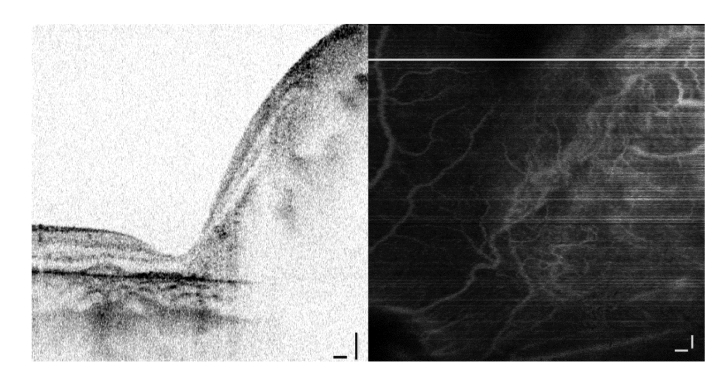
Another case with a regression pattern type 3 from the first follow-up visit after chemotherapy treatment (4 cycles of systemic chemotherapy and 1 cycle of selective intra-arterial chemotherapy) has an overgrown mass with a sharp transition into healthy retina on the left (Fig. 7). Again, angiography reveals a prominent blood vessel network in the absence of an athropic or necrotic mass. The network is tortuous (no clear branching directionality) with mostly short vessels.
Fig. 7.
Abnormal vasculature network in a big mass of regression pattern type 3 at the first follow-up visit after 5 chemotherapy cycles. B-scan (top panel) is shown along the white line. Scale bars: 0.25 mm.
Regression pattern type 4 is one of the most common outcomes of the RB treatments as well as evolution of type 2 and 3 patterns. It is distinctive in appearance as flattened regions where the retinal layers are fully destroyed and replaced with atrophic scar (Fig. 8). This patient received a total of 11 cycles of chemotherapy (for tumors in both eyes) and a laser treatment prior to the angiographic imaging. The B-scan with a flat atrophic scar (Fig. 8, top panel) is taken along the line in the angiography map. Only two blood vessels run across this athrophic region in the vicinity of choroid without any local vasculature, in contrast with the healthy retina elsewhere in the image. Intuitively, no blood flow is expected in the atrophic region, due to the absense of vital tissue. We have confirmed the absence of local blood vessels in the flat regression type 4 with angiographic imaging in 2 RB patients.
Fig. 8.
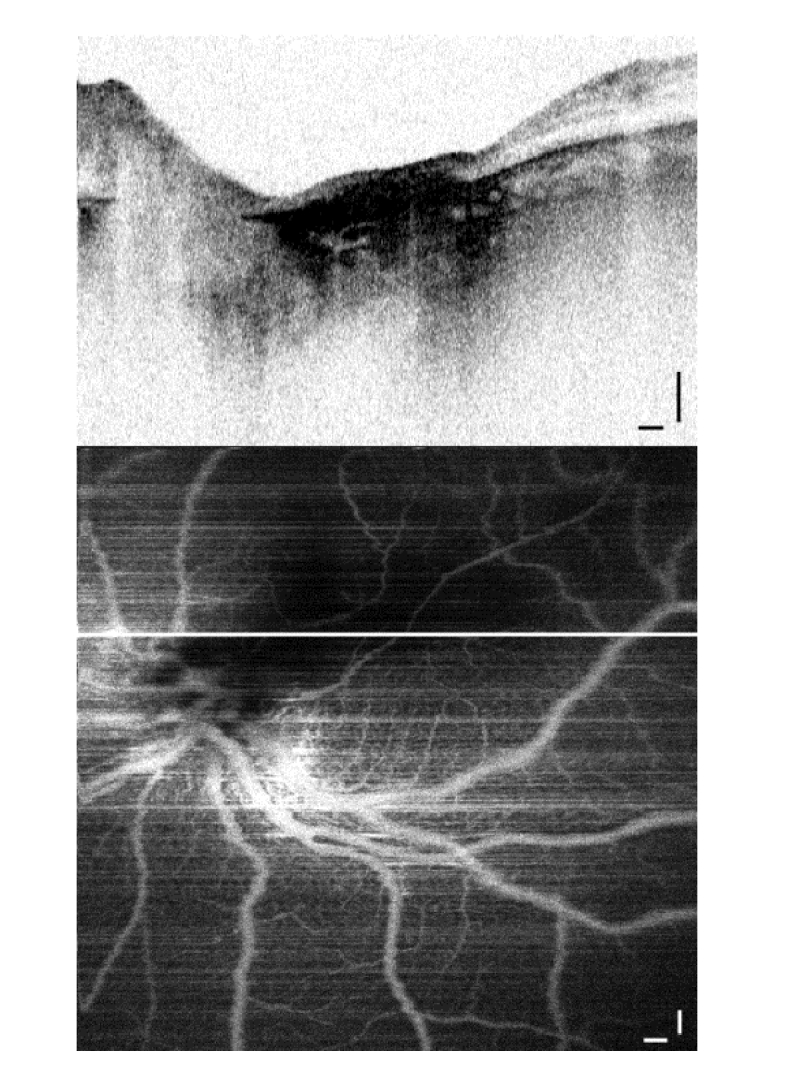
Flat scar regression pattern type 4 after 11 cycles of chemotherapy and a laser treatment: B-scan (top); Angiography (below) shows only two major blood vessels crossing the area of athrophic tissue. Scale bars: 0.25 mm.
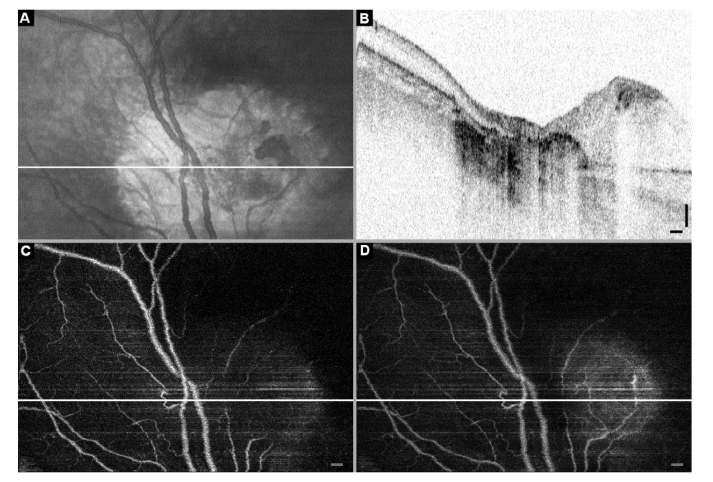
The final case we discuss shows a combination of regression pattern types 2 and 4, where the patient was treated with 11 sessions of chemotherapy (4x carboplatin and 7x VEC) combined with laser and cryotherapy. The en-face projection (Fig. 9a) has an abnormal damaged region which B-scan (Fig. 9b) reveals to consist of the regression patterns: flat scar (type 4) in the center and a superficial mass to the right (type 2). The angiography images in Fig. 9c and 9d are taken from the 60 µm deep layer starting from the top surface and from the full volume between the top surface and the RPE, respectively. There are very few isolated blood vessels evident in the depth of the type 2 pattern, while only the major throughput vessels cross the flat scar region. Both are different from the unaffected retina on the left side of all the images. One might expect abnormal vasculature as a marker for vital tumor tissue. However, within this evaluation of regression patterns we discovered prominent and tortuous vasculature in the regression pattern type 3.
Fig. 9.
Follow-up OCT images: RB patient after 11x chemotherapy (4x carbopatin, 7x VEC), laser and cryotherapy. A. En-face projection with the location of a sample B-scan indicated by a white line. B. Structural OCT B-scan along the white line in panels A, C, and D shows a flat scar in the center (regression pattern type 4) and abnormal mass on the right (regression pattern type 2). C and D. Angiography OCT projections from the layer 60 µm deep starting from the top surface, and from the full depth between the top surface and RPE, respectively. Notice only the major throughput blood vessels are present in the flat scar (type 4) region, and very few remaining blood vessels in the regression pattern type 2 on the right. Scale bars: 0.25 mm.
These new findings could explain the observations by Palamar et. al. [4] and Ghassemi et al. [5] on the evolution of regression patterns after chemoreduction. Since type 2 scars lack active vasculature, only 41% of type 2 scars remained stable over time, with 59% of them evolving into types 0, 1, and 4 [4]. On the contrary, 71% of type 3 masses remain a stable type 3, as we would expect considering the presence of dense vasculature, hence the living tissue. The presence of vasculature might be the reason for regression type 3 having the highest risk of malignancy recurrence, followed by type 1 (completely calcified, not imaged within this study), and type 0 (no remnant, normal looking vasculature). Shields et. al. [3] have studied 557 RB tumors and found recurrence in 20% of type 0; 21% of type 1; 14% of type 2; 24% of type 3; and 9% of type 4.
To this day the sudies of retinoblastoma regression patterns looked at statistics over several months of follow-up evaluations to estimate probabilities of their formation and development, as well as tumor recurrences without offering the explanation for underlying mechanisms. Now the new ability to analyse the changes in 3-D morphology of vasculature within the regression patterns at every follow-up session might advance understanding and of retinoblastoma development and response to therapy.
Although a statistically significant patient study with a follow-up monitoring is needed for the confirmation, at this time we hypothesize that the presence of a dense abnormal vasculature with flow could be a marker for post-malignant activity in some retinal regression patterns, resulting in stronger resistance to evolution into atrophic scars as well as higher risk of recurrency. The inactive regression patterns seem to lack dense vasculature throughout their volume. Depending on the results of a future clinical study with a bigger sample size, diagnostic classification of type 1, 2, and 3 regression patterns might be facilitated by angiography mapping, since currently those three regression types are defined based on qualitative assessment of calcification. Moreover, risk assessment and therapy might be more individualized even for the patients with the same regression patterns but varying complexity of vasculature.
4. Conclusions
In this observational clinical study we performed angiographic OCT imaging on 8 infant RB patients at their first follow-up visits after chemotherapy. We acquired angiography maps of RB-affected retinas having regression patterns of type 2, 3, and 4. Angiography revealed presence of abnormally dense and tortuous vasculature in 5 regression patterns type 3, no vasculature or only a few remaining short vessels in 2 regression patterns type 2, and large vessels without local microvasculature crossing the areas of 3 flat scars (type 4). The ability to support the differential diagnosis between regression patterns type 2 and 3 by angiographic visualization is a significant improvement to the real-time diagnostic capabilities compared with those from the 2D fundus photo, and even the 3D intensity OCT.
While fluorescence-based angiography mapping can be done in 2-D, we have demonstrated the first real-time handheld OCT system with 3-D angiography imaging for RB patients at infancy and up to 4 years of age who undergo evaluation sessions under anesthesia. We stress that structural OCT provides a valuable and detailed 3-D visualization of morphology of the retinal masses caused by RB, it is difficult to define a reliable metric for discrimination between vital and benign mass based on intensity images alone. The angiography view of RB-related structures reveals a striking difference in the presence and complexity of vasculature network architecture between regression patterns of type 2, 3, and 4. Angiographic OCT enables studying the genesis of regression patterns, response to therapy, and further developing real-time diagnostics for retinoblastoma.
Funding
Foundation KiKa (Kinderen Kankervrij, English: Children Cancerfree), the Netherlands.
Disclosures
JFB (P): JFB: Heidelberg Engineering Gmbh (F) ON: Heidelberg Engineering Gmbh (F) MGO: Heidelberg Engineering Gmbh (F)
References
- 1.Moll A. C., Kuik D. J., Bouter L. M., Den Otter W., Bezemer P. D., Koten J. W., Imhof S. M., Kuyt B. P., Tan K. E., “Incidence and survival of retinoblastoma in The Netherlands: a register based study 1862-1995,” Br. J. Ophthalmol. 81(7), 559–562 (1997). 10.1136/bjo.81.7.559 [DOI] [PMC free article] [PubMed] [Google Scholar]
- 2.Shields C. L., Manalac J., Das C., Saktanasate J., Shields J. A., “Review of spectral domain-enhanced depth imaging optical coherence tomography of tumors of the retina and retinal pigment epithelium in children and adults,” Indian J. Ophthalmol. 63(2), 128–132 (2015). 10.4103/0301-4738.154384 [DOI] [PMC free article] [PubMed] [Google Scholar]
- 3.Shields C. L., Palamar M., Sharma P., Ramasubramanian A., Leahey A., Meadows A. T., Shields J. A., “Retinoblastoma regression patterns following chemoreduction and adjuvant therapy in 557 tumors,” Arch. Ophthalmol. 127(3), 282–290 (2009). 10.1001/archophthalmol.2008.626 [DOI] [PubMed] [Google Scholar]
- 4.Palamar M., Thangappan A., Shields C. L., “Evolution in regression patterns following chemoreduction for retinoblastoma,” Arch. Ophthalmol. 129(6), 727–730 (2011). 10.1001/archophthalmol.2011.137 [DOI] [PubMed] [Google Scholar]
- 5.Ghassemi F., Rahmanikhah E., Roohipoor R., Karkhaneh R., Faegh A., “Regression patterns in treated retinoblastoma with chemotherapy plus focal adjuvant therapy,” Pediatr. Blood Cancer 60(4), 599–604 (2013). 10.1002/pbc.24333 [DOI] [PubMed] [Google Scholar]
- 6.Chawla B., Jain A., Seth R., Azad R., Mohan V. K., Pushker N., Ghose S., “Clinical outcome and regression patterns of retinoblastoma treated with systemic chemoreduction and focal therapy: A prospective study,” Indian J. Ophthalmol. 64(7), 524–529 (2016). 10.4103/0301-4738.190143 [DOI] [PMC free article] [PubMed] [Google Scholar]
- 7.Xue K., Qian J., Yue H., Yuan Y. F., Zhang R., “[Retinoblastoma regression patterns and results following chemo reduction and adjuvant therapy],” Zhonghua Yan Ke Za Zhi 48(7), 625–630 (2012). [PubMed] [Google Scholar]
- 8.Nadiarnykh O., McNeill N., Verbraak F. D., Moll A. C., De Boer J. F., “Diagnostic imaging of retinoblastoma in pediatric patients with a novel 1050nm optical coherence tomography clinical system,” Invest. Ophth. Vis. Sci. 58(8) (2017). [Google Scholar]
- 9.Yazdanfar S., Rollins A. M., Izatt J. A., “Imaging and velocimetry of the human retinal circulation with color Doppler optical coherence tomography,” Opt. Lett. 25(19), 1448–1450 (2000). 10.1364/OL.25.001448 [DOI] [PubMed] [Google Scholar]
- 10.Makita S., Hong Y., Yamanari M., Yatagai T., Yasuno Y., “Optical coherence angiography,” Opt. Express 14(17), 7821–7840 (2006). 10.1364/OE.14.007821 [DOI] [PubMed] [Google Scholar]
- 11.Braaf B., Vienola K. V., Sheehy C. K., Yang Q., Vermeer K. A., Tiruveedhula P., Arathorn D. W., Roorda A., de Boer J. F., “Real-time eye motion correction in phase-resolved OCT angiography with tracking SLO,” Biomed. Opt. Express 4(1), 51–65 (2013). 10.1364/BOE.4.000051 [DOI] [PMC free article] [PubMed] [Google Scholar]
- 12.Wang R. K. K., Hurst S., “Mapping of cerebro-vascular blood perfusion in mice with skin and skull intact by Optical Micro-AngioGraphy at 1.3 mum wavelength,” Opt. Express 15(18), 11402–11412 (2007). 10.1364/OE.15.011402 [DOI] [PubMed] [Google Scholar]
- 13.Zhao Y., Chen Z., Saxer C., Xiang S., de Boer J. F., Nelson J. S., “Phase-resolved optical coherence tomography and optical Doppler tomography for imaging blood flow in human skin with fast scanning speed and high velocity sensitivity,” Opt. Lett. 25(2), 114–116 (2000). 10.1364/OL.25.000114 [DOI] [PubMed] [Google Scholar]
- 14.Zhang J., Chen Z., “In vivo blood flow imaging by a swept laser source based Fourier domain optical Doppler tomography,” Opt. Express 13(19), 7449–7457 (2005). 10.1364/OPEX.13.007449 [DOI] [PubMed] [Google Scholar]
- 15.Vakoc B., Yun S., de Boer J., Tearney G., Bouma B., “Phase-resolved optical frequency domain imaging,” Opt. Express 13(14), 5483–5493 (2005). 10.1364/OPEX.13.005483 [DOI] [PMC free article] [PubMed] [Google Scholar]
- 16.Adler D. C., Huber R., Fujimoto J. G., “Phase-sensitive optical coherence tomography at up to 370,000 lines per second using buffered Fourier domain mode-locked lasers,” Opt. Lett. 32(6), 626–628 (2007). 10.1364/OL.32.000626 [DOI] [PubMed] [Google Scholar]
- 17.Braaf B., Vermeer K. A., Vienola K. V., de Boer J. F., “Angiography of the retina and the choroid with phase-resolved OCT using interval-optimized backstitched B-scans,” Opt. Express 20(18), 20516–20534 (2012). 10.1364/OE.20.020516 [DOI] [PubMed] [Google Scholar]
- 18.Wang Y., Bower B. A., Izatt J. A., Tan O., Huang D., “Retinal blood flow measurement by circumpapillary Fourier domain Doppler optical coherence tomography,” J. Biomed. Opt. 13(6), 064003 (2008). 10.1117/1.2998480 [DOI] [PMC free article] [PubMed] [Google Scholar]
- 19.Singh A. S. G., Kolbitsch C., Schmoll T., Leitgeb R. A., “Stable absolute flow estimation with Doppler OCT based on virtual circumpapillary scans,” Biomed. Opt. Express 1(4), 1047–1058 (2010). 10.1364/BOE.1.001047 [DOI] [PMC free article] [PubMed] [Google Scholar]
- 20.Leitgeb R., Schmetterer L., Drexler W., Fercher A., Zawadzki R., Bajraszewski T., “Real-time assessment of retinal blood flow with ultrafast acquisition by color Doppler Fourier domain optical coherence tomography,” Opt. Express 11(23), 3116–3121 (2003). 10.1364/OE.11.003116 [DOI] [PubMed] [Google Scholar]
- 21.Yang V. X. D., Gordon M. L., Mok A., Zhao Y. H., Chen Z. P., Cobbold R. S. C., Wilson B. C., Vitkin I. A., “Improved phase-resolved optical Doppler tomography using the Kasai velocity estimator and histogram segmentation,” Opt. Commun. 208(4–6), 209–214 (2002). 10.1016/S0030-4018(02)01501-8 [DOI] [Google Scholar]
- 22.Park B., Pierce M. C., Cense B., Yun S. H., Mujat M., Tearney G., Bouma B., de Boer J., “Real-time fiber-based multi-functional spectral-domain optical coherence tomography at 1.3 microm,” Opt. Express 13(11), 3931–3944 (2005). 10.1364/OPEX.13.003931 [DOI] [PubMed] [Google Scholar]
- 23.Lee E. C., de Boer J. F., Mujat M., Lim H., Yun S. H., “In vivo optical frequency domain imaging of human retina and choroid,” Opt. Express 14(10), 4403–4411 (2006). 10.1364/OE.14.004403 [DOI] [PubMed] [Google Scholar]
- 24.Maldonado R. S., Izatt J. A., Sarin N., Wallace D. K., Freedman S., Cotten C. M., Toth C. A., “Optimizing hand-held spectral domain optical coherence tomography imaging for neonates, infants, and children,” Invest. Ophthalmol. Vis. Sci. 51(5), 2678–2685 (2010). 10.1167/iovs.09-4403 [DOI] [PMC free article] [PubMed] [Google Scholar]
- 25.Soliman S. E., VandenHoven C., MacKeen L. D., Héon E., Gallie B. L., “Optical Coherence Tomography-Guided Decisions in Retinoblastoma Management,” Ophthalmology 124(6), 859–872 (2017). 10.1016/j.ophtha.2017.01.052 [DOI] [PubMed] [Google Scholar]
- 26.Lu C. D., Kraus M. F., Potsaid B., Liu J. J., Choi W., Jayaraman V., Cable A. E., Hornegger J., Duker J. S., Fujimoto J. G., “Handheld ultrahigh speed swept source optical coherence tomography instrument using a MEMS scanning mirror,” Biomed. Opt. Express 5(1), 293–311 (2013). 10.1364/BOE.5.000293 [DOI] [PMC free article] [PubMed] [Google Scholar]
- 27.Ishii K., Yamanari M., Iwata H., Yasuno Y., Oshika T., “Relationship between changes in crystalline lens shape and axial elongation in young children,” Invest. Ophthalmol. Vis. Sci. 54(1), 771–777 (2013). 10.1167/iovs.12-10105 [DOI] [PubMed] [Google Scholar]
- 28.Dijkstra E. W., “A note on two problems in connexion with graphs,” Numer. Math. 1(1), 269–271 (1959). 10.1007/BF01386390 [DOI] [Google Scholar]
- 29.Chen C., Shi W., Gao W., “Imaginary part-based correlation mapping optical coherence tomography for imaging of blood vessels in vivo,” J. Biomed. Opt. 20(11), 116009 (2015). 10.1117/1.JBO.20.11.116009 [DOI] [PubMed] [Google Scholar]
- 30.Mujat M., Chan R., Cense B., Park B., Joo C., Akkin T., Chen T., de Boer J., “Retinal nerve fiber layer thickness map determined from optical coherence tomography images,” Opt. Express 13(23), 9480–9491 (2005). 10.1364/OPEX.13.009480 [DOI] [PubMed] [Google Scholar]
- 31.Novosel J., Thepass G., Lemij H. G., de Boer J. F., Vermeer K. A., van Vliet L. J., “Loosely coupled level sets for simultaneous 3D retinal layer segmentation in optical coherence tomography,” Med. Image Anal. 26(1), 146–158 (2015). 10.1016/j.media.2015.08.008 [DOI] [PubMed] [Google Scholar]
- 32.Dufour P. A., Ceklic L., Abdillahi H., Schröder S., De Dzanet S., Wolf-Schnurrbusch U., Kowal J., “Graph-based multi-surface segmentation of OCT data using trained hard and soft constraints,” IEEE Trans. Med. Imaging 32(3), 531–543 (2013). 10.1109/TMI.2012.2225152 [DOI] [PubMed] [Google Scholar]
- 33.Chiu S. J., Li X. T., Nicholas P., Toth C. A., Izatt J. A., Farsiu S., “Automatic segmentation of seven retinal layers in SDOCT images congruent with expert manual segmentation,” Opt. Express 18(18), 19413–19428 (2010). 10.1364/OE.18.019413 [DOI] [PMC free article] [PubMed] [Google Scholar]


