Abstract
We report a novel design and operation of a highly integrated miniature handheld OCT probe, with high-speed angiography function that can be used in clinical settings for young children and infants, providing rapid, non-invasive structural and angiographic imaging of the retina and choroid. The imaging system is operated at 200 kHz, with 3D OCT and OCTA scan time of 0.8 and 3.2 seconds, respectively, and the scanning angle on the pupil is ± 36°, covering the full perifoveal region. Operator assisting features of the direct-view iris camera and on-probe display are integrated into the hand-held probe, and the fixation target can display animations to attract the attention of young subjects. Compared to conventional OCT systems, the high-speed hand-held OCT system significantly improves the operator’s experience and scanning efficiency, which is important for imaging infants. Imaging results indicate a significant reduction in total time consumption in pediatric ophthalmic imaging sessions, as well as the image quality of OCT angiography.
1. Introduction
Childhood blindness refers to a group of diseases and conditions, which, if not treated in time, can lead to permanent vision loss that can severely impact the quality of life of patients and their family. It has been reported that retinopathy of prematurity (ROP), a vision-threatening disease associated with abnormal retinal vascular development, is a prevalent disease in premature infants and a leading cause for blindness in children in the developed as well as developing countries [1–4]. It is estimated that over 50,000 children are blind from ROP worldwide [5]. The basic reason for high incidence of ROP nowadays is that the number of infants being born premature (less than 1500g) has increased tremendously [6]. Most ROP regress spontaneously without treatment by the process of involution or evolution from a vasoproliferative phase to a fibrotic phase [7]; however, more severe cases need therapeutic treatment to prevent blindness. This calls for an effective neonatal screening and follow-up exams to assist early diagnosis and decision making. Binocular Indirect Ophthalmoscope (BIO) is recognized as the gold standard for screening and diagnosis of ROP [3]. The advantage of BIO is its capability of complete documentation of ROP. However, there are also a number of disadvantages in BIO, including: 1) Time-consuming; 2) Painful and uncomfortable for the infants due to the use of speculum and indenter; and 3) Poor inter-observer agreement.
There have been tremendous efforts in developing and clinically testing ophthalmic imaging instruments for ROP screening. With the advent of hand-held digital fundus imaging device, e.g. RetCam (Massie Laboratories, Inc., Pleasanton, CA, USA), the screening of ROP using this digital imaging device has proved a potential alternative to BIO. A contact lens is however required to place on the cornea during the retinal screening [3]. Compared to the BIO, the digital fundus camera is easier to use, and can provide high-resolution fundus image with excellent reproducibility. While in neonatal situation, the image quality sometimes is poor and limits the diagnosis of ROP [8]. The possible reason for this limitation may attribute to: 1) the difficulty in imaging the small eyes of infants with small palpebral fissures, which prevent good corneal contact with the lens nosepiece; 2) insufficient sensitivity; and 3) poor mydriasis [9,10]. Other limitations for neonatal ROP screening using the digital fundus camera includes painful and uncomfortable screening procedure, and sometimes retinal hemorrhages after screening [11].
For the purpose of diagnosing aggressive ROP accurately, Fluorescein Angiography (FA) is often used as a diagnostic tool in infants for ROP in risk. Many investigations have demonstrated that some vascular abnormalities observed by means of FA cannot be seen by using an indirect ophthalmoscopy [12,13]. FA provides a more accurate and objective assessment of the stage and zone of the diseases to be carried out. However, the limitation of FA is the requirement of dye injection, which raises severe medical safety concerns especially for premature infants, plus significant time costs added to the procedure.
Optical coherence tomography (OCT) is a well-established noncontact and noninvasive imaging technique for detailed assessment of microanatomy and pathology of the retina, and has become a routine diagnostic imaging tool used worldwide in modern ophthalmology [14,15]. Optical coherence tomography angiography (OCTA) has the capability of detecting intrinsic motion within different layers of the retina to depict blood flow [16–19]. Therefore, it can provide similar blood vessel network information to that FA does, but without fluorescein dye injection. We believe that this ability of OCTA can provide new insights into the diagnosis of ROP and has the potential to become a new diagnostic tool for ROP. While most commercial OCT systems were designed as tabletop units for adults and patients who are cooperative and are able to maintain a stable position in a chin rest during the test, they are not amendable to imaging infants [20]. Currently, there are two commercially available portable OCT systems for neonatal ROP screening: Leica Envisu C-class (Leica Microsystems Inc., IL, USA) and Optovue iStand (Optovue Inc., Fremont, CA, USA). Envisu is a portable spectral domain (SD)-OCT system with hand-held probe. The OCT engine (32 kHz A-line rate) of this system is mounted into a medical cart, making it possible to adapt different scenarios in a medical center. The hand-held probe of the system features lightweight design with refraction correction from + 10 to −12 D. Optovue iStand is also a SD-OCT based potable retinal imaging system (26 kHz A-line rate) with a scanner head mounted on an armature for imaging patients in supine position. Besides, Optovue has a fundus camera that can guide OCT to the region of interest for imaging [20]. A number of research groups across several countries have reported their neonatal retinal imaging results using these systems [21–27]. However, the relatively low A-line rate of both systems limit their ability to perform OCTA scans in hand-held configuration. Thus, these available commercial systems have limitation in accurate diagnosis ROP at early stage both in terms of system operability and image quality.
There are a few research groups who have attempted the development of high-performance hand-held OCT/OCTA probe using high-speed (over 100kHz) swept-source laser for ROP screening. Yang and Campbell et al. reported their light weight, 100 kHz A-line-rate handheld probe for OCTA applications and demonstrated high-quality OCTA images in awake adults and anesthetized infants [21,28]. Christian et al. reported their 200 kHz A-line-rate handheld OCTA probe designed on an innovative ‘5F’ (focus) optical system, demonstrating OCTA image of foveal area and optical nerve head [29]. Despite of the impressive wide-field structural imaging results, no reports of OCTA at larger than 20° scan angle were seen in these studies, most likely due to high demands of imaging efficiency of OCTA on neonates. With the latest developments of MEMS scanner, more features were introduced to miniature hand-held OCT probe, such as direct-view iris camera and on-probe display, was demonstrated by MIT group [30]. However, neither angiography imaging or pediatric retinal imaging results were reported on this imaging probe.
In this study, we introduce a novel design and operation of a highly integrated miniature handheld OCT probe, with high-speed, wide-field angiography function that can be used in clinical settings for young children and infants. To overcome the limitations of current neonatal ROP screening modalities, we developed a portable OCT system based on 200 kHz swept-source laser. We have re-designed the features to support infant imaging include a direct-view iris camera, on-probe display for operator when performing imaging, and introduced on-probe controls of motorized optomechanical components for improving imaging efficiency, as well as optimized usability in clinical environments. We report high resolution retinal structural image and angiogram acquired from adults and awake neonate. Here, the main objective of this study is to describe the features of this newly developed probe and test its feasibility of providing retinal structural images and angiograms in both adult and pre-mature infants.
2. Methods
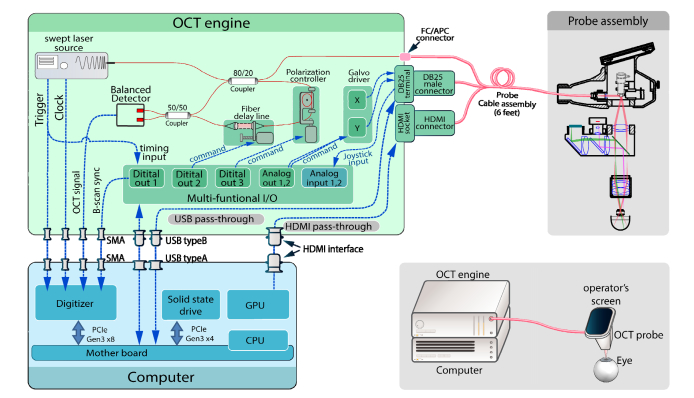
The hand-held ophthalmic OCT (HHO-OCT) system incorporates a high-throughput OCT engine, a highly-integrated custom designed probe, multiple stages of data processing and data visualizations to deliver OCT and OCTA images. A schematic drawing of the OCT system is displayed in Fig. 1, showing the architecture of the overall imaging system design. As an overview, the hand-held ophthalmic OCT system consists of three major components: OCT imaging engine, hand-held probe, and a computing unit. All three components are self-enclosed, with detachable connectors. Both the imaging engine and computer module are assembled within a standard, portable 19-inch rack enclosure. With each module taking rack space of 4U height, the final prototype system measures a minimal 19 × 21.5 × 14-inch space, which can be easily transported to clinical bed-side for imaging.
Fig. 1.
Overview of hand-held ophthalmic OCT system hardware configuration. External appearance of the system is illustrated in lower right insert.
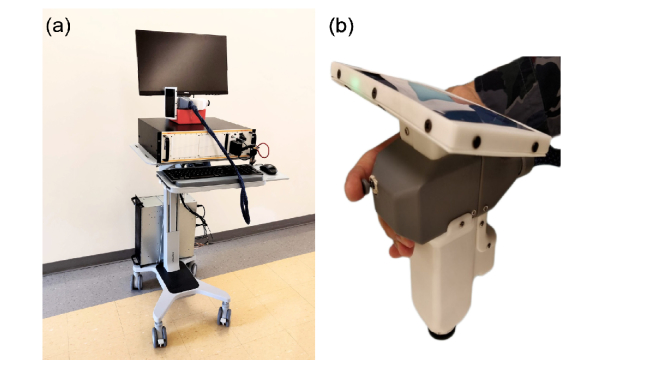
A photograph of the fully constructed imaging system is displayed in Fig. 2(a). The whole system was fitted onto a mobile sit-stand workstation (Workfit-C, Ergotron). The computer was mounted onto a lower position of workstation pillar while the OCT engine was placed on the workstation desk. The probe in hand-held position is shown in Fig. 2(b). The weight of the probe assembly was 948 grams. The resolution of the imaging system was characterized by both axial and lateral resolution independently, because the resolution on these two directions are de-coupled in OCT. The theoretical axial resolution of the system calculated from central wavelength and bandwidth of laser source was 4.6 µm, however the actual axial resolution was measured at 8.9 µm (FWHM of the PSF). The lateral resolution on the retina was limited by the sampling interval on a B-scan, i.e. the spacing between adjacent A-scans. For typical field-of-view of 6.3x6.3 mm sampled at 400 x 400 A-scans, the lateral resolution was 15.75 µm, larger than the diffraction limited scanning beam spot size on an infant’s retina (~8 µm, calculated from 1.7 mm beam on 15.44 mm axial eye length).
Fig. 2.
Photographs of (a) full assembly of SS-OCT system. (b) Hand-held probe in operator’s hand.
2.1 OCT imaging engine
Laser source
A 200-kHz MEMS-tunable swept laser source (AXP50124-3, AXSUN Technologies Inc.) was used as the light source, providing a central wavelength of 1051 nm and a spectral tuning range of 105.2 nm. The laser has an averaged output power of 24.4 mW. Only one direction of the sweep was utilized. Although forward sweep duty cycle is 82.9%, valid sweeping time during forward scan is 3.24 µs out of 5.0 µs sweep period, giving a valid sweep duty cycle of 64.8%. A Mach Zehnder interferometer (MZI) was integrated inside the laser source module to provide a sampling clock for the data acquisition digitizer, in order to achieve linear-K sampling of the spectrum. During the invalid sweep time (>3.24 µs post-trigger), the MZI clock signal was invalid. The digitizer was programmed to switch to a dummy clock at invalid sweep times to prevent malfunctions of ADC (analog to digital converter) on the digitizer. The average sampling clock was 428.5 MHz, providing 1376 clocks per sweep.
Interferometer
The OCT interferometer consisted of a 20:80 fiber coupler and a 50:50 fiber coupler. The first coupler provided a split of 20% laser energy that was delivered to the sample arm port on the front panel of the OCT imaging engine. The other arm of the first coupler carried the remaining light to a motorized, variable optical delay line, where iris diaphragms was used to adjust the reference power. The reference signal, as well as the returned signal from the sample arm, then combined at the second coupler, and split 50/50 onto the balanced photodetectors for signal detection, which was integrated within the laser module.
Electronic peripherals
The electronics of the OCT imaging engine was composed of the following parts: (1) Multifunction I/O: a NI-USB 6341 (National Instruments) device was used for multiple purposes: a) Dual channel analog output for generating galvanometer scanning signals; b) Dual channel analog input for monitoring user inputs from the joystick on hand-held probe; c) One channel digital waveform output for digitizer synchronization; and d) Two channels of digital waveform output for controlling opto-mechanical components, including optical delay line and polarization controller. (2) Scanner servo-drivers: dual-axis galvo servo driver (Cambridge Technologies 673) was used to drive the scanners inside the hand-held probe. (3) Opto-mechanical controllers, including a motorized optical delay line, and a single-paddle, motorized polarization controller. (4) Pass-through signals for OCT probe: the electronic signals required by the hand-held probe was passed through from the computer to the front panel of the OCT imaging engine. This simplified the connection interface between the probe and the rest of the imaging system. The signal pass-through assembly included one USB interface for iris viewer camera, one USB interface for fixation display, and HDMI interface for on-probe display.
Computer
The computer was equipped with a high-speed PCIe-based digitizer (ATS9373, Alazar Technologies Inc.) for collecting OCT signal and real-time display. The raw data could also be streamed onto hard-drive for later processing. In order to minimize the latency for data streaming, PCIe-based solid state drive (MZ-V7E1T0BW, Samsung Electronics Co., Ltd.) provided continuous disk writing speed of 1.9 GB/s, which is capable of handling the data throughput from digitizer without significant delay during writing to hard-drive. Custom software is developed with C + + and LabVIEW platform, that provides a graphical user interface (GUI) and functionalities of real-time 2D preview imaging, as well as 3D data collection and playback.
2.2 Hand-held probe
OCT optics
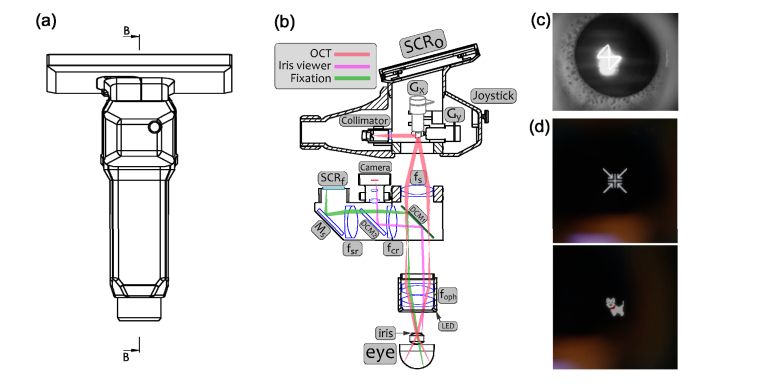
The OCT laser beam enters the hand-held probe from a fixed focus fiber collimator with an initial 1/e2 beam diameter of 3.4 mm. The beam is scanned by a paired X-Y galvo scanning mirror set (6200H/XY, Cambridge Technology, shown as Gx/Gy in Fig. 3), forming raster sampling patterns that consist of a series of fast (x-axis) and slow (y-axis) scans. The driving signals to generate scan pattern is provided by the OCT software, and then delivered to the servo-drivers as analogue waveform of maximum amplitude of +/− 10V. Galvo scanners are configured to +/− 20° mechanical deflect angle at +/− 10V input. Scanning beam first enters an achromatic lens (fs in f = 50 mm), and then after 75 mm distance, enters a paired achromatic lens group, functioning as ophthalmic lens (effective f = 25 mm, foph in Fig. 3). This set of combined lenses works as 2x telescope, which amplifies the scanning angle from +/−20° to +/−36° so that the filed-of-view on retina is extended. The beam diameter is also de-magnified to 1.7 mm at iris plane. The working distance (from lower rim of probe to the pupil of subject) is 17 mm. The optical power measured at the position of subject’s cornea is 1.9 mW, including iris viewer illumination.
Fig. 3.
(a) Front view of hand-held OCT probe with housing. (b) Simplified section view showing internal optical and mechanical configurations. Internal connections including optical fiber and electrical wires are omitted. Outer housing and mechanical positioning components are simplified. SCRo - Screen for operator, SCRf - Screen for subject eye fixation. Gx/Gy - Galvanometers, fs - Scanning lens, DCM1- Dichroic mirror to separate OCT beam, DCM2 - Dichroic mirror to separate iris viewer light, Ms - Reflection mirror for fixation screen. fsr – Fixation screen relay lens, fcr – iris viewer CCD relay lens, foph – Ophthalmic lens. (c) Typical iris viewer image during data acquisition (d) Examples of fixation screen display contents, upper image is a target for adult retina imaging, bottom image is for pediatric imaging.
Iris viewer
Iris viewer is integrated into the hand-held probe in order to assist the operator for rapid positioning and alignment of the OCT probe with the optical axis of subject eye. The working wavelength for the iris viewer is 805 nm, as the subject iris is illuminated by a ring of 850 nm LEDs underneath the ophthalmic lens casing (Fig. 3). The benefit of near-IR illumination is that, the iris viewer maintains excellent functionality at low light environment, thus avoiding the contraction of pupil when illuminated by visible light. Back-scattered light from subject’s iris goes through the ophthalmic lens, and reflected by two dichroic mirrors, then received by a 1/3-inch format, monochrome CMOS camera (MT9M021, The Imaging Source LLC.). The camera sends real-time video to the PC, which is displayed on the operator’s screen (SCRo) for visual feedback of probe positioning. The two dichroic mirrors are: DCM1, a long-pass dichroic mirror (DMLP900R, Thorlabs Inc.) with a cut-off wavelength at 900 nm, inserted between the scanning lens (fs) and the ophthalmic lens (foph, Fig. 3); and DCM2, a short-pass dichroic mirror (DMSP805, Thorlabs Inc.), cut-off wavelength at 805 nm to separate the iris viewer optical path and fixation screen optical path. The size of DCM1 is 36 x 25 x 1 mm (L x W x H), placed at 45° to OCT beam axis, providing 25 x 25 mm aperture for the scanning optics without sacrificing OCT scan range. OCT imaging is tested with and without installing DCM1 mirror, and the image quality degradation due to installation of DCM1 is negligible. Typical image from the iris viewer is presented in Fig. 3(c). Note that, the cross-shaped pattern seen on cornea is the scan-pattern that is utilized when the imaging system is in preview mode (orthogonal B-scan). This pattern can be used as an indication of optical axis of the probe being aligned with the apex of cornea.
Fixation screen
The purpose of the fixation screen is to provide a fixation target for the test subject to stare at, during OCT imaging operations. In our prototype design, a 0.96-inch, 128 x 128 pixel OLED display module is used to display simple graphics. Light emitted from the OLED screen goes through lenses fsr, fcr, dichroic mirror DCM2, reflected by DCM1, and then delivered to subject’s eye through ophthalmic lens foph, as shown in Fig. 3. Any patterns generated by the computer can be displayed. However, in the current prototype, for adults who are typically cooperative during imaging, a plus marker “+” is displayed for maintaining fixation. For pediatric imaging, simple animations can be played on the screen to attract attention from young children. This animation display is particularly useful to promote their cooperation so that they can maintain still during the OCT/OCTA scans. However, the fixation screen is disabled for infant imaging due to their incapability to follow instructions and looking at the fixation screen. Some examples of the fixation screen contents are shown in Fig. 3(d).
On-probe display
For convenience of the OCT imaging system operator, a high-definition screen is fitted onto the hand-held probe (SCRo as in Fig. 3), so that the OCT imaging software GUI (graphical user interface) is displayed right on the probe. The screen is a 5.9-inch LCD screen at 1920 x 1080-pixel resolution. Screen power is delivered through USB bus and video signal is mirrored from the computer display, which is delivered by HDMI interface. The screen assembly weighs only 146 grams, adding a negligible weight burden for holding the probe. Since the screen is mounted on the probe, the operator does not need to look away from the subject while positioning the probe and optimizing image quality, which is a critically important feature that essentially improves the safety of subject, and the efficiency for data collection in pediatric imaging applications.
Joystick controls
An analog joystick control served as on-probe user input for the convenience of operator. The joystick has dual-axis potentiometer and a push button. It was configured to provide bi-directional input command for adjusting reference optical delay when the joystick is steered up/down; and adjusting polarization when steered left/right. Push button served as “start acquisition” trigger. Joystick was wired through probe cable, which was fed to the multifunctional I/O device for communication with control software.
2.3 Image acquisition
Imaging procedures
In this study, 3D OCT/OCTA imaging sessions were conducted in laboratory environment on healthy adult volunteers, as well as in Neonatal Intensive Care Unit (NICU) environments for premature infants. NICU subjects were selected by the pediatric ophthalmologists during ROP screening. The inclusion criteria are determined by neonatologists, i.e., that subjects’ vital signs should be stable enough to undergo hand-held OCT imaging. Visual inspection of the infants’ pupil was performed in advance under the same environment, and mydriatics eye drops were only applied if the pupil diameter was below 3 mm. There was no other medication applied for the infants. Written consents were obtained from subjects/parent(s) prior to imaging. The use of OCT laboratory equipment was approved by the Institutional Review Board of the University of Washington, and the study conformed to the tenets of the Declaration of Helsinki.
The procedures for imaging NICU infants are briefly as follows: 1) Infant subject was laid with a comfortable position on their back (i.e., on a supine position), and vital signs of subject to be suitable for imaging were confirmed. 2) The hand-held probe was then approached to subject right eye (OD) by a clinical operator. 3) The subject’s iris was positioned at the center of iris view image. 4) The on-probe joystick was used to adjust reference delay, so that the OCT image of retina is positioned in the middle of system ranging on the display. 5) The joystick was used to control reference polarization, and maximize OCT image intensity. 6) When confirmed ready, start button on the joystick was then pushed to start data acquisition. The probe was maintained still during imaging with assistance from iris viewer.
The procedures for imaging adult subjects follow similar protocol for imaging NICU infants, except that no vital sign monitoring is necessary. Images were taken with the subject and operator both at sitting position. Operator was resting their elbows on a desk and using two fingers as spacer between the probe and subject’s eye-lids. The subject was asked to stare at the fixation screen inside the probe. No external fixation or support device is required. All data collected are processed offline after imaging sessions.
Scanning protocol
Depending on the scanning mode, the hand-held OCT has three categories of scanning protocol: 1) 2D preview mode: x axis galvo scans through one horizontal line on retina to form one B-scan, and then y-axis galvo scans through a vertical line, forming a set of orthogonal imaging planes. Then this pattern is repeated until operator is satisfied with targeting. A-line number per B-scan is 500. 2) 3D OCTA mode: 400 A-line per B-scan, 4 repeated B-scans per imaging plane, 400 planes, and total image number: 1600. Bi-directional B-scan protocol is utilized in order to eliminating time required for galvo fly-back [31], thus optimizing imaging throughput. Image acquisition time is only 3.2 seconds, with B-scan interval of 2.5 ms. 3) 3D structural OCT mode: similar scan protocol to OCTA, but without repeated scanned at each B-scan position. The resultant image volume contains 400 B-scan images, with 400 A-lines per B-scan. Imaging collection time is 0.8 second [32].
2.4 Data processing and visualization
As described by the scanning protocol section above, each volumetric C-scan is formed by a stack of B-scans. With OCTA imaging protocol, each group of repeated B-scans were processed into two images, one being the OCT structural image and another the OCTA angiogram. The procedure for the data processing is summarized as follows, also shown in Fig. 4) Raw data from digitizer is re-assembled to a 2D array, with first dimension as wavelength, and second dimension is A-line index, i.e. lateral position. 2) Raw spectrum is convolved with a phase vector, to compensate for dispersion mismatch. This phase vector is obtained from a calibration procedure described in [33]. 3) FFT is performed along k, and half of the resultant 2D array is truncated, forming a complex B-scan image. 4) Each group of complex B-scan images is processed by a robust numerical phase-stabilization algorithm [34]. 5) Eigen-decomposition-based OMAG algorithm [35,36] is applied to separate blood flow signal from static signal, forming two images. 6) Repeat the above steps for all imaging planes, assembling a C-scan. Each OCTA C-scan produces two volumes of 3D images, one for structure, and one for angiogram.
Fig. 4.
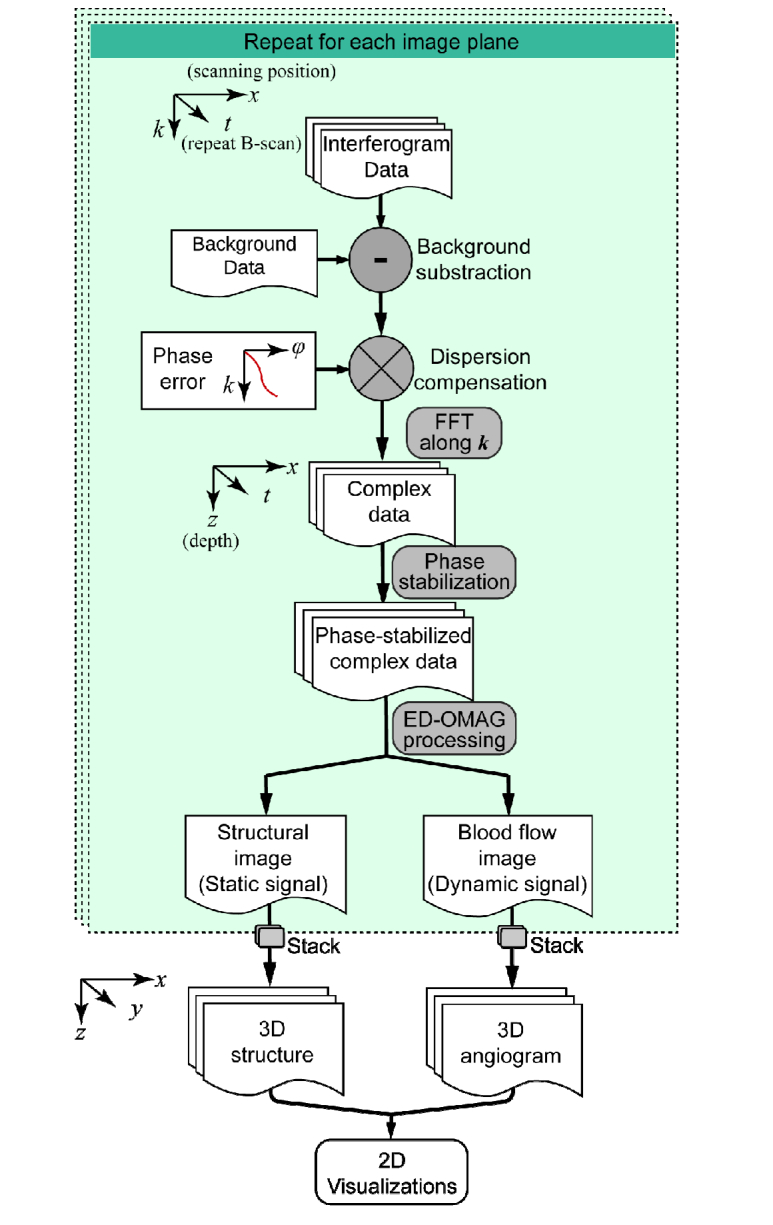
Flow chart of data processing procedure.
Imaging result visualizations are processed following OCTA conventions, where image segmentation is performed on entire volume to separate the vascular networks in different layers [37]. In this study, the retina was segmented into three layers: the superficial retina from ganglion cell layer (GCL) to inner plexiform layer (IPL), the deep retina from inner nuclear layer (INL) to outer plexiform layer (OPL) and the outer retina from outer nuclear layer (ONL) to external limiting membrane (ELM). The choroid layer was segmented from retinal pigment epithelium (RPE) to 200 µm below the RPE. In addition, choriocapillaris was also segmented which was 20µm-thick layer located 20µm below the RPE. Maximum intensity projection is provided for visualizing blood vessel networks in en-face view. If necessary, false color maps of retinal vasculature are produced by coding superficial retinal as red and deep retinal as green to better visualize the depth-resolved vasculatures. Field-of-view on retina is estimated from scanning angle and axial eye length [32].
3. Results
3.1 Field-of-view calibration
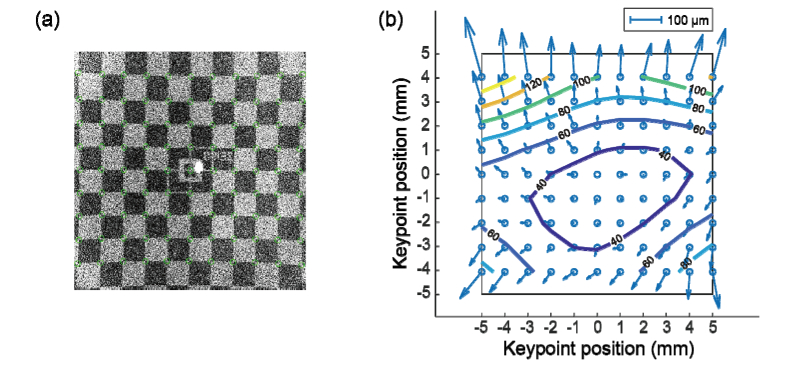
To test the imaging field of view and calibrate image distortion on the HH-OCTA system, a phantom model eye is utilized as calibration target. The model eye was specially designed to simulate adult human eyeball with a checker-board pattern printed on retinal-mimicking surface, which was used to calibrate commercial OCT systems. The total size of the checker-board pattern is 12 x 12 mm2, and size of each box on the pattern is 1 x 1 mm2. Center of the pattern is aligned with fovea. The model eye is mounted on a custom-built cage in order to precisely align to the hand-held probe. A 3D volume with 400 x 400 A-lines is acquired by the HH-OCT system with maximum field-of-view. The en-face maximum intensity projection image is presented in Fig. 5(a).
Fig. 5.
Field-of-view calibration results. (a) En face projection image produced from model eye scan, with maximum field-of-view. Green circles indicate the keypoints of checkered board pattern. (b) Distortion vector map derived from (a) where contour of distortion amplitude is overlaid.
From Fig. 5(a) the field of view on adult retina is estimated to be slightly over 10 mm by 10 mm. After applying checkerboard pattern key points detection algorithm [38], the image distortion field is calculated by comparing to the standard pattern. The resultant distortion vector map is shown in Fig. 5(b), together with contour plot showing the distortion amplitude. Most area of the field-of-view has distortion less than 100 µm, and the mean amplitude of distortion is 57.1 µm. Top portion of the image presents larger distortion due to lower scanning velocity at the beginning of each B-scan. Nevertheless, the overall distortion of image meets the distortion requirement of the standard for visualization and quantification purposes. If, however, further improvement of image fidelity is required, an evenly spaced sampling grid can be derived from the distortion vector map, so that images can be re-sampled accordingly, to eliminate field distortion.
3.2 Healthy adult imaging
Retina imaging was conducted on healthy adult volunteer, with OCTA scanning protocol. As time consumption is an essential metric for user experience, we used stop-watch to record the time for completing each step of our imaging. The time required to target at macular region was below 10 seconds in 8 out of 10 attempts, and approximately 20 seconds were required to optimize the image by maneuvering the positioning of the probe and adjusting the system polarization.
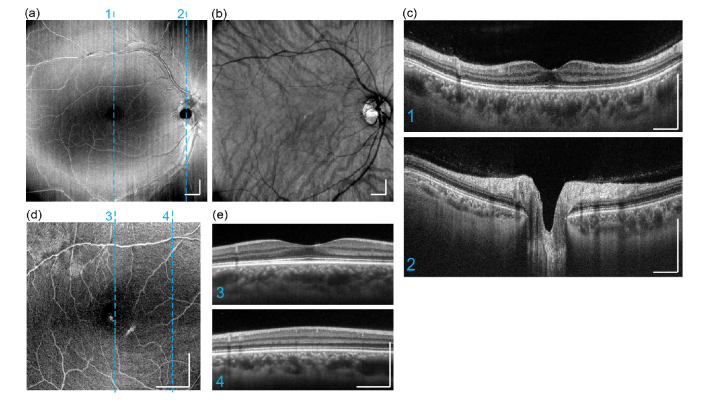
Typical OCT intensity image results from a normal subject (OD, 29 yr male) are presented in the form of en-face average intensity projection (Fig. 6(a),(b),(d)), as well as selected cross-sectional B-scans (Fig. 6(c), (e)). Each cross-sectional image displayed was averaged from 12 B-scans acquired at 3 imaging planes (4 repeated B-scans at each imaging plane). The wide-field imaging had a scan area of 10 x 10 mm2 (Fig. 6(a)-(c)), and Fig. 6(d)(e)) presents a higher-magnification scan area of 5 x 5 mm2. In the wide-field structural projection image (Fig. 6(a)), an overview of the retina is visualized. Large and medium sized blood vessel are also visible. Averaged choroidal intensity projection image is presented in Fig. 6(b), where large choroidal vessels can be traced due to their dark appearance [39]. Two selected B-scans are presented at cross-sectional planes on fovea and optic nerve head. In these images, each physiological layer in the retina can be individually identified. The imaging system also provided sufficient sensitivity to show sparsely distributed hyper-reflective opacities in vitreous, as well as to visualize the posterior cortical vitreous. All these results correspond well to the anatomy of the posterior eyes in standard textbooks [40]. In high-magnification imaging (Fig. 6(d), (e)), denser lateral sampling (12.5 μm pixel spacing compared to 25 μm at wide-field) was possible given the fixed imaging speed of 200 kHz of the system, providing retinal anatomical information with higher fidelity.
Fig. 6.
Hand-held ophthalmic OCT structural imaging results acquired from a healthy adult. (a) Wide-field (10 x 10 mm2) En-face average intensity projection of retina (b) Corresponding wide-field structural projection of choroid. (c) Two selected cross-section B-scans from 3-D scan result, imaging planes are indicated by dashed lines in en-face projection image. (d) En-face average intensity projection. (e) Two selected B-scans. All scale bars: 1 mm.
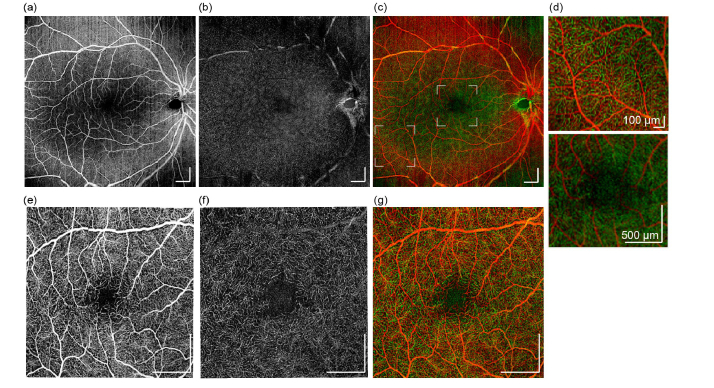
Imaging results has shown that, hand-held OCTA probe used in this study is capable of providing capillary-level resolution en face OCTA images. Superficial and deep retina angiography with wide field-of-view are shown in Fig. 7(a) and (b), respectively. Images were produced by maximum intensity projection (MIP) of corresponding layers. False color image is presented in Fig. 7(c), where superficial and deep retina layers are color coded to red and green channels respectively, so the retinal vessel morphology, as well as depth information can be presented in the same image. Figure 7(d) shows two partially enlarged images from Fig. 7(c), one from lower left region (1 x 1 mm2), and one from central fovea (2.5 x 2.5 mm2), so that the details of angiogram are depicted. One can conclude that at large field-of-view, details in capillary vessels were washed out, especially in central fovea. In perifoveal region, capillaries could be partially resolved since inter-capillary distance gets larger. Higher magnification retinal images were collected using smaller FoV and results are displayed in Fig. 7(e)-7(g)): en face MIP images of superficial retina layer (e), deep retina layer (f), and false-color depth encoded image (g). The parafoveal capillaries were clearly visible, thereby allowing visualization of the foveal avascular zone (FAZ). Vascular ring is visible around the FAZ, and capillary vascular density appears to increase radially with the increase of its distance to the foveal center, which can be observed on both superficial retina (Fig. 7(e)) and deep retina (Fig. 7(f)) layers. For choroid layers, due to the limitations in system lateral resolution, the detailed structure of choriocapillaris is not visible, so the projection images are omitted here.
Fig. 7.
Hand-held OCTA imaging results obtained from a healthy adult. Wide-field (10mm x 10mm) en face OCTA of (a) superficial retina layer, (b) deep retina layer, and (c) Color encoded OCTA of superficial and deep retina. (d) Partial enlarged images from (c) to show capillary details. Location of these two enlarged regions are indicated in (c), with white boxes. Higher magnification en face OCTA (5mm x 5mm) of macular region: (e) superficial retina layer, (f) deep retina layer. (g) Higher magnification color encoded OCTA of superficial and deep retina. All scale bars: 1 mm unless noted otherwise.
3.3 Imaging of premature infants
Preliminary imaging sessions were performed on seven premature infants in NICU. The infants had a mean ( ± SD) gestational age of 28 weeks 2 days ( ± 3 weeks 2 days). Mean (SD) postmenstrual age (PMA) at imaging was 36 weeks 4 days ( ± 3 weeks 2 days). There were two operators involved in this study with extensive experiences using a commercially available hand-held ophthalmology OCT system (Envisu C2300, Leica Microsystems). Both of whom has reported that the prototype hand-held OCT probe used in this study is significantly more comfortable and efficient, due to the introduction of iris viewer and on-probe display that provides rich visual feedback when positioning the probe. This was also confirmed by statistics of time consumption during imaging sessions. The imaging system was able to capture a first retina image for 85% (6/7) subjects in under 30 seconds. Compared to a previous study where only 31% of imaging sessions were able to capture an image in <1 minute [32], indicating that the prototype hand-held OCT probe reported here is over 4 times more time-efficient. Due to the difference in eye axial length between infants and adults, the FoV is effectively smaller on infants. For example, for the same scanning angle, 10 mm scanning range on adult retina is equivalent to 6.3 mm on a 32-week PMA infant.
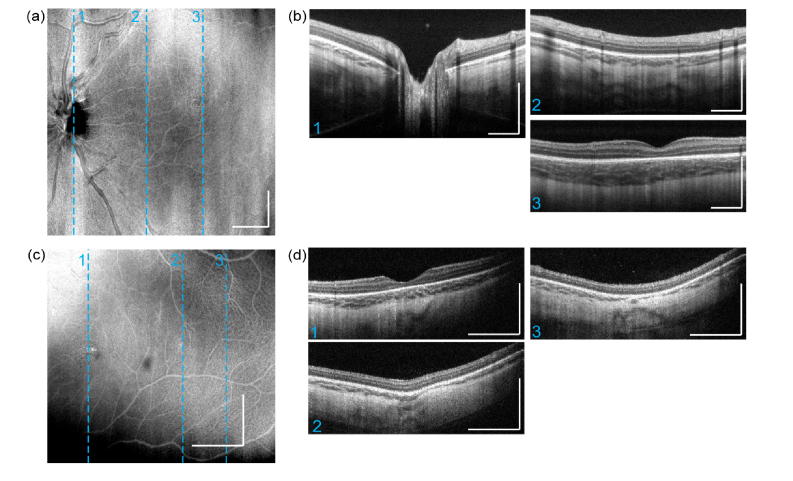
Two representative imaging results for structural imaging are presented below in Fig. 8. Images are acquired using the OCTA protocol, so each B-scan was the averaged result from 4 repeated scans on a same position. Figure 8(a), 8(b) are a wide-field volume acquired from an infant at postmenstrual age of 40 weeks. Similar to the images acquired from adults, all the layers in subject’s retina and choroid are clearly resolved. All structural images indicate that OCT imaging penetration depth into choroid is significantly higher than adults. Figure 8(c, d) are the imaging results obtained from a premature infant at even earlier stage with postmenstrual age of 28 weeks at imaging. In this case, choroidal prematurity is observed where the choroid appears significantly thinner, compared to that of postmenstrual age of 40 weeks.
Fig. 8.
Hand-held ophthalmic OCT structural imaging results on pre-mature infants. Results obtained from an infant of 40-week gestational age, with an imaging field of view at 7.0 x 7.0mm: (a) En-face average intensity projection (b) three selected cross-section B-scans from 3-D scan result, imaging planes are indicated by dashed lines in en-face projection image. Results obtained from an infant of 28-week gestational age, with an imaging field of view at 3.6 x 3.6 mm: (c) En-face average intensity projection. (d) three selected B-scans. All scale bars: 1 mm.
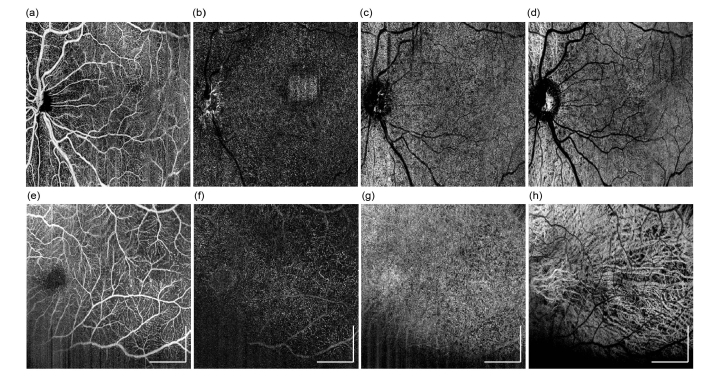
The same two data sets as shown in Fig. 8 was processed by OCTA algorithms and the resulting angiographic results are presented in Fig. 9. First row (a-d) are the OCTA maximum intensity projection en face images produced from four layers, superficial retina, deep retina, choriocapillaris, and deep choroidal layer, respectively. With this wide-field format, Fig. 9(a) has shown satisfying angiography image quality that reveals the artery and veins on retina. With the retina being in developing stage, capillaries are not as clearly distinguished as normal adult imaging at wide-field format, nevertheless, the OCTA image can still provide valuable information of vessel density, complexity, and tortuosity etc. Choriocapillaris also appears to be blurry due to low sampling density (Fig. 9(c)), however, choroidal vessels (Fig. 9(d),(h)) are visualized much better than adult imaging results, possibly due to the under-development of retinal pigment epithelium (RPE) layer, which may exhibit lower light scattering when compared with the fully developed RPE in the adult. Figure 9(e)-(h) are the OCTA en face images presented in the same order as first row, which were obtained from an infant at 28-week gestational age. These results were obtained from a smaller FoV at 3.6 x 3.6 mm, thus the sampling density is higher when compared to the FOV of 7.0 x 7.0mm. Except for the regions that are affected from iris shadowing (lower right region), capillaries on the retinal layers (Fig. 9(e), (f)) can be well resolved. Choriocapillaris (Fig. 9(g)) are also observed to form a dense fenestrated pattern. All these results indicate that, angiography of the retinal vasculature on premature infants can be readily achieved with the hand-held OCTA probe, scan protocol, and post-processing algorithm.
Fig. 9.
OCTA imaging results can be obtained from premature infants. Results were obtained from an infant at gestational age of 40 weeks, with a FOV of 7.0 x 7.0mm: (a-d) OCTA maximum intensity projection en face images produced from four layers, superficial retina, deep retina, choriocapillaris, and deep choroid, respectively. (e-h) higher magnification OCTA en face images were obtained from an infant at gestational age of 28 weeks, with a FOV of 3.6 x 3.6mm, which are presented in the same order as the row above. All scale bars: 1 mm.
4. Discussion and conclusions
We have described our newly developed clinical prototype miniature hand-held OCT probe that incorporates protocols and algorithms that permit in vivo imaging of 3D retinal structures and microvasculature with high resolution in adults as well as premature infants. We have focused on the improvement of the usability of the imaging system enabled by a number of innovations, including a direct-viewing iris camera, real-time orthogonal OCT image viewing, and an on-probe display. These innovations provided multiple visual feedbacks to the operator that dramatically improve the successful rate of the infant imaging. The combination of high-speed SS-OCT and user-orientated design was proved successful in providing reliable 3D OCT and OCTA images in an NICU environment.
There are still a few limitations using the prototype handheld OCT system for RoP screening purpose, which warrants further improvement. So far, the largest field-of-view provided by our system was about 40 degrees viewing angle (at pupil entrance). Although this was already considered as wide-field OCT/OCTA, it is still too small to cover peripheral retina, where the characteristics of RoP are most essential. Nevertheless, re-configurations of scanning optics can be made to the probe, by increasing the angular magnification of the 4-f system in front of the eye, with reduced pupil entrance beam diameter, and extended viewing angle. In doing so, the resultant OCTA image is potentially capable of providing more information in peripheral retina, with the trade-off of reduced lateral resolution. The limitations of increasing magnification also include shortening the focal length of the ophthalmic lens in front of the eye, thus reducing the working distance of the probe and making the operations more difficult.
We recognize that there is a high demand for advanced skills from the operator. To use any hand-held OCT probe for infant imaging, it typically requires large amount of experiences with OCT systems. This is due to the highly demanding probe positioning procedure, where in order to position the probe correctly and properly, the operator must control 6 degrees of freedom (DoF) simultaneously, including all three translational DoF and three rotational DoF of the probe. Our innovative prototype hand-held OCT probe has, in some degrees, addressed these issues by providing multiple visual feedbacks for probe positioning. However, there is still room for further improvement of the experience in maneuvering the probe that can rapidly target the desired field-of-view on infants’ fundus. Future designs that aim to integrate a second, high-speed posterior eye imaging modality, e.g. scanning laser ophthalmoscope, might be a solution to this problem.
Motion artifact is a major barrier for obtaining reliable OCTA images. We have found that, using two fingers as spacer between the probe and the subject’s eye, the operator becomes significantly more confident to stabilize during imaging. However, motions from the subject, especially from uncooperative infants, can also deteriorate the OCTA image quality. Higher speed swept lasers, advanced scanning protocols and post-processing stabilization techniques are the promising routes to reduce the scanning time and achieve higher OCTA image fidelity.
In summary, we have demonstrated the advantages of miniature handheld clinical prototype OCT that is suitable for rapid, non-invasive imaging in infants, including premature babies. As OCT imaging technologies continue to advance, our proposed hand-held OCTA probe would promise a useful clinical tool for pediatric ophthalmic diagnosis as well as prematurity screening.
Acknowledgements
The authors wish to thank Dr. Michelle Cabrera and Dr Alex Legocki, both from Department of Ophthalmology, University of Washington, for their enthusiastic help and support in operating the prototype system to acquire images from premature infants in the neonatal intensive care unit. The study was supported in part by a generous support received from Washington Research Foundation in Seattle and the Department of Bioengineering, University of Washington.
Funding
Washington Research Foundation.
Disclosures
Song and Wang (P), All other co-authors (none).
References
- 1.Gilbert C., Fielder A., Gordillo L., Quinn G., Semiglia R., Visintin P., Zin A., “Characteristics of infants with severe retinopathy of prematurity in countries with low, moderate, and high levels of development: implications for screening programs,” Pediatrics 115(5), e518–e525 (2005). 10.1542/peds.2004-1180 [DOI] [PubMed] [Google Scholar]
- 2.Good W. V., Hardy R. J., Dobson V., Palmer E. A., Phelps D. L., Quintos M., Tung B., Early Treatment for Retinopathy of Prematurity Cooperative Group , “The incidence and course of retinopathy of prematurity: findings from the early treatment for retinopathy of prematurity study,” Pediatrics 116(1), 15–23 (2005). 10.1542/peds.2004-1413 [DOI] [PubMed] [Google Scholar]
- 3.Fierson W. M., “Screening examination of Premature Infants for retinopathy of prematurity,” Pediatrics 142(6), e20183061 (2018). 10.1542/peds.2018-3061 [DOI] [PubMed] [Google Scholar]
- 4.Lorenz B., Spasovska K., Elflein H., Schneider N., “Wide-field digital imaging based telemedicine for screening for acute retinopathy of prematurity (ROP). Six-year results of a multicentre field study,” Graefes Arch. Clin. Exp. Ophthalmol. 247(9), 1251–1262 (2009). 10.1007/s00417-009-1077-7 [DOI] [PMC free article] [PubMed] [Google Scholar]
- 5.Gilbert C., “Retinopathy of prematurity: a global perspective of the epidemics, population of babies at risk and implications for control,” Early Hum. Dev. 84(2), 77–82 (2008). 10.1016/j.earlhumdev.2007.11.009 [DOI] [PubMed] [Google Scholar]
- 6.Lad E. M., Hernandez-Boussard T., Morton J. M., Moshfeghi D. M., “Incidence of retinopathy of prematurity in the United States: 1997 through 2005,” Am. J. Ophthalmol. 148(3), 451–458 (2009). 10.1016/j.ajo.2009.04.018 [DOI] [PubMed] [Google Scholar]
- 7.International Committee for the Classification of Retinopathy of Prematurity , “The international classification of retinopathy of prematurity revisited,” Arch. Ophthalmol. 123(7), 991–999 (2005). 10.1001/archopht.123.7.991 [DOI] [PubMed] [Google Scholar]
- 8.Wu C., Petersen R. A., VanderVeen D. K., “RetCam imaging for retinopathy of prematurity screening,” J. AAPOS 10(2), 107–111 (2006). 10.1016/j.jaapos.2005.11.019 [DOI] [PubMed] [Google Scholar]
- 9.Hartnett M. E., Pediatric retina (Lippincott Williams & Wilkins, 2005). [Google Scholar]
- 10.Yen K. G., Hess D., Burke B., Johnson R. A., Feuer W. J., Flynn J. T., “Telephotoscreening to detect retinopathy of prematurity: preliminary study of the optimum time to employ digital fundus camera imaging to detect ROP,” J. AAPOS 6(2), 64–70 (2002). 10.1067/mpa.2002.121616 [DOI] [PubMed] [Google Scholar]
- 11.Adams G. G., Clark B. J., Fang S., Hill M., “Retinal haemorrhages in an infant following RetCam screening for retinopathy of prematurity,” Eye (Lond.) 18(6), 652–653 (2004). 10.1038/sj.eye.6700728 [DOI] [PubMed] [Google Scholar]
- 12.Ng E. Y., Lanigan B., O’Keefe M., “Fundus fluorescein angiography in the screening for and management of retinopathy of prematurity,” J. Pediatr. Ophthalmol. Strabismus 43(2), 85–90 (2006). [DOI] [PubMed] [Google Scholar]
- 13.Yokoi T., Hiraoka M., Miyamoto M., Yokoi T., Kobayashi Y., Nishina S., Azuma N., “Vascular abnormalities in aggressive posterior retinopathy of prematurity detected by fluorescein angiography,” Ophthalmology 116(7), 1377–1382 (2009). 10.1016/j.ophtha.2009.01.038 [DOI] [PubMed] [Google Scholar]
- 14.Huang D., Swanson E. A., Lin C. P., Schuman J. S., Stinson W. G., Chang W., Hee M. R., Flotte T., Gregory K., Puliafito C. A., et, “Optical coherence tomography,” Science 254(5035), 1178–1181 (1991). 10.1126/science.1957169 [DOI] [PMC free article] [PubMed] [Google Scholar]
- 15.Tomlins P. H., Wang R. K., “Theory, Developments and Applications of Optical Coherence Tomography,” J. Phys. D Appl. Phys. 38(15), 2519–2535 (2005). 10.1088/0022-3727/38/15/002 [DOI] [Google Scholar]
- 16.Zhang A., Zhang Q., Chen C.-L., Wang R. K., “Methods and Algorithms for Optical Coherence Tomography-Based Angiography: A Review and Comparison,” J. Biomed. Opt. 20(10), 100901 (2015). 10.1117/1.JBO.20.10.100901 [DOI] [PMC free article] [PubMed] [Google Scholar]
- 17.Hussain N., Hussain A., Zhang M., Su J. P., Liu G., Hwang T. S., Bailey S. T., Huang D., “Optical Coherence Tomography Angiography,” Int. J. Retina Vitreous 2(Oct), 27–36 (2016). 10.1186/s40942-016-0053-8 [DOI] [PMC free article] [PubMed] [Google Scholar]
- 18.Chen C. L., Wang R. K., “Optical Coherence Tomography Based Angiography [Invited],” Biomed. Opt. Express 8(2), 1056–1082 (2017). 10.1364/BOE.8.001056 [DOI] [PMC free article] [PubMed] [Google Scholar]
- 19.Kashani A. H., Chen C.-L., Gahm J. K., Zheng F., Richter G. M., Rosenfeld P. J., Shi Y., Wang R. K., “Optical coherence tomography angiography: A comprehensive review of current methods and clinical applications,” Prog. Retin. Eye Res. 60, 66–100 (2017). 10.1016/j.preteyeres.2017.07.002 [DOI] [PMC free article] [PubMed] [Google Scholar]
- 20.Maldonado R. S., Toth C. A., “Optical coherence tomography in retinopathy of prematurity: looking beyond the vessels,” Clin. Perinatol. 40(2), 271–296 (2013). 10.1016/j.clp.2013.02.007 [DOI] [PMC free article] [PubMed] [Google Scholar]
- 21.Campbell J. P., Nudleman E., Yang J., Tan O., Chan R. V. P., Chiang M. F., Huang D., Liu G., “Handheld Optical Coherence Tomography Angiography and Ultra-Wide-Field Optical Coherence Tomography in Retinopathy of Prematurity,” JAMA Ophthalmol. 135(9), 977–981 (2017). 10.1001/jamaophthalmol.2017.2481 [DOI] [PMC free article] [PubMed] [Google Scholar]
- 22.Muni R. H., Kohly R. P., Charonis A. C., Lee T. C., “Retinoschisis detected with handheld spectral-domain optical coherence tomography in neonates with advanced retinopathy of prematurity,” Arch. Ophthalmol. 128(1), 57–62 (2010). 10.1001/archophthalmol.2009.361 [DOI] [PubMed] [Google Scholar]
- 23.Vinekar A., Avadhani K., Sivakumar M., Mahendradas P., Kurian M., Braganza S., Shetty R., Shetty B. K., “Understanding clinically undetected macular changes in early retinopathy of prematurity on spectral domain optical coherence tomography,” Invest. Ophthalmol. Vis. Sci. 52(8), 5183–5188 (2011). 10.1167/iovs.10-7155 [DOI] [PubMed] [Google Scholar]
- 24.Chavala S. H., Farsiu S., Maldonado R., Wallace D. K., Freedman S. F., Toth C. A., “Insights into advanced retinopathy of prematurity using handheld spectral domain optical coherence tomography imaging,” Ophthalmology 116(12), 2448–2456 (2009). 10.1016/j.ophtha.2009.06.003 [DOI] [PMC free article] [PubMed] [Google Scholar]
- 25.Lee A. C., Maldonado R. S., Sarin N., O’Connell R. V., Wallace D. K., Freedman S. F., Cotten M., Toth C. A., “Macular features from spectral-domain optical coherence tomography as an adjunct to indirect ophthalmoscopy in retinopathy of prematurity,” Retina 31(8), 1470–1482 (2011). 10.1097/IAE.0b013e31821dfa6d [DOI] [PMC free article] [PubMed] [Google Scholar]
- 26.Mallipatna A., Vinekar A., Jayadev C., Dabir S., Sivakumar M., Krishnan N., Mehta P., Berendschot T., Yadav N. K., “The use of handheld spectral domain optical coherence tomography in pediatric ophthalmology practice: Our experience of 975 infants and children,” Indian J. Ophthalmol. 63(7), 586–593 (2015). 10.4103/0301-4738.167108 [DOI] [PMC free article] [PubMed] [Google Scholar]
- 27.Muni R. H., Kohly R. P., Sohn E. H., Lee T. C., “Hand-held spectral domain optical coherence tomography finding in shaken-baby syndrome,” Retina 30(4 Suppl), S45–S50 (2010). 10.1097/IAE.0b013e3181dc048c [DOI] [PubMed] [Google Scholar]
- 28.Yang J., Liu L., Campbell J. P., Huang D., Liu G., “Handheld optical coherence tomography angiography,” Biomed. Opt. Express 8(4), 2287–2300 (2017). 10.1364/BOE.8.002287 [DOI] [PMC free article] [PubMed] [Google Scholar]
- 29.C. Viehland, F. LaRocca, D. Tran-Viet, M. Jackson-Atogi, C. Eckard, B. Keller, C. A. Toth, and J. A. Izatt, “Imaging of pediatric pathology in the intensive care nursery using a custom handheld, ultra-compact, swept-source OCT probe,” SPIE Proc Volume 10474, Ophthalmic Technologies XXVIII; 1047416 (2018). 10.1117/12.2290627 [DOI] [Google Scholar]
- 30.Lu C. D., Kraus M. F., Potsaid B., Liu J. J., Choi W., Jayaraman V., Cable A. E., Hornegger J., Duker J. S., Fujimoto J. G., “Handheld ultrahigh speed swept source optical coherence tomography instrument using a MEMS scanning mirror,” Biomed. Opt. Express 5(1), 293–311 (2014). 10.1364/BOE.5.000293 [DOI] [PMC free article] [PubMed] [Google Scholar]
- 31.Ju M. J., Heisler M., Athwal A., Sarunic M. V., Jian Y., “Effective bidirectional scanning pattern for optical coherence tomography angiography,” Biomed. Opt. Express 9(5), 2336–2350 (2018). 10.1364/BOE.9.002336 [DOI] [PMC free article] [PubMed] [Google Scholar]
- 32.Maldonado R. S., Izatt J. A., Sarin N., Wallace D. K., Freedman S., Cotten C. M., Toth C. A., “Optimizing hand-held spectral domain optical coherence tomography imaging for neonates, infants, and children,” Invest. Ophthalmol. Vis. Sci. 51(5), 2678–2685 (2010). 10.1167/iovs.09-4403 [DOI] [PMC free article] [PubMed] [Google Scholar]
- 33.Wojtkowski M., Srinivasan V., Ko T., Fujimoto J., Kowalczyk A., Duker J., “Ultrahigh-resolution, high-speed, Fourier domain optical coherence tomography and methods for dispersion compensation,” Opt. Express 12(11), 2404–2422 (2004). 10.1364/OPEX.12.002404 [DOI] [PubMed] [Google Scholar]
- 34.Song S., Xu J., Men S., Shen T. T., Wang R. K., “Robust numerical phase stabilization for long-range swept-source optical coherence tomography,” J. Biophotonics 10(11), 1398–1410 (2017). 10.1002/jbio.201700034 [DOI] [PMC free article] [PubMed] [Google Scholar]
- 35.Yousefi S., Zhi Z., Wang R. K., “Eigendecomposition-based clutter filtering technique for optical microangiography,” IIEEE T Bio-Med Eng 58(8), 2316–2323 (2011). 10.1109/TBME.2011.2152839 [DOI] [PMC free article] [PubMed] [Google Scholar]
- 36.Zhang Q., Wang J., Wang R. K., “Highly efficient eigen decomposition based statistical optical microangiography,” Quant. Imaging Med. Surg. 6(5), 557–563 (2016). 10.21037/qims.2016.10.03 [DOI] [PMC free article] [PubMed] [Google Scholar]
- 37.Yin X., Chao J. R., Wang R. K., “User-guided segmentation for volumetric retinal optical coherence tomography images,” J. Biomed. Opt. 19(8), 086020 (2014). 10.1117/1.JBO.19.8.086020 [DOI] [PMC free article] [PubMed] [Google Scholar]
- 38.A. Geiger, F. Moosmann, Ö. Car, and B. Schuster, “Automatic camera and range sensor calibration using a single shot,” in Robotics and Automation (ICRA), 2012 IEEE International Conference on(IEEE2012), pp. 3936–3943. 10.1109/ICRA.2012.6224570 [DOI] [Google Scholar]
- 39.Kirby M. A., Li C., Choi W. J., Gregori G., Rosenfeld P., Wang R., “Why choroid vessels appear dark in clinical OCT images,” in Ophthalmic Technologies XXVIII (International Society for Optics and Photonics; 2018), p. 1047428. [Google Scholar]
- 40.Carr R. E., “Physiology of the Human Eye and Visual System,” Am. J. Ophthalmol. 89(2), 314 (1980). 10.1016/0002-9394(80)90140-3 [DOI] [Google Scholar]


