

Abstract
This paper explores the novel application of an automated b-value extraction algorithm for the interpretation of sounds produced by the knee joint during movement. Acoustical emissions were recorded from a total of eight subjects with acute knee injuries a first time, within one week of the injury, then a second time, four to six months following corrective surgery and rehabilitation. The data were collected from each subject using miniature electret microphones placed on the medial and lateral side of the patella during knee flexion and extension exercises. From the acoustical signals measured from each subject, we computed the b-value using the modified Gutenberg-Ritcher equation which is widely used in seismology. The b-value increased for each subject’s injured knee from immediately following the injury to several months post recovery. (mean b-value: 1.46 ± 0.35 [injured] and 1.92 ± 0.21 [post-surgery and recovery], p < 0.01). In addition, we compared this analysis technique against an unsupervised machine learning algorithm from our previous work and found that the b-value metric can be as effective to differentiate changes in the joint sounds as our prior approach while requiring less computational time and complexity – both of which are preferable for future integration of this technology into a wearable system.
Keywords: Acoustical emissions, b-value, wearable sensing, knee health
I. INTRODUCTION
The knee joint is as complex musculoskeletal structure with several anatomical articulations during movement [1]. Because of the knee’s structural complexity and the extreme, multidirectional stresses exerted on the knee during movement, it is particularly prone to factures, sprains, tears, and dislocations. It is one of the most frequently injured body parts—especially in athletes [2]. There are several methods to monitor and diagnose knee health in clinical settings including magnetic resonance imaging (MRI), X-ray imaging, and ultrasound [3, 4]. However, these instruments are not well suited for continuous monitoring due to their high cost, intensive time requirement, and their restriction to a clinical setting.
To overcome these limitations and enable longitudinal, pervasive monitoring of knee joint health, wearable sensing of acoustical emissions from the knee joints has been explored recently to potentially extract quantitative physiological biomarkers of knee health [5–8]. Teague et al. established the joint acoustical emissions measurement in a wearable setting and demonstrated the consistency of the knee sound measurement in the context of joint angle during flexion and extension cycles from subjects with healthy knees [5]. Toreyin et al. examined the repeatability of joint acoustical emissions in ambulatory subjects during every-day activities such as walking and sit-to-stand movements in an uncontrolled environment [6]. Hersek et al. examined joint acoustical emissions in the context of knee injury and recovery by employing an unsupervised machine learning based algorithm to derive a quantitative metric: graph community factor (GCF) [7]. This work showed that the heterogeneity of the constructed graph using GCF is higher for injured subjects than that for healthy subjects and that the heterogeneity decreases in injured knees after four to six months of recovery. Additionally, we have used contact microphones attached to the knee to quantify the effects of increasing mechanical stress on knee acoustical emissions using GCF [8].
GCF is a powerful tool for quantifying joint health based on acoustical emissions; however, there are several limitations to this technique which should be addressed to facilitate its use in wearable sensing applications. The GCF computation is most accurate with acoustical emission data from both legs (e.g., the injured and contralateral sides), requires substantial computational time and power, and cannot currently be computed in real time. In this work, we investigated the use of a quantitative metric of evaluating acoustical emissions—the b-value—for differentiating between the knee sounds of the same groups that the GCF had successfully differentiated in our earlier work. The b-value represents a scaling of the magnitude distribution of the acoustical emissions. It is a measure of the relative number of large amplitudes to small amplitudes. In seismology studies, this ratio indicates the relative number of local failures in materials under stress [9]. Our application of this b-value statistic demonstrated a novel use of this analysis technique; specifically, the first ever application of b-value quantification in joint health assessment.
II. METHODOLOGY
A. Human Subject Protocol
All human subjects research was conducted under approval from the Georgia Institute of Technology Institutional Review Board and for the DoD-funded portion of the work were also approved by the Army Human Research Protection Office. The dataset was acquired as described in previously published work [7], and included knee joint acoustical emissions from nine injured subjects. The injuries included torn anterior cruciate ligaments, torn lateral menisci, and sprained medial collateral ligaments. This dataset includes two measurements: the first measurement was taken within seven days of the injury, and the second measurement was taken four to six months following surgery and rehabilitation. At the time of the second recording, the subjects could resume regular functional activities.
Fig. 1(a) provides an illustration of the measurement setup. For each subject, a low-noise, wide bandwidth electret microphone (COS-11D, Sanken Microphone Co., Japan) was attached to the medial and lateral aspect of the patella without directly contacting the skin. The COS-11D microphone was selected due to its small size, very low noise, high dynamic range, and fairly flat frequency response in the measurement range. The subject was asked to perform five unloaded knee flexion / extension exercises while seated without allowing the foot to contact the ground. The sounds measured by the electret microphones were recorded using an audio recorder (Zoom H6 Recorder, Zoom Corp., Japan) at a sampling rate of 44.1 kHz.
Fig. 1.
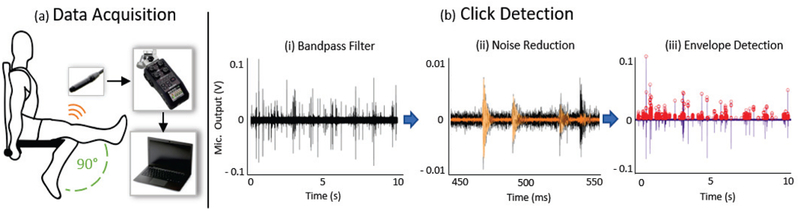
System overview. (a) The knee joint acoustical emissions are captured by an electret microphone on medial and lateral side of the patella using a recorder. The data is stored on a secure digital (SD) card and processed on a personal computer. (b) Click detection algorithm that consists of three steps: bandpass filter, noise reduction and envelope detection.
B. B-value Estimation
In the field of seismology particularly pertaining to earthquakes, Gutenberg and Richter [10] proposed the empirical formula, expressed in Eq. (1), to quantify the logarithmic relationship between the magnitude and frequency of the shockwave generate by the shifting earth
| (1) |
where ML is the corresponding earthquake magnitude, N is the number of corresponding earthquakes larger than ML, and a and b are the constants. The coefficient b which is the slope of the magnitude distribution represents the relative proportion of large to small fracture events occurred during the damage of the material. A high b-value is due to a large quantity of small acoustical emissions representing microscopic cracks. A low b-value indicates macroscopic, fast, and unstable crack growth accompanied by a high quantity of high amplitude acoustical emissions. To apply the Gutenberg-Richter formula to acoustical emissions, the magnitude term (ML) is replaced by the amplitude of the acoustical emissions in decibels as follows in Eq. (2) and Eq. (3):
| (2) |
| (3) |
where AdB represents the peak amplitude of the acoustical emission hit in decibels, and NAE represents the number of acoustical emission hits with an amplitude greater than the predefined threshold. The b-value obtained in this relationship must be multiplied by a factor of 20 because the acoustical emission amplitude is measured in dB, whereas the Richter magnitude of an earthquake is defined in terms of the logarithm of its maximum amplitude. Due to the variability of amplitude distributions and potential outliers, an ‘improved b-value (Ib-value)’ was proposed by Shiotani et al [11]. The Ib-value is defined as
| (4) |
where σ is the standard deviation of the detected clicks, μ is the mean amplitude of the detected clicks, α1 and α2 represent coefficients of upper and lower limits defined by the user. Previous studies have used this relationship for monitoring the progressive failure of various geologic materials (e.g. rocks, concrete, wood, fiberglass, etc) [12].
In this work, we did not observe any distinct outliers of high or low amplitude in the acoustical emissions from the previously recorded joint sounds. Thus, we implemented a modified b-value analysis (Eq. 2 and 3). In recordings with distinct outliers in acoustical emission amplitude, Equation (4) should be used instead. The changes in the b-value from the two measurements for each subject were compared to evaluate whether acoustical emissions from the knee joints could classify and quantify the knee’s status as injured or healthy (i.e., recovered). The b-value is presented as the average of the b-values from each of the acoustical signals acquired from the microphones placed on the medial and lateral side of the patella.
C. Signal Processing
The principal goal of the signal processing was to detect high amplitude, short durations “clicks” in the acoustical signals—these are typically referred to as “acoustical emissions.” First, the sounds acquired during five flexion / extension cycles from the knees of the subjects are digitally filtered using a finite impulse response band-pass filter with a bandwidth from 1kHz-15kHz. This bandpass filter removes the majority of the interface noise in the signal, and prioritizes the bandwidth of the high energy, short duration joint sound signatures.
After this pre-processing step, we implement a spectral noise suppression technique to remove the static background noise [13] as illustrated in Fig. 1(b). The measurements had a static background noise recorded prior to performing the flexion / extension exercise and thus this segment was considered as the background noise model that we then removed automatically. The sound data is windowed, and for each windowed segment we perform a fast Fourier transform (FFT) using a Hanning window and compute the expected value of the noise magnitude spectrum μN for each frequency bin. This is then subtracted from the signal magnitude spectrum and the differences having negatives values are set to zero. After the noise suppression, the signal is reconstructed using an inverse FFT. Then we use a modified envelope detection algorithm where the adaptive threshold is set as the sum of the root-mean squared and the maximum value of the reduced static background segment. This identifies the desired joint clicks from the acoustical emissions that are high-frequency and short durations. Once the clicks are detected, we calculate N which is the total number of clicks greater than the corresponding AdB. Using equation (2), we calculate the linear coefficients to obtain the b-value.
III. RESULTS AND DISCUSSION
A. B-value Estimation for Injured and Recovery Phases
We calculated the b-values from two measurements: the first was at the time of the knee injury, and the second took place four to six months later. In the previous work with this dataset, recordings from one subject were found to be an outlier, likely attributed to a noisy measurement, and thus this subject was omitted for the analysis. Fig. 2 shows the cumulative frequency-magnitude distribution plots of acoustical emissions corresponding to the injured and recovered phase for one subject to provide a means of visualizing how the b-value relates to peak amplitudes in the acoustical emissions waveforms. The b-value for the injured phase was 1.64 and for the recovered phase was 2.23. Additionally, Fig. 3(a) illustrates an example of the difference between the injured and recovered phase.
Fig. 2.
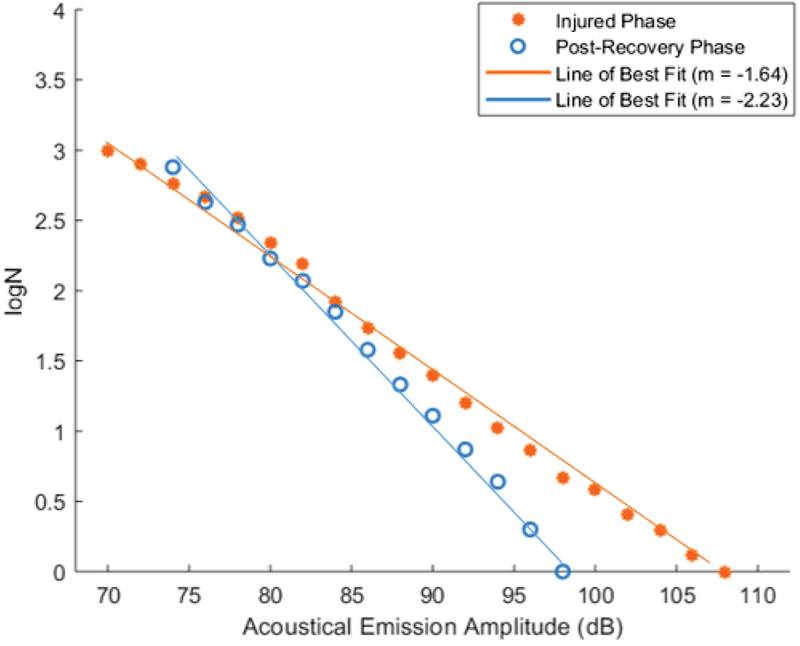
Cumulative occurrence frequency and the amplitude relationship plot of the acoustical emissions for injured and post-recovery phase for one subject.
Fig. 3.
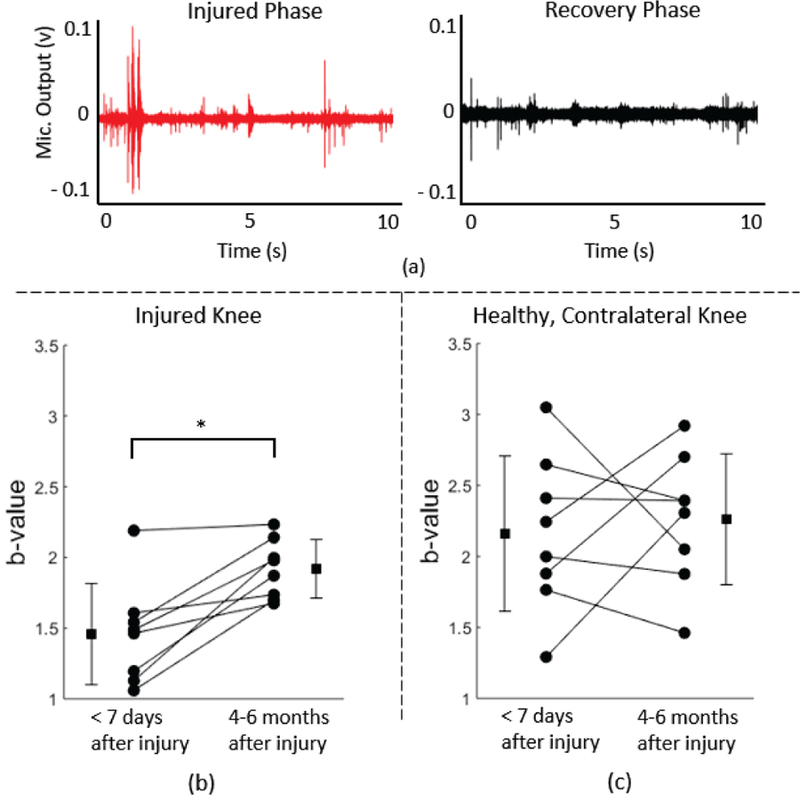
(a) An example 10 sec joint sound recording showing injured and recovered phases. There are more clicks with larger amplitudes in the injured phase than the recovered phase. (b) A boxplot showing increase in the b-value for subjects (n=8) between the injured knee and the recovered knee. The asterisk (*) represents significance (p<0.01). (c) A boxplot showing no significant changes.
For the entire dataset, the average b-value was 1.46 ±0.35 for the injured phase and 1.92 ±0.21 for the recovery phase. The b-value was lower for the injured phase than the recovery phase (healthy status). Fig. 3(b) provides a comparison plot of the b-values calculated for all subjects. A paired sample t-test was performed to evaluate the statistical significance. This difference between the two groups (injured vs recovered) was statistically significant (p<0.01). There was an increase in the b-value of the acoustical emissions from the joints from the injured phase to the recovered phase in all eight subjects.
B. B-value Estimation for Injured and Healthy Knee
We also calculated the b-values from the healthy, contralateral (i.e. control) knee to compare against the differences between the injured and recovery phase with the injured knee. The averaged b-value was 2.16 ± 0.51 for the injured phase and 2.26 ± 0.43 for the recovery phase. Fig. 3(c) provides all the b-values calculated for the healthy, contralateral knees of the same subjects. There was no statistical significance between the two groups suggesting that there is little to no change in the b-value in the contralateral (control) knee. Additionally, the values from the healthy knees were generally higher than the values from the injured knees. This indicates that b-value algorithm can be applied for one knee alone, and that it can be used as an absolute measure of knee health without the need for normalization.
C. Comparison of b-value versus GCF
The results stated above indicate that the b-value can provide useful information about the knee sound patterns and enables one to discern between an injured knee and a recovered, healthy knee. To compare this analysis technique to the previously used GCF analysis schema, we calculated the effect size which quantifies the size of the difference between the two groups. The statistical significance (i.e. p<0.01) would elucidate whether there is a difference between two groups and the effect size would tell us the magnitude of the difference. The effect size for the b-value was 1.28 and for the GCF was 2.46. Based on Cohen’s terminology, a value greater than 0.8 is considered a large effect size meaning there is a visible difference between the two groups [14]. This indicates that b-value algorithm is similarly as effective as GCF in differentiating between the injured knee and the recovered knee. Additionally, the average computational time was 2.66±0.16 seconds for the proposed click detection and b-value algorithm and 23.61±39.93 seconds for unsupervised machine learning algorithm. This demonstrates that b-value extraction method is less computationally intensive, thus allowing potential implementation on-board a wearable device.
IV. CONCLUSION AND FUTURE WORK
This paper demonstrates that the b-value, extracted automatically from knee acoustical emissions, can quantify changes in the knee health for patients with acute injuries and throughout rehabilitation. Previously, to extract such information from knee acoustical emission recordings, we relied heavily upon complex machine learning algorithms. In this paper, we found the same relationships as were previously studies using a much less computationally-intensive approach, and using only data from the injured leg (without the need for the contralateral side). This method of using the b-value greatly enhances the potential for incorporating a joint sound detection suite into a wearable system by allowing the device to be equally as effective in assessing knee health while requiring far less computational time and power than the previously published GCF approach.
Some limitations of this algorithm are the requirements for a certain number of flexion / extension cycles to generate the minimum number of data points to calculate the b-value. In this work, we used all five cycles of flexion / extension for calculation. Future work will focus on optimizing the required number of cycles and quantifying whether the b-value follows the same pattern for multiple measurements over the course of rehabilitation. Additionally, the measurements required the use of expensive electret microphones. In future studies, we will investigate less expensive contact microphones for detecting joint acoustical emissions. Finally, the development of b-value measurement algorithms on a microcontroller would facilitate the extraction of joint health in real-time with the system without the need for the full acoustical emission waveforms to be recorded or transmitted wireless. This could substantially reduce the power consumption and memory requirements for the system, and thereby enhance the potential for adoption by users for broad applicability in assisting the management of rehabilitation through sensor feedback.
ACKNOWLEDGMENT
This work was supported in part by the Defense Advanced Research Projects Agency, Arlington, VA under Contract No. W911NF-14-C-0058, and in part by the National Institutes of Health, National Institute of Biomedical Imaging and Bioengineering, Grant No. 1R01EB023808, as part of the NSF/NIH Smart and Connected Health Program.
REFERENCES
- [1].Gray H, Anatomy of the human body London, England: Bounty, 2012. [Google Scholar]
- [2].Majewski M, Susanne H, and Klaus S, “Epidemiology of athletic knee injuries: A 10-year study,” Knee, vol. 13, no. 3, pp. 184–8, June 2006. [DOI] [PubMed] [Google Scholar]
- [3].Braun HJ and Gold GE, “Diagnosis of osteoarthritis: imaging,” Bone, vol. 51, no. 2, pp. 278–88, August 2012. [DOI] [PMC free article] [PubMed] [Google Scholar]
- [4].Tehranzadeh J, Ashikyan O, and Dascalos J, “Magnetic resonance imaging in early detection of rheumatoid arthritis,” Semin Musculoskelet Radiol, vol. 7, no. 2, pp. 79–94, June 2003. [DOI] [PubMed] [Google Scholar]
- [5].Teague CN et al. , Novel Methods for Sensing Acoustical Emissions From the Knee for Wearable Joint Health Assessment, IEEE Trans Biomed Eng, vol. 63, no. 8, pp. 1581–90, August 2016. [DOI] [PubMed] [Google Scholar]
- [6].Toreyin H, Jeong HK, Hersek S, Teague CN, and Inan OT, “Quantifying the Consistency of Wearable Knee Acoustical Emission Measurements During Complex Motions,” IEEE J Biomed Health Inform, vol. 20, no. 5, pp. 1265–72, September 2016. [DOI] [PubMed] [Google Scholar]
- [7].Hersek S et al. , “Acoustical Emission Analysis by Unsupervised Graph Mining: A Novel Biomarker of Knee Health Status,” IEEE Trans Biomed Eng, vol. 65, no. 6, pp. 1291–1300, June 2018. [DOI] [PMC free article] [PubMed] [Google Scholar]
- [8].Jeong HK, Pouyan MB, Whittingslow DC, Ganti V, and Inan OT, “Quantifying the Effects of Increasing Mechanical Stress on Knee Acoustical Emissions Using Unsupervised Graph Mining,” IEEE Trans Neural Syst Rehabil Eng, vol. 26, no. 3, pp. 594–601, March 2018. [DOI] [PMC free article] [PubMed] [Google Scholar]
- [9].Rao MVMS and Prasanna Lakshmi KJ, “Analysis of b-value and improved b-value of acoustic emissions accompanying rock fracture,” Current Science, vol. 89, no. 9, pp. 1577–1582, 2005. [Google Scholar]
- [10].Gutenberg B and Richter CF, Seismicity of the earth and associated phenomena New York: Hafner Pub. Co., 1965, pp. ix, 310 p. [Google Scholar]
- [11].Shiotani T, Fujii K, Aoki T, and Amou K, “Evaluation of progressive failure using AE sources and improved b-value on slop model tests,” Prog. Acoust. Emission, vol. VII, pp. 529–534, 1994. [Google Scholar]
- [12].Shiotani T, Yuyama S, Li ZW, and Ohtsu M, “Applications of the AE improved b-value to qualitative evaluation of fracture process in concrete materials,” Journal of Acoustic Emission, vol. 19, pp. 118–132, 2001. [Google Scholar]
- [13].Boll S, Suppression of Acoustic Noise in Speech Using Spectral Subtraction, “IEEE Transactions on Acoustics, Speech, and Signal Processing, vol. ASSP-27, No. 2, 1979. [Google Scholar]
- [14].Sullivan GM and Feinn R, “Using Effect Size-or Why the P Value Is Not Enough, “J Grad Med Educ, vol. 4, no. 3, pp. 279–82, September 2012. [DOI] [PMC free article] [PubMed] [Google Scholar]