

Abstract
Nearly all exogenous loading models of bone adaptation apply dynamic loading superimposed upon a time invariant static preload (SPL) in order to ensure stable, reproducible loading of bone. Given that SPL may alter aspects of bone mechanotransduction (eg, interstitial fluid flow), we hypothesized that SPL inhibits bone formation induced by dynamic loading. As a first test of this hypothesis, we utilized a newly developed device that enables stable dynamic loading of the murine tibia with SPLs ≥ −0.01 N. We subjected the right tibias of BALB/c mice (4‐month‐old females) to dynamic loading (−3.8 N, 1 Hz, 50 cycles/day, 10 s rest) superimposed upon one of three SPLs: −1.5 N, −0.5 N, or −0.03 N. Mice underwent exogenous loading 3 days/week for 3 weeks. Metaphyseal trabecular bone adaptation (μCT) and midshaft cortical bone formation (dynamic histomorphometry) were assessed following euthanasia (day 22). Ipsilateral tibias of mice loaded with a −1.5‐N SPL demonstrated significantly less trabecular bone volume/total volume (BV/TV) than contralateral tibias (−12.9%). In contrast, the same dynamic loading superimposed on a −0.03‐N SPL significantly elevated BV/TV versus contralateral tibias (12.3%) and versus the ipsilateral tibias of the other SPL groups (−0.5 N: 46.3%, −1.5 N: 37.2%). At the midshaft, the periosteal bone formation rate (p.BFR) induced when dynamic loading was superimposed on −1.5‐N and −0.5‐N SPLs was significantly amplified in the −0.03‐N SPL group (>200%). These data demonstrate that bone anabolism induced by dynamic loading is markedly inhibited by SPL magnitudes commonly implemented in the literature (ie, −0.5 N, −1.5 N). The inhibitory impact of SPL has not been recognized in bone adaptation models and, as such, SPLs have been neither universally reported nor standardized. Our study therefore identifies a previously unrecognized, potent inhibitor of mechanoresponsiveness that has potentially confounded studies of bone adaptation and translation of insights from our field. © 2018 The Authors. JBMR Plus Published by Wiley Periodicals, Inc. on behalf of the American Society for Bone and Mineral Research.
Keywords: BONE FORMATION, DYNAMIC LOADING, INHIBITION, STATIC LOADING, TIBIA COMPRESSION
Introduction
The enhanced skeletal mass and morphology observed in athletes and other highly active individuals is thought to predominantly arise as a result of the skeleton's lifelong exposure to dynamic loading.1, 2, 3, 4 Numerous facets of dynamic loading have been associated with amplifying the anabolic benefit of skeletal loading in preclinical studies (eg, magnitude, rate, cycle number, frequency, rest intervals, etc.5, 6, 7, 8, 9). However, these insights have not led to effective exercise interventions that augment bone mass in adult humans.10, 11, 12
Regardless of field, there are numerous challenges in translating preclinical observations to successful human interventions. One strategy to overcome this challenge is to minimize disparities between preclinical models and humans.13, 14 In considering potential barriers in our field, one evident challenge is that the majority of in vivo mouse bone adaptation models use exogenous loading protocols that result in tissue strains that are substantially larger than those induced by gait. For example, the murine tibia axial compression model that has been used to extensively explore bone adaptation in response to skeletal loading possesses numerous strengths that have led to its broad adoption (eg, ability to study both trabecular and cortical bone adaptation, ease of implementing a highly reproducible strain environment15, 16). However, finite element analysis (FEA) models suggest that the end loading magnitude predominantly implemented to induce an anabolic trabecular response (−9 N) causes peak normal strains ranging from −2800 to −3300 μϵ at the tibia midshaft.16, 17 In contrast, locomotion in mice generates peak tibia midshaft normal strains that are less than 25% of the lower end of that range.18
To begin to address this barrier, we developed an in vivo loading device that we anticipated would reduce the exogenous loading magnitude required to induce a given peak strain magnitude in the tibia. The device modestly achieved this goal via induction of off‐axis compression, which caused increased tibia bending compared to the axial tibia compression device. Intriguingly, during calibration studies, we observed that our model required only an extremely small static preload (SPL) compared with previous in vivo models (Fig. 1). To our knowledge, nearly all in vivo exogenous skeletal loading models use SPL to ensure that each load cycle is reproducible during a loading intervention. Our review of tibia axial compression studies to date revealed that, with two exceptions,15, 19 SPL has varied from −0.5 N to over −2 N.
Figure 1.
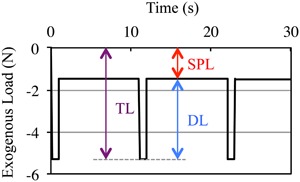
Schematic of DL superimposed on SPL. All in vivo exogenous bone loading models require SPL to ensure reproducible DL (where TL = DL + SPL). In this example, three load cycles of a −3.8‐N DL waveform (0.1 s to peak load, 0.8 s dwell at peak load, 0.1 s to baseline) with 10‐s rest inserted between each load cycle is superimposed on a −1.5‐N SPL. DL = dynamic loading; SPL = static preload; TL = total load.
Given that static stimuli may impair perception of primary signaling underlying bone mechanotransduction (eg, by reducing the potential for interstitial fluid flow20), we speculated that SPL may inhibit the anabolic response of bone to dynamic loading. We therefore exploited the unique ability of our new loading model to stably load the tibia with minimal SPL, and assessed trabecular and cortical bone responses to a −3.8‐N dynamic loading regimen superimposed upon a −1.5‐N, −0.5‐N, or −0.03‐N SPL. The literature suggested that a −3.8‐N dynamic loading regimen superimposed on a −1.5‐N SPL would not be anabolic.21
Materials and Methods
Off‐axis compression of the murine tibia
To load the tibia in off‐axis compression, the right foot is secured in a custom foot bed, with the knee and ankle joints aligned as at the time of peak ground reaction force (GRF) during free ambulation,22 and the loading tine (oriented 60 degrees from vertical) positioned to contact the distal femur (Fig. 2 A,B). The loading tine is coupled to a linear force actuator (AFX10‐200; Motran Industries, Ventura, CA, USA) in series with a force transducer (Model 31; Sensotec, Columbus, OH, USA), and open‐loop controlled via LabVIEW (National Instruments, Austin, TX, USA). Micrometer‐driven stages (433 series; Newport Corp., Irvine, CA, USA) are used to fine‐tune mouse and foot position relative to the loading tine in the x, y, and z directions. Once positioned, the loading tine axis is aligned to apply compressive force from proximal to anterior in the frontal plane and from medial to lateral in the sagittal plane, thereby achieving off‐axis compressive loading of the murine tibia. To confirm stable positioning, the distal femur is first quasi‐statically loaded to −0.5 N. If movement of the tibia is observed, positioning is adjusted and stability reconfirmed. Once stability is achieved, the loading tine is retracted (0 N) and the dynamic loading protocol is superimposed on the assigned SPL via LabVIEW software. The loading tine, foot bed, and mouse platform are each 3D printed from computer‐aided design (CAD) drawings (provided on request).
Figure 2.
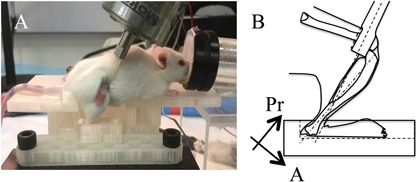
Off‐axis tibia compression device. (A) Loads are applied to the distal femur via a loading tine with the lower limb joint angles aligned as during walking and the foot secured in a custom foot‐bed. (B) Off‐axis loading is achieved as the compressive end loads are applied via a loading tine that is offset from posterior to anterior in the frontal plane and medial to lateral in the sagittal plane (ie, the loading tine is not aligned with the long axis of the tibia in neither anatomical plane). Pr = proximal A = anterior.
Calibration of the loading‐induced strain environment
We determined the strain distributions induced in the murine tibia by off‐axis compression via combined strain gauging, μCT imaging, and FEA.23 Briefly, a single element strain gauge (FLK‐1‐11; Tokyo Sokki Kenkyujo Co., Ltd., Tokyo, Japan) was attached to the medial periosteal midshaft surface (aligned with the tibia long axis) of female BALB/c mice (4 months old; n = 3), and the mouse positioned in the off‐axis loading device. We then assessed whether the coefficient of variation (CV) of peak gauge strains across loading cycles were influenced by the smallest SPL implemented in vivo in this study (−0.03 N), the most common SPL (−0.5 N), and an SPL that approximated the largest implemented in the axial compression model (−2.0 N). Each tibia was loaded over a range of loading magnitudes (−2 to −7 N, increments of −1 N) each superimposed upon each SPL (−0.03, −0.5, and −2.0 N). For each combination of variables, the applied forces and gauge strains were recorded for 10 consecutive, 1‐Hz load cycles (gauge data sampled at 500 Hz). To determine the induced strain environment, the tibias were then imaged by μCT (21‐μm voxel resolution), and images processed to develop voxel‐based finite element (FE) models (∼60,000 eight‐node brick elements). In order to determine the loading‐induced strain distributions throughout the tibia‐fibula structure, boundary conditions simulating the off‐axis force orientations were applied, isotropic bone material properties implemented (E = 19.7 GPa, ν = 0.324), and the FE model analyzed using the open‐source FE solver CalculiX (http://www.calculix.de 22). The strains simulated at the FE model nodes representing the strain gauge location were averaged and used to validate an FE model against the strains recorded at the gauge site. Upon validation, boundary conditions were applied to animal‐specific FE models (n = 3) in order to determine the peak longitudinal normal strains in the metaphyseal trabecular bone compartment, and in the cortical bone compartment at the tibia midshaft across a range of applied loads in off‐axis compression (−0.01 to −6 N).
In vivo experiment
We used BALB/c mice as their substantial basal trabecular bone volume/total volume (BV/TV) (eg, compared to C57BL/6 mice) enhanced our experimental resolution to detect varied extents of either anabolic or catabolic bone adaptation. For in vivo loading, female BALB/c mice (16 weeks; The Jackson Laboratory, Bar Harbor, ME, USA) were anesthetized (2% isoflurane) and were positioned in the off‐axis loader as described in the section titled “Off‐axis compression of the murine tibie”. The right tibias were then exogenously loaded with a −3.8‐N, 1‐Hz, 50‐cycle/day (10‐s rest between each load cycle) regimen 3 days/week (Monday, Wednesday, Friday) for 3 weeks (ie, 9 loading bouts/mouse). Each load cycle was implemented as a trapezoidal waveform with 0.1‐s linear rise to peak (0.025/s strain rate), 0.8‐s dwell at peak total load, 0.1‐s linear decline to baseline, and a 10‐s rest interval at baseline (ie, the specified SPL). Based on a power analysis of preliminary data, experiments were designed with n = 12 mice per group. Mice were randomly assigned to receive the −3.8‐N dynamic loading superimposed on an SPL of −1.5 N, −0.5 N, or −0.03 N. Dynamic load and SPL magnitudes were recorded throughout each loading bout. However, during the second week of the experiment, four mice in the −0.5‐N SPL group and two mice in the −0.03‐N SPL group accidently received an incorrect SPL (−1.5 N). These mice were euthanized and removed from the study when the error was recognized prior to the subsequent loading bout. This error resulted in final group sizes of n = 12, 8, and 10 mice for the −1.5‐N, −0.5‐N, and −0.03‐N SPL groups, respectively. All mice were calcein labeled (day 10, day 19; 10 mg/kg i.p.) and euthanized on day 22 (CO2 inhalation).
Using separate mice, we also assessed whether gait‐induced GRFs were altered following exogenous off‐axial loading of the tibia (female BALB/c, 16 weeks old, n = 4 for each SPL). GRFs were recorded on day 0 (prior to initiation of in vivo loading experiments) and on day 22 following nine bouts of dynamic loading (−3.8 N) superimposed upon one of three SPLs (ie, −1.5 N, −0.5 N, or −0.03 N). GRFs were assessed during free ambulation as each mouse repeatedly walked along an enclosed Plexiglas walkway (50 mm wide by 750 mm long) equipped with a miniature force plate (AMTI HE6X; Advanced Mechanical Technology, Inc., Watertown, MA, USA), centered in the walkway transit. Following acclimation to the testing apparatus, GRFs were collected from force plate contacts with the right hindpaw (ie, the experimental limb), and verified via a synchronized video capture system (Prosilica EC 650C high speed digital camera; Allied Vision, Exton, PA, USA). Trials were repeated until the right hindpaw made clear force plate contact three times per mouse. Force data were recorded at 200 Hz and video was captured at 30 Hz via customized LabVIEW software.
All mice were provided food and water ad libitum and housed five mice per cage in the specific‐pathogen‐free vivarium within the Harborview Research & Training Building (University of Washington [UW], Seattle, WA, USA). All experimental procedures were approved by the UW IACUC. No adverse events were noted in the experiments. All analyses were performed blinded to group identity.
Immediately following euthanasia, the metaphyseal trabecular compartment of the loaded ipsilateral and contralateral tibias were imaged by μCT (Scanco vivaCT40, 10.5 μm voxel, 55 kVp, 145 µA; Scanco Medical AG, Brüttisellen, Switzerland). The imaged region encompassed 2.23 mm of the proximal tibia, with image analysis performed on the 0.85 mm immediately distal to the growth plate.25 Raw μCT image data were preprocessed using a Gaussian Filter algorithm to remove image noise (Sigma = 1.2, Support = 2.0) followed by trabecular bone segmentation using a semiautomated contouring algorithm in which the endocortical shell of the proximal metaphysis was used to guide the total analysis volume.26 A μCT threshold of 490.5 mg hydroxyapatite (HA)/cm3 was used to quantify trabecular bone and provided optimal comparisons between 2D binarized images and the original grayscale images.27 We then determined total volume (TV), bone volume (BV), ratio (BV/TV), trabecular number (Tb.N), trabecular thickness (Tb.Th), and trabecular spacing (Tb.Sp) within the metaphyseal trabecular compartment per standard algorithms. As is standard, TV represented the endocortical volume within the metaphyseal region. The periosteal volume (Ps.Vol) and cortical bone volume (Ct.Vol) for the metaphyseal region were also quantified.
After μCT imaging, the right and left tibias were dissected, soft tissue removed, and cross‐sections (700 μm thick) spanning the midshaft were obtained. The sections were ground to 90 μm thickness and imaged (Zeiss Apotome.2 epifluorescent microscope; Zeiss, Inc., Thornwood, NY, USA). Images were blinded and analyzed using custom ImageJ‐based software (NIH, Bethesda, MD, USA; https://imagej.nih.gov/ij/) to quantify mineralizing surface (MS/BS), mineral apposition rate (MAR), and bone formation rates (BFRs) at the endocortical (e.) and periosteal (p.) surfaces.28
Statistical analysis
All statistical analysis was performed in R (R Foundation for Statistical Computing, Vienna, Austria; https://www.r-project.org/). For calibration data, Feltz and Miller's asymptotic test29 was implemented to test for the equivalence of the coefficients of variation of induced strains across load cycles in order to access whether the stability of dynamic loading was influenced by SPL. In the in vivo experiments, ANOVA (with Tukey honest significant difference [HSD] post hoc tests) was used to assess whether SPLs and/or dynamic loads were significantly different across groups. Follow‐up equivalence testing was performed to confirm that the applied dynamic loads were equivalent across in vivo groups.30 Because in vivo outcomes data residuals (eg, BV/TV, BFR) were not normally distributed (via a Kolmogorov‐Smirnov test), we implemented nonparametric statistics for assessment of bone adaptation. As such, we used Kruskal‐Wallis tests with Mann‐Whitney follow‐ups to determine whether outcome measures (eg, BV/TV, periosteal BFR [p.BFR]) were significantly increased across groups and used Wilcoxon rank‐sum tests to contrast outcomes in loaded versus contralateral bones. GRF alterations across time (day 0, day 22) and interactions with applied SPL were assessed via a nonparametric equivalent of the repeated measures ANOVA.31, 32 For all tests, p ≤ 0.05 was considered statistically significant.
Results
The CV of induced strains did not significantly differ across the implemented SPLs (Fig. 3). The normal strains recorded at the gauge site, and peak tensile and compressive strains estimated in the trabecular and cortical compartment (via FEA) revealed a heterogenous normal strain environment (Fig. 4 A, B). For the −3.8‐N load implemented in vivo, peak longitudinal normal strains of −2490 ± 260 μϵ were induced at the tibia midshaft and −1600 ± 110 μϵ in metaphyseal trabecular bone (Fig. 4 C). As quantified during in vivo loading, and as designed, SPL magnitude was significantly different across experimental groups (p < 0.01), whereas dynamic loading magnitude was statistically equivalent across experimental groups (p ≤ 0.01; Table 1). GRFs recorded at day 0 and day 22 in the experimental limb during gait were not differentially influenced across the SPL groups. Specifically, although GRF significantly declined between day 0 and day 22 (p < 0.05), the main effect of SPL and the interaction between days and SPL were not significantly different (p ≥ 0.5; Supporting Table 1).
Figure 3.
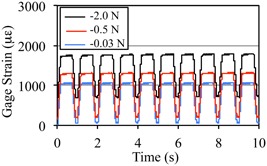
SPL magnitude did not alter stability of dynamic loading‐induced strains across load cycles. Gauge site normal strains recorded over 10 consecutive cycles of dynamic off‐axis tibia compression loading for −2.0‐N, −0.5‐N, and −0.03‐N SPL. Strain magnitude reflects the combination of dynamic loading and SPL and was 1740 μϵ (±8.0), 1280 (±8.4) and 1030 (±9.2) for −2.0‐N, −0.5‐N, and −0.03‐N SPL groups, respectively, across the 10 load cycles. The coefficient of variation of peak strain across load cycles of dynamic loading were 1.45%, 2.08%, and 2.83% for the −2.0‐N, −0.5‐N, and −0.03‐N SPL groups and were not significantly altered by the SPL applied (p = 0.15).
Figure 4.
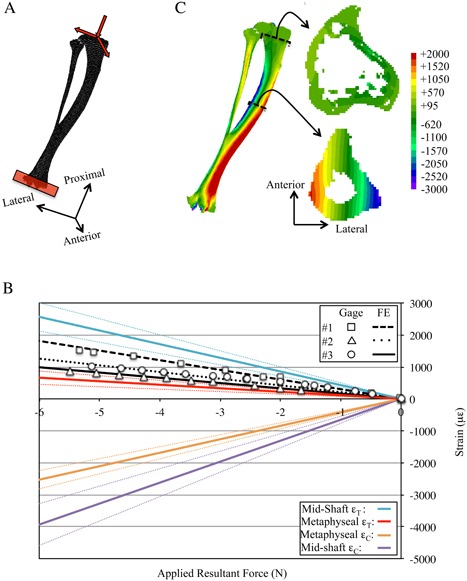
Calibration of normal strain environment induced when the murine tibia and fibula are loaded in off‐axis compression. (A) The FE models (BCs noted) were developed from μCT images and analyzed to determine strain distributions induced by the off‐axis compression device. (B) FE model predictions of longitudinal normal strains were calibrated against strain gauge data (mouse #1) and the derived BCs were applied to animal‐specific FE models to predict strain gauge data in remaining specimens (mouse #2 and mouse #3). Upon calibration (rms error = 16.9%), the animal‐specific FE models were used to determine the peak tension (ϵT) and compression (ϵC) longitudinal normal strains induced at the cortical midshaft and for metaphyseal trabecular bone (dotted lines indicate 95% confidence intervals). (C) Exemplary strain distributions induced in the tibia‐fibula structure, at the metaphyseal trabecular and midshaft cortical bone sections by −3.8 N dynamic loading. BC = boundary condition; rms = root mean squared.
Table 1.
SPL and Dynamic Loading Magnitudes Recorded in the In Vivo Groups
| Recorded force (N) | ||
|---|---|---|
| SPL group | SPL | Dynamic |
| –1.5 N | –1.59 ± 0.02 b , c | –3.79 ± 0.02 |
| –0.5 N | –0.54 ± 0.01 a , c | –3.80 ± 0.03 |
| –0.03 N | –0.03 ± 0.001 a , b | –3.82 ± 0.02 |
Values are mean ± SE.
p < 0.05 versus –1.5 N.
p < 0.05 versus –0.5 N.
p < 0.05 versus –0.03 N.
Metaphyseal trabecular morphology of contralateral bones did not differ across SPL groups (p ≥ 0.11). Metaphyseal endocortical TV was significantly expanded in the dynamically loaded tibias of the −1.5‐N SPL group versus contralateral tibias (4.6%, p < 0.05), but was not altered in other SPL groups (Fig. 5 A). Trabecular BV in the −1.5‐N SPL group was reduced in the dynamically loaded versus contralateral tibias (−9.2%, p < 0.05). In contrast, BV was significantly elevated when the same loading regimen was superimposed on a −0.03‐N SPL (15.4% versus contralateral, 40.9% versus −0.5‐N SPL, both p < 0.05; Fig. 5 B). As a result, the significant reduction of BV/TV observed in tibias exposed to dynamic loading superimposed on the −1.5‐N SPL group (−12.9% versus contralateral; p < 0.05) was reversed to an anabolic response when SPL was minimized to −0.03 N (12.3% versus contralateral, 46.3% versus −0.5‐N SPL and 37.2% versus −1.5‐N SPL‐loaded tibias, all p < 0.05, Fig. 5 C). The enhanced BV/TV in the −0.3‐N SPL group (versus contralateral) was associated with increased Tb.Th versus both larger SPLs (Table 2). In the metaphyseal region, total periosteal volume of the cortical shell was not altered in experimental versus contralateral bones, whereas cortical bone volume was significantly decreased in experimental versus contralateral bones in the −1.5‐N SPL group (Table 2).
Figure 5.
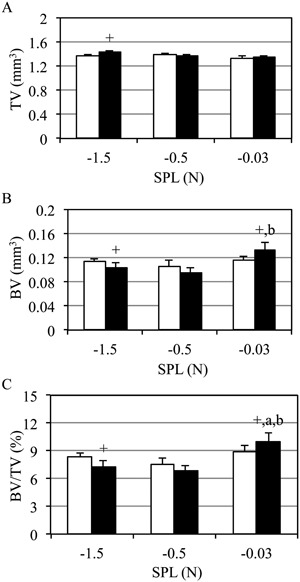
Trabecular BV/TV was enhanced by dynamic loading only when superimposed on a −0.03‐N SPL. Mean +SE contralateral (white) and experimentally loaded (black) tibia metaphyseal trabecular morphology. Metaphyseal endocortical TV was elevated for the largest SPL versus contralateral tibias (−1.5 N; A), but not other SPL groups. Trabecular BV was diminished in the context of −1.5‐N SPL, but was significantly enhanced when SPL was minimized (−0.03 N; B). As a result, a loading regimen that was catabolic for trabecular BV/TV when combined with a −1.5‐N SPL, was anabolic when combined with the −0.03‐N SPL (C); p < 0.05 versus −1.5 N (a), versus −0.5 N (b), versus contralateral (+).
Table 2.
Trabecular and Cortical Shell Morphology at the Metaphyseal Compartment in Contralateral (C) and Experimentally Loaded Bone (X)
| SPL | Loading | Tb.N (mm–1) | Tb.Th (mm) | Tb.Sp (mm) | Ps.Vol (mm3) | Ct.Vol (mm3) | Ec.Vol (mm3) |
|---|---|---|---|---|---|---|---|
| –1.5 N | C | 2.7 ± 0.1 | 0.052 ± 0.001 | 0.38 ± 0.01 | 2.46 ± 0.03 | 0.89 ± 0.01 | 1.37 ± 0.02 |
| X | 2.9 ± 0.1 + | 0.048 ± 0.001 + | 0.36 ± 0.01 + | 2.52 ± 0.03 | 0.86 ± 0.01 + | 1.43 ± 0.03 + | |
| –0.5 N | C | 2.7 ± 0.1 | 0.051 ± 0.001 | 0.39 ± 0.01 | 2.48 ± 0.03 | 0.87 ± 0.02 | 1.39 ± 0.02 |
| X | 2.7 ± 0.1 | 0.049 ± 0.001 | 0.37 ± 0.01 | 2.43 ± 0.04 | 0.83 ± 0.02 | 1.38 ± 0.02 | |
| –0.03 N | C | 2.9 ± 0.1 | 0.052 ± 0.001 | 0.35 ± 0.01 | 2.44 ± 0.05 | 0.91 ± 0.02 | 1.31 ± 0.04 |
| X | 3.1 ± 0.2 + | 0.053 ± 0.001 a , b | 0.33 ± 0.02 + | 2.45 ± 0.04 | 0.90 ± 0.02 b | 1.34 ± 0.03 a |
Values are mean ± SE.
C = contralateral; X = experimental; Ps.Vol = periosteal volume; Ct.Vol = cortical volume; Ec.Vol = endocortical volume.
p < 0.05 for experimental versus contralateral.
p < 0.05 versus –1.5 N.
p < 0.05 versus –0.5 N.
Periosteal midshaft osteoblast activity in contralateral tibias was not altered by SPL (p > 0.5). In dynamically loaded tibias, periosteal MAR (p.MAR) was significantly enhanced in both the −1.5‐N and −0.03‐N SPL groups (87% and 157% versus contralateral tibias, respectively; p < 0.05; Fig. 6 A). Similarly, periosteal MS/BS (p.MS/BS) was significantly elevated in all SPL groups versus contralateral tibias (by 93%, 78%, and 248%, respectively; p < 0.05; Fig 6 B). However, loading superimposed on a −0.03‐N SPL significantly enhanced p.MS/BS versus both the −1.5‐N (113%, p < 0.05) and −0.5‐N SPL groups (130%, p < 0.05). Likewise, the significant increase in p.BFR observed in the −1.5‐N and −0.5‐N SPL groups versus contralateral tibias (p < 0.05) was significantly amplified when SPL was reduced to −0.03 N (253% and 223% versus −1.5‐N and −0.5‐N SPL, respectively, both p < 0.05; Fig 6 C). The most osteogenic intervention (−0.03 N SPL) was characterized by a focal lamellar bone formation on the periosteal surface (Supporting Fig. 1). Woven bone formation was not observed on any bone surface of any mouse in the study.
Figure 6.
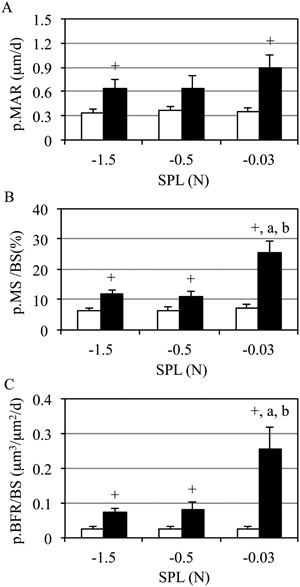
Midshaft periosteal bone formation was enhanced by minimizing SPL. Mean + SE contralateral (white) and experimentally loaded (black) tibia cortical bone formation. Dynamic loading enhanced p.MAR (A), p.MS (B), and p.BFR versus contralateral tibias (C), regardless of SPL magnitude. Minimizing SPL significantly enhanced p.MS and p.BFR versus both −0.5‐N and −1.5‐N SPL (C); p < 0.05 versus −1.5 N (a), versus −0.5 N (b), versus contralateral (+).
Endocortical osteoblast activity did not vary in the contralateral tibias (p ≥ 0.5). However, endocortical MAR (e.MAR) was significantly reduced in the dynamic loaded −1.5‐N SPL group (−43% versus contralateral tibias, p < 0.05). As well, endocortical MS/BS (e.MS/BS) (−41%) and endocortical BFR/BS (e.BFR/BS) (−61%) were both significantly reduced in the loaded tibias of the −1.5‐N SPL versus contralateral tibias (both p < 0.05). Endocortical osteoblast activity was not significantly altered by dynamic loading in either the −0.5‐N or −0.03‐N SPL groups (Table 3).
Table 3.
Midshaft Endocortical Bone Formation in the Contralateral (C) and Experimentally Loaded Bone (X)
| e.MAR (µm/day) | e.MS/BS (%) | e.BFR/BS (µm3/µm2/day) | ||||
|---|---|---|---|---|---|---|
| SPL | C | X | C | X | C | X |
| –1.5 N | 0.48 ± 0.1 | 0.27 ± 0.1 + , a | 11.4 ± 2.3 | 6.8 ± 1.7 + , a | 0.07 ± 0.03 | 0.03 ± 0.01 + , a |
| –0.5 N | 0.48 ± 0.1 | 0.43 ± 0.1 | 8.1 ± 2.8 | 10.8 ± 3.0 | 0.05 ± 0.04 | 0.06 ± 0.02 |
| –0.03 N | 0.52 ± 0.1 | 0.52 ± 0.1 | 13.3 ± 3.3 | 15.3 ± 2.6 | 0.10 ± 0.02 | 0.10 ± 0.03 |
Values are mean ± SE.
C = contralateral; X = experimental.
p < 0.05 for experimental versus contralateral.
p < 0.05 versus –0.03 N.
Discussion
Consistent with the literature, a −3.8‐N loading regimen generating peak dynamic trabecular normal strains of 1600 μϵ did not enhance trabecular bone morphology in the presence of either a −1.5‐N or −0.5‐N SPL. However, superimposing the identical loading regimen on a −0.03‐N SPL significantly elevated trabecular BV/TV compared to contralateral tibias. As well, periosteal bone formation at the midshaft by the loading regimen superimposed on −1.5‐N or −0.5‐N SPLs was significantly amplified when SPL was reduced to −0.03 N. To our knowledge, there are no previous reports identifying SPL as a potential confounding variable in exploring how dynamic mechanical loading influences bone cell function, yet it is present in nearly all in vivo models of long‐bone exogenous loading and is most often not even reported. Thus, our data identify a previously unrecognized inhibitor of dynamic loading‐induced bone anabolism that, given its near ubiquitous presence, is likely to have unintentionally confounded interpretation of preclinical skeletal adaptation studies.
We view our off‐axis tibia compression model as an incremental advance in the in vivo application of loading to the mouse skeleton.15, 33, 34 Its design draws directly upon the axial tibia compression device.15, 18 Contrasting our calibration data with strains induced by axial tibia compression indicates that the required exogenous load magnitude to achieve a given cortical peak strain is reduced by 37% in our model, whereas induced trabecular peak strains are 3% greater in axial compression than off‐axis compression for a given load magnitude.16, 35
A potentially unique feature of our device is that it is capable of applying high‐fidelity dynamic loading interventions using SPL magnitudes as small as −0.01 N. We believe that this minimal SPL (approximately 10% of peak GRFs during free ambulation) could be further reduced if our device were to be coupled with a high‐fidelity closed‐loop controller. In contrast, −0.2 N (ie, 2× gait‐induced GRF and 20× our device minimum) is the smallest SPL ever reported for the axial tibia compression device.15, 19 Our lowest‐magnitude SPL (−0.03 N) was only 6% of the most commonly implemented SPL in axial tibia compression studies (−0.5 N36, 37, 38). Qualitatively, we believe that our device achieves stable dynamic loading with minimal SPL because it places (and loads) the lower limb in an anatomical orientation as during gait. In contrast, the axial tibia compression device requires increased knee flexion (<35 degrees15, 18) versus our device (∼60 degrees). Although increased knee flexion appears to have required larger SPL to maintain limb stability, device modifications (eg, deeper fixtures) may also permit the axial compression device to stably load the tibia with smaller SPL. Finally, although we report calibration data showing that stable dynamic loading is possible with minimal SPL in our device, we have since confirmed that this observation is independent of waveform shape (eg, haversine, triangular) and/or frequency (data not shown).
We performed a combined strain gauge and FEA calibration to characterize the exogenous normal strain distribution induced by the off‐axis device. The midshaft normal strain environment confirmed that the tibia was placed in compression and bending by the device. The orientation of the neutral axis ran from the anterior to posterior cortex and was rotated approximately 25 degrees from that induced by axial tibia compression,16 and nearly 40 degrees from that estimated for running activity in BALB/c mice (Supporting Fig. 2). This normal strain distribution arose as the complex curvature of the tibia was subject to bending about multiple axes. Metaphyseal trabeculae were exposed primarily to compressive boundary conditions and were therefore exposed to smaller normal strain magnitudes compared to the cortical midshaft.
Our calibration of the midshaft normal strain distribution emphasized that strains on the medial periosteal surface alone (the primary site of calibration strain gauge attachment15, 39, 40, 41) vary profoundly (for our device at −3.8 N dynamic load, between 2000 μϵ and −100 μϵ). Experimentally, peak strain magnitude estimates are used as a means of equilibrating loading‐induced stimuli across variables that would alter tissue deformations (eg, age, sex, genotype). However, given the profound magnitude gradient in this region, our data reinforce that attempting to equilibrate a given loading intervention across study variables via single strain gauge recordings is inaccurate and likely to substantially underestimate the maximum normal strains induced by the loading intervention. Despite recent identification of this concern,35 review of the axial tibia compression literature demonstrates that this potential problem continues to be overlooked in many studies. For example, a recent study described using a −9‐N loading regimen to induce 1200 μϵ normal strain on the tibia midshaft of female 10‐week‐old C57 mice.42 Although this strain value reflects tension on the portion of the medial midshaft cortex where the strain gauge is attached, it vastly underestimates peak strains induced by the protocol, which FEA models predict would reach −3300 μϵ.16, 17 Relevant to our study, we have estimated that a −9‐N dynamic load would induce peak tibia midshaft compressive strains >4000 μϵ in 16‐week‐old female BALB/c mice, whereas caged BALB/c mice are unlikely to generate normal strains that exceed −660 μϵ (Supporting Fig. 2).
The axial tibia compression literature provides a rich set of data to consider the impact of varied SPLs given the numerous combinations of loading magnitude and SPL magnitude that have been implemented. In general, the greater the magnitude of reported SPL, the greater the magnitude of loading that has been implemented in studies designed to induce an anabolic trabecular response. For example, the two studies prior to 2008 that did implement smaller SPL (−0.2 N) required less dynamic load magnitude to induce a profound anabolic trabecular response (>+10% BV/TV) than later studies using larger SPLs.15, 19 Placed in the context of our data, the inhibitory influence of large SPLs (eg, −2 N) may underlie why very large dynamic loading magnitudes (approximately −16 N) have been used to induce substantial trabecular bone anabolism.43, 44 The rationale for using SPLs much larger than those used in the initial axial compression studies has not been addressed.
Given the near ubiquitous presence of SPL in exogenous skeletal loading models, 6, 33, 34, 45, 46, 47 but lack of reporting and/or standardization (including by our own group), we believe this variable may have unintentionally confounded experimental outcomes and interpretation in the bone adaptation literature. This type of unrecognized bias has been highlighted as problematic by NIH's own rigor and reproducibility initiative (https://www.nih.gov/research-training/rigor-reproducibility). We therefore believe that the potential impact of our observation extends beyond a technical issue with a particular in vivo model. First, the presence of an unintended inhibitor of bone mechanoresponsiveness in studies exploring bone adaptation to skeletal loading is likely to have confounded both broad interpretations (eg, the effect of aging on bone's response to loading) and to have biased assessment of the mechanisms underlying any perceived response (eg, mitigation of expected anabolism in a KO mouse). Second, to an unknown extent, SPL of the human lower limb occurs in a gravitational environment (eg, standing). Although speculative at this time, it is therefore possible that SPL has also confounded attempts to use exercise as a means of enhancing bone mass and morphology in humans.
We do not currently have experimental data that directly support a specific biophysical mechanism by which SPL inhibits bone anabolism. However, the literature suggests a number of candidates. A recent study demonstrated that a −2‐N SPL, by itself, only modestly alters bone cell function (no cortical changes, no change in trabecular BV/TV48), which suggests that the inhibitory mechanism of SPL is more likely associated with impairing early mechanotransduction. In this context, it is likely that SPL creates a pressurized state that minimizes the transient fluid flow that is normally induced by dynamic loading in the absence of SPL.20, 49, 50, 51 Further, secondary aspects of altered fluid flow, such as hypoxia, are also known to mediate bone cell function.52, 53, 54 Alternatively (or additionally), application of SPL prior to the initiation of dynamic loading (as occurs during in vivo studies) could lead to inadvertent cellular stimulation (eg, Ca2+ oscillations), which may cause desensitization of and impair critical aspects of cellular signaling (eg, repeated Ca2+ oscillations) to subsequent superimposed dynamic loading.55, 56, 57 We believe that in vivo studies hold potential to clarify which of these pathways are most promising. For example, the literature suggests that redistribution of fluids following SPL onset (and reestablishment of the naive bone fluid state upon removal of SPL) would occur at faster timescales compared to the time course of cellular desensitization and subsequent recovery of sensitivity.55, 58, 59, 60 If so, experiments designed to vary when SPL is initiated and removed prior to imposition of dynamic load could provide initial insights into whether physical (ie, fluid flow) and/or biochemical mechanisms (eg, Ca2+ fluctuations) are promising candidates. At that point, complimentary experimental (eg, tracer transport, in situ Ca2+ oscillations61, 62) and computational modeling studies (eg, of fluid flow dynamics63) could be utilized to further clarify the mechanisms underlying the inhibitory impacts of SPL on dynamic loading‐induced bone anabolism.
Our observations should be placed in context of the study limitations and the current lack of clarity regarding the mechanism(s) by which SPL inhibits the anabolic response of bone to loading. Although these results represent the first published data with our device, the inclusion of a −3.8‐N dynamic loading regimen superimposed on −1.5‐N SPL was intended as a negative control based on the axial tibia compression literature, which suggested that this intervention would not be anabolic for trabecular bone.18, 21, 64 At this time, we do not know whether loads smaller than −3.8 N will be osteogenic in this model. When we designed this study, we considered a variety of potential strategies, but chose to control dynamic loading magnitude across protocols primarily because dynamic loading has long been considered a primary stimulus for bone anabolism. This choice did result in varying total load across groups (ie, maintaining constant dynamic loading [DL] amplitude while increasing the magnitude of SPL). However, if total load [TL] influenced adaptation in our study, we would anticipate observing the largest anabolic response with the greatest SPL (and thus the greatest TL). Instead, we found that the group with the greatest TL showed a reduced response to loading (including a catabolic trabecular response). Further, our data have not yet delineated a critical SPL magnitude threshold where inhibition begins, whether that threshold is dependent upon the magnitude/type of dynamic loading, or whether that relation is linear or nonlinear. Finally, we did not directly assess trabecular osteoblast function in this study because the label intervals were selected for cortical bone, not trabecular bone dynamics.
In conclusion, data from our study demonstrate that when SPL is sufficiently minimized, it is possible to enhance cortical and trabecular bone formation with a dynamic loading intervention that is otherwise ineffective when superimposed on SPLs that are currently implemented with the field standard trabecular adaptation model. This observation was serendipitously enabled by our new off‐axis tibia loading device that is capable of applying stable dynamic loading to the tibia with SPLs as small as −0.01 N. We anticipate that future studies exploring the mechanism underlying SPL inhibition of dynamic loading‐induced bone formation may hold potential to identify new strategies that may transform otherwise ineffective skeletal loading into a potent stimulus for enhanced bone morphology.
Disclosures
All authors state that they have no conflicts of interest.
Supporting information
Supporting Data S1.
Acknowledgments
This study was funded, in part, by the National Institute of Arthritis and Musculoskeletal and Skin Diseases (NIAMS: AR072783 to SS; AR066710 to EMG; AR064735 to TSG), the Zimmer Fracture Biology Professorship (to SDB), and the Sigvard T Hansen, Jr. Endowed Chair (to TSG).
Authors’ roles: Study design: SS, DS, PH, BJA, EMG, SDB, and TSG. Study conduct: SS and PH. Data collection: PH and SS. Data analysis: SS and TSG. Data interpretation: SS, BJA, EMG, SDB, and TSG. Drafting manuscript: SS and TSG. Revising manuscript content: SS, BJA, EMG, SDB, and TSG. Approving final version of manuscript: All authors. SS takes responsibility for data analysis integrity.
References
- 1. Kannus P, Haapasalo H, Sankelo M, et al. Effect of starting age of physical activity on bone mass in the dominant arm of tennis and squash players. Ann Intern Med. 1995;123 (1):27–31. [DOI] [PubMed] [Google Scholar]
- 2. Karlsson MK, Nordqvist A, Karlsson C. Physical activity increases bone mass during growth. Food Nutr Res. 2008;52. DOI:10.3402/fnr.v52i0.1871. Available from: https://foodandnutritionresearch.net/index.php/fnr/article/view/1138. [DOI] [PMC free article] [PubMed]
- 3. Detter F, Rosengren BE, Dencker M, Lorentzon M, Nilsson JA, Karlsson MK. A 6‐year exercise program improves skeletal traits without affecting fracture risk: a prospective controlled study in 2621 children. J Bone Miner Res. 2014;29 (6):1325–36. [DOI] [PubMed] [Google Scholar]
- 4. Warden SJ, Mantila Roosa SM, Kersh ME, et al. Physical activity when young provides lifelong benefits to cortical bone size and strength in men. Proc Natl Acad Sci U S A. 2014;111(14):5337–42. [DOI] [PMC free article] [PubMed] [Google Scholar]
- 5. Rubin CT, Lanyon LE. Regulation of bone formation by applied dynamic loads. J Bone Joint Surg Am. 1984;66 (3):397–402. [PubMed] [Google Scholar]
- 6. Rubin CT, Lanyon LE. Regulation of bone mass by mechanical strain magnitude. Calcif Tissue Int. 1985;37 (4):411–7. [DOI] [PubMed] [Google Scholar]
- 7. Mosley JR, Lanyon LE. Strain rate as a controlling influence on adaptive modeling in response to dynamic loading of the ulna in growing male rats. Bone. 1998;23 (4):313–8. [DOI] [PubMed] [Google Scholar]
- 8. Rubin C, Turner AS, Bain S, Mallinckrodt C, McLeod K. Anabolism. Low mechanical signals strengthen long bones. Nature. 2001; 412 (6847):603–4. [DOI] [PubMed] [Google Scholar]
- 9. Srinivasan S, Weimer DA, Agans SC, Bain SD, Gross TS. Low‐magnitude mechanical loading becomes osteogenic when rest is inserted between each load cycle. J Bone Miner Res. 2002;17 (9):1613–20. [DOI] [PMC free article] [PubMed] [Google Scholar]
- 10. Forwood MR, Burr DB. Physical activity and bone mass: exercises in futility? Bone Miner. 1993;21 (2):89–112. [DOI] [PubMed] [Google Scholar]
- 11. Nikander R, Sievanen H, Heinonen A, Daly RM, Uusi‐Rasi K, Kannus P. Targeted exercise against osteoporosis: a systematic review and meta‐analysis for optimising bone strength throughout life. BMC Med. 2010;8:47. [DOI] [PMC free article] [PubMed] [Google Scholar]
- 12. Hughes JM, Charkoudian N, Barnes JN, Morgan BJ. Revisiting the debate: does exercise build strong bones in the mature and senescent skeleton? Front Physiol. 2016;7:369. [DOI] [PMC free article] [PubMed] [Google Scholar]
- 13. Ioannidis JP. Why most published research findings are false. PLoS Med. 2005;2 (8):e124. [DOI] [PMC free article] [PubMed] [Google Scholar]
- 14. van der Worp HB, Howells DW, Sena ES, et al. Can animal models of disease reliably inform human studies? PLoS Med. 2010;7(3):e1000245. [DOI] [PMC free article] [PubMed] [Google Scholar]
- 15. Fritton JC, Myers ER, Wright TM, van der Meulen MC. Loading induces site‐specific increases in mineral content assessed by microcomputed tomography of the mouse tibia. Bone. 2005;36(6):1030–8. [DOI] [PubMed] [Google Scholar]
- 16. Patel TK, Brodt MD, Silva MJ. Experimental and finite element analysis of strains induced by axial tibial compression in young‐adult and old female C57Bl/6 mice. J Biomech. 2014; 47 (2):451–7. [DOI] [PMC free article] [PubMed] [Google Scholar]
- 17. Moustafa A, Sugiyama T, Prasad J, et al. Mechanical loading‐related changes in osteocyte sclerostin expression in mice are more closely associated with the subsequent osteogenic response than the peak strains engendered. Osteoporos Int. 2012;23 (4):1225–34. [DOI] [PMC free article] [PubMed] [Google Scholar]
- 18. De Souza RL, Matsuura M, Eckstein F, Rawlinson SC, Lanyon LE, Pitsillides AA. Non‐invasive axial loading of mouse tibiae increases cortical bone formation and modifies trabecular organization: a new model to study cortical and cancellous compartments in a single loaded element. Bone. 2005;37 (6):810–8. [DOI] [PubMed] [Google Scholar]
- 19. Fritton JC, Myers ER, Wright TM, van der Meulen MC. Bone mass is preserved and cancellous architecture altered due to cyclic loading of the mouse tibia after orchidectomy. J Bone Miner Res. 2008;23(5):663–71. [DOI] [PMC free article] [PubMed] [Google Scholar]
- 20. Fritton SP, Weinbaum S. Fluid and solute transport in bone: flow‐induced mechanotransduction. Annu Rev Fluid Mech. 2009;41:347–74. [DOI] [PMC free article] [PubMed] [Google Scholar]
- 21. Lynch ME, Main RP, Xu Q, et al. Tibial compression is anabolic in the adult mouse skeleton despite reduced responsiveness with aging. Bone. 2011;49(3):439–46. [DOI] [PMC free article] [PubMed] [Google Scholar]
- 22. Prasad J, Wiater BP, Nork SE, Bain SD, Gross TS. Characterizing gait induced normal strains in a murine tibia cortical bone defect model. J Biomech. 2010;43 (14):2765–70. [DOI] [PubMed] [Google Scholar]
- 23. Srinivasan S, Ausk BJ, Poliachik SL, Warner SE, Richardson TS, Gross TS. Rest‐inserted loading rapidly amplifies the response of bone to small increases in strain and load cycles. J Appl Physiol. 2007;102 (5):1945–52. [DOI] [PubMed] [Google Scholar]
- 24. Willinghamm MD, Brodt MD, Lee KL, Stephens AL, Ye J, Silva MJ. Age‐related changes in bone structure and strength in female and male BALB/c mice. Calcif Tissue Int. 2010;86 (6):470–83. [DOI] [PMC free article] [PubMed] [Google Scholar]
- 25. Ausk BJ, Huber P, Srinivasan S, et al. Metaphyseal and diaphyseal bone loss in the tibia following transient muscle paralysis are spatiotemporally distinct resorption events. Bone. 2013;57 (2):413–22. [DOI] [PMC free article] [PubMed] [Google Scholar]
- 26. Poliachik SL, Bain SD, Threet D, Huber P, Gross TS. Transient muscle paralysis disrupts bone homeostasis by rapid degradation of bone morphology. Bone. 2010;46 (1):18–23. [DOI] [PMC free article] [PubMed] [Google Scholar]
- 27. Bouxsein ML, Boyd SK, Christiansen BA, Guldberg RE, Jepsen KJ, Muller R. Guidelines for assessment of bone microstructure in rodents using micro‐computed tomography. J Bone Miner Res. 2010;25 (7):1468–86. [DOI] [PubMed] [Google Scholar]
- 28. Srinivasan S, Ausk BJ, Bain SD, Gardiner EM, Kwon RY, Gross TS. Rest intervals reduce the number of loading bouts required to enhance bone formation. Med Sci Sports Exerc. 2015;47 (5):1095–103. [DOI] [PMC free article] [PubMed] [Google Scholar]
- 29. Feltz CJ, Miller GE. An asymptotic test for the equality of coefficients of variation from k populations. Stat Med. 1996;15 (6):646–58. [DOI] [PubMed] [Google Scholar]
- 30. Hoffelder T, Gossl R, Wellek S. Multivariate equivalence tests for use in pharmaceutical development. J Biopharm Stat. 2015;25 (3):417–37. [DOI] [PubMed] [Google Scholar]
- 31. Brunner E, Domhof S, Langer F. Nonparametric analysis of longitudinal data in factorial experiments. New York: Wiley; 2002. [Google Scholar]
- 32. Noguchi K, Gel YR, Brunner E, Konietschke F. nparLD: An R software package for the nonparametric analysis of longitudinal data in factorial experiments. J Stat Softw. 2012;50 (12):1–23. 25317082 [Google Scholar]
- 33. Gross TS, Srinivasan S, Liu CC, Clemens TL, Bain SD. Noninvasive loading of the murine tibia: an in vivo model for the study of mechanotransduction. J Bone Miner Res. 2002;17 (3):493–501. [DOI] [PMC free article] [PubMed] [Google Scholar]
- 34. Lee KC, Maxwell A, Lanyon LE. Validation of a technique for studying functional adaptation of the mouse ulna in response to mechanical loading. Bone. 2002;31 (3):407–12. [DOI] [PubMed] [Google Scholar]
- 35. Yang H, Butz KD, Duffy D, Niebur GL, Nauman EA, Main RP. Characterization of cancellous and cortical bone strain in the in vivo mouse tibial loading model using microCT‐based finite element analysis. Bone. 2014;66:131–9. [DOI] [PubMed] [Google Scholar]
- 36. Sugiyama T, Meakin LB, Galea GL, Lanyon LE, Price JS. The cyclooxygenase‐2 selective inhibitor NS‐398 does not influence trabecular or cortical bone gain resulting from repeated mechanical loading in female mice. Osteoporos Int. 2013;24 (1):383–8. [DOI] [PMC free article] [PubMed] [Google Scholar]
- 37. Meakin LB, Galea GL, Sugiyama T, Lanyon LE, Price JS. Age‐related impairment of bones' adaptive response to loading in mice is associated with sex‐related deficiencies in osteoblasts but no change in osteocytes. J Bone Miner Res. 2014;29 (8):1859–71. [DOI] [PMC free article] [PubMed] [Google Scholar]
- 38. Sun D, Brodt MD, Zannit HM, Holguin N, Silva MJ. Evaluation of loading parameters for murine axial tibial loading: Stimulating cortical bone formation while reducing loading duration. J Orthop Res. 2018;36 (2):682–91. [DOI] [PMC free article] [PubMed] [Google Scholar]
- 39. Weatherholt AM, Fuchs RK, Warden SJ. Cortical and trabecular bone adaptation to incremental load magnitudes using the mouse tibial axial compression loading model. Bone. 2013;52 (1):372–9. [DOI] [PMC free article] [PubMed] [Google Scholar]
- 40. Melville KM, Kelly NH, Surita G, et al. Effects of deletion of ERalpha in osteoblast‐lineage cells on bone mass and adaptation to mechanical loading differ in female and male mice. J Bone Miner Res. 2015;30 (8):1468–80. [DOI] [PMC free article] [PubMed] [Google Scholar]
- 41. Bonnet N, Brun J, Rousseau JC, Duong LT, Ferrari SL. Cathepsin K controls cortical bone formation by degrading periostin. J Bone Miner Res. 2017;32 (7):1432–41. [DOI] [PubMed] [Google Scholar]
- 42. Morse A, Schindeler A, McDonald MM, Kneissel M, Kramer I, Little DG. Sclerostin antibody augments the anabolic bone formation response in a mouse model of mechanical tibial loading. J Bone Miner Res. 2018;33:486–98. DOI: 10.1002/jbmr.3330 [DOI] [PubMed] [Google Scholar]
- 43. Saxon LK, Jackson BF, Sugiyama T, Lanyon LE, Price JS. Analysis of multiple bone responses to graded strains above functional levels, and to disuse, in mice in vivo show that the human Lrp5 G171V High Bone Mass mutation increases the osteogenic response to loading but that lack of Lrp5 activity reduces it. Bone. 2011;49 (2):184–93. [DOI] [PMC free article] [PubMed] [Google Scholar]
- 44. Sinnesael M, Laurent MR, Jardi F, et al. Androgens inhibit the osteogenic response to mechanical loading in adult male mice. Endocrinology. 2015;156 (4):1343–53. [DOI] [PubMed] [Google Scholar]
- 45. Turner CH, Akhter MP, Raab DM, Kimmel DB, Recker RR. A noninvasive, in vivo model for studying strain adaptive bone modeling. Bone. 1991;12 (2):73–9. [DOI] [PubMed] [Google Scholar]
- 46. Torrance AG, Mosley JR, Suswillo RF, Lanyon LE. Noninvasive loading of the rat ulna in vivo induces a strain‐related modeling response uncomplicated by trauma or periostal pressure. Calcif Tissue Int. 1994;54 (3):241–7. [DOI] [PubMed] [Google Scholar]
- 47. Rubin C, Gross T, Qin YX, Fritton S, Guilak F, McLeod K. Differentiation of the bone‐tissue remodeling response to axial and torsional loading in the turkey ulna. J Bone Joint Surg Am. 1996;78 (10):1523–33. [DOI] [PubMed] [Google Scholar]
- 48. Sugiyama T, Price JS, Lanyon LE. Functional adaptation to mechanical loading in both cortical and cancellous bone is controlled locally and is confined to the loaded bones. Bone. 2010;46 (2):314–21. [DOI] [PMC free article] [PubMed] [Google Scholar]
- 49. Gooch KJ, Tennant CJ. Mechanical forces: their effects on cells and tissues. Berlin: Springer‐Verlag Berlin Heidelberg; 1997. [Google Scholar]
- 50. Garner E, Lakes R, Lee T, Swan C, Brand R. Viscoelastic dissipation in compact bone: implications for stress‐induced fluid flow in bone. J Biomech Eng. 2000;122 (2):166–72. [DOI] [PubMed] [Google Scholar]
- 51. Yao H. Cartilage mechanobiology In: Nagatomi J, editor. Mechanobiology handbook. Boca Raton, FL: CRC Press; 2011. p. 229–52. [Google Scholar]
- 52. Dodd JS, Raleigh JA, Gross TS. Osteocyte hypoxia: a novel mechanotransduction pathway. Am J Physiol. 1999;277 (3 Pt 1):C598–602. [DOI] [PubMed] [Google Scholar]
- 53. Akeno N, Czyzyk‐Krzeska MF, Gross TS, Clemens TL. Hypoxia induces vascular endothelial growth factor gene transcription in human osteoblast‐like cells through the hypoxia‐inducible factor‐2alpha. Endocrinology. 2001;142 (2):959–62. [DOI] [PubMed] [Google Scholar]
- 54. Arnett TR, Gibbons DC, Utting JC, et al. Hypoxia is a major stimulator of osteoclast formation and bone resorption. J Cell Physiol. 2003;196 (1):2–8. [DOI] [PubMed] [Google Scholar]
- 55. Donahue SW, Donahue HJ, Jacobs CR. Osteoblastic cells have refractory periods for fluid‐flow‐induced intracellular calcium oscillations for short bouts of flow and display multiple low‐magnitude oscillations during long‐term flow. J Biomech. 2003;36 (1):35–43. [DOI] [PubMed] [Google Scholar]
- 56. Kim TJ, Sun J, Lu S, Qi YX, Wang Y. Prolonged mechanical stretch initiates intracellular calcium oscillations in human mesenchymal stem cells. PLoS One. 2014;9 (10):e109378. [DOI] [PMC free article] [PubMed] [Google Scholar]
- 57. Madden RM, Han SK, Herzog W. The effect of compressive loading magnitude on in situ chondrocyte calcium signaling. Biomech Model Mechanobiol. 2015;. 14 (1):135–42. [DOI] [PMC free article] [PubMed] [Google Scholar]
- 58. Zeng Y, Cowin SC, Weinbaum S. A fiber matrix model for fluid flow and streaming potentials in the canaliculi of an osteon. Ann Biomed Eng. 1994;22(3):280–92. [DOI] [PubMed] [Google Scholar]
- 59. Pereira AF, Shefelbine SJ. The influence of load repetition in bone mechanotransduction using poroelastic finite‐element models: the impact of permeability. Biomech Model Mechanobiol. 2014;13 (1):215–25. [DOI] [PubMed] [Google Scholar]
- 60. Srinivasan S, Gross TS. Canalicular fluid flow induced by bending of a long bone. Med Eng Phys. 2000;22 (2):127–33. [DOI] [PubMed] [Google Scholar]
- 61. Price C, Zhou X, Li W, Wang L. Real‐time measurement of solute transport within the lacunar‐canalicular system of mechanically loaded bone: direct evidence for load‐induced fluid flow. J Bone Miner Res. 2011;26 (2):277–85. [DOI] [PMC free article] [PubMed] [Google Scholar]
- 62. Jing D, Baik AD, Lu XL, et al. In situ intracellular calcium oscillations in osteocytes in intact mouse long bones under dynamic mechanical loading. FASEB J. 2014;28 (4):1582–92. [DOI] [PMC free article] [PubMed] [Google Scholar]
- 63. Fan L, Pei S, Lucas Lu X, Wang L. A multiscale 3D finite element analysis of fluid/solute transport in mechanically loaded bone. Bone Res. 2016;4:16032. [DOI] [PMC free article] [PubMed] [Google Scholar]
- 64. Berman AG, Clauser CA, Wunderlin C, Hammond MA, Wallace JM. Structural and mechanical improvements to bone are strain dependent with axial compression of the tibia in female C57BL/6 mice. PLoS One. 2015;10 (6):e0130504. [DOI] [PMC free article] [PubMed] [Google Scholar]
Associated Data
This section collects any data citations, data availability statements, or supplementary materials included in this article.
Supplementary Materials
Supporting Data S1.