

Abstract
PURPOSE:
To measure the change of peripapillary retinal vessel density (VD) in eyes with a history of acute primary angle-closure glaucoma (PACG).
DESIGN:
Case-control study.
METHODS:
Twenty-one consecutive Chinese patients with history of unilateral acute PACG were enrolled. Eyes with acute PACG constituted the case group, while the contralateral eyes without attack constituted the control. All patients underwent ophthalmic examinations including best-corrected visual acuity, intraocular pressure, and visual field (VF). Spectral-domain optical coherence tomography (SD-OCT) was used to obtain both structural OCT and OCT angiography (OCTA). Structural OCT scans provided thickness measurements of the peripapillary retinal nerve fiber layer (RNFL) and macular ganglion cell complex (GCC). OCTA was used to measure all-plexus peripapillary retinal VD.
RESULTS:
In unaffected eyes, a dense microvascular network surrounded the disc on all-plexus retinal OCTA. The vascular network was visibly attenuated and focal capillary dropout was evident in acute PACG eyes. The peripapillary VD in acute PACG eyes was 66.6% ± 17.3% (mean ± standard deviation), which was significantly (P < .01) reduced compared to 87.2% ± 8.6% in the unaffected eyes. In acute PACG eyes, peripapillary retinal VD was positively correlated with RNFL and GCC thicknesses (P < .001 each) and negatively correlated with VF mean deviation (P = .002) and cup-to-disc ratio (P = .0064). In unaffected eyes, there were no correlations between peripapillary retinal VD and glaucoma-related parameters.
CONCLUSIONS:
In acute PACG eyes, peripapillary retinal VD decreased significantly compared with the contralateral unaffected eyes. Peripapillary retinal VD was significantly correlated with other glaucomatous changes.
PRIMARY ANGLE-CLOSURE GLAUCOMA (PACG), ESPEcially acute PACG, is a significant cause of blindness.1 It is estimated that the number of people with PACG worldwide will increase to 23.4 million in 2020, 76.7% of whom will be Asian.2 PACG accounted for bilateral irreversible blindness in 3.9 million people in 2010, and this number is predicted to reach approximately 5.3 million worldwide by 2020.
The mechanism of optic neuropathy in PACG is not fully understood. The 2 principal mechanisms of glaucomatous optic neuropathy and vision loss are mechanical compression and vascular insufficiency.3,4 It is generally accepted that mechanical compression is the main mechanism of PACG, especially acute PACG.4 Ganglion cells and associated axons undergo apoptosis after extremely high intraocular pressure (IOP).4 However, previous studies have paid little attention to the vascular factors in PACG. These factors play a significant role in the development of damage in primary open-angle glaucoma (POAG),3,5–10 especially in normal tension glaucoma (NTG).11,12 Vascular factors may be involved in the pathogenesis of PACG and need further exploration.
The microcirculation of the optic nerve head (ONH) can be observed and quantitatively analyzed with several technologies.13–15 A recent innovation, optical coherence tomography angiography (OCTA), can quantify the retinal and disc microcirculation in a rapid and accurate way.16–18 It is noninvasive, requiring no injection of any exogenous dye, and provides quantitative analysis of perfusion down to the capillary level. With this technology, several studies of POAG eyes showed that the microvascular network around the disc was globally and focally attenuated and the peripapillary vessel density (VD) was reduced.16,18 Further, in POAG eyes, the peripapillary flow index and the VD are highly correlated with visual field (VF) pattern standard.16 However, there has been no evaluation by OCTA of peripapillary vessel density and its correlation with other glaucomatous damage in PACG eyes.
In this study, we used OCTA to observe the peripapillary microvascular network in a group of acute PACG eyes. We also quantified the peripapillary retinal VD and explored the possible correlation between disc perfusion, neural structure, and visual field loss.
METHODS
PATIENTS:
This was a case-control study. Twenty-one consecutive Chinese patients with a history of unilateral acute PACG, who visited the ophthalmology department of Peking Union Medical College Hospital from April 1, 2015 to July 8, 2015, were enrolled. The inclusion criteria were as follows: (1) 1 eye of each patient had a history of acute angle-closure attack and corresponding glaucomatous optic neuropathy, while the other eye was unaffected; (2) acute angle-closure attack, defined by the presence of at least 2 symptoms (such as ocular pain and nausea/vomiting), elevated IOP (>21 mm Hg), and at least 3 findings from the clinical examination (eg, corneal edema, peripheral anterior chamber depth equal to or less than one quarter of the peripheral corneal thickness, gonioscopic confirmation of angle closure, etc)19; (3) glaucomatous optic neuropathy, defined as loss of the neuroretinal rim with compatible reproducible VF loss; and (4) the unaffected eye had no symptoms or signs of acute angle-closure attack, glaucomatous optic neuropathy, or reproducible visual field loss. The exclusion criteria were as follows: (1) secondary angle closure, such as glaucoma associated with lens dislocation; (2) evidence of any kind of retina disease; (3) history of previous intraocular surgery that was not concerned with glaucoma (except cataract surgery); (4) any eye with obvious refractive media opacity that might affect imaging quality; and (5) the patient was not cooperative and could not complete the examination. The eyes with a history of acute PACG comprised the case group, while the contralateral unaffected eyes served as the control group.
The study was approved by the institutional review board of Peking Union Medical College Hospital. All patients provided written informed consent.
EXAMINATIONS:
All patients enrolled underwent thorough ophthalmic examinations including best-corrected visual acuity (BCVA, measured by Snellen chart), IOP measurement, slit-lamp examination, fundus examination, and gonioscopy. IOP was measured by Goldmann applanation tonometry. Gonioscopy was performed with a Goldmann 2-mirror lens at high magnification (×16) by glaucoma specialists. Visual field examinations were performed with the Octopus 101 Perimeter (Haag-Streit, Inc, Koeniz, Switzerland) tG2 program with Tendency Oriented Perimetry strategy. The retinal nerve fiber layer (RNFL), ganglion cell complex (GCC) thickness, and vertical cup-to-disc ratio (VCDR) were assessed with spectral-domain optical coherence tomography (SD-OCT, RTVue-XR Avanti; Optovue, Inc, Fremont, California, USA). Treatment information was recorded.
OPTICAL COHERENCE TOMOGRAPHY DATA ACQUISITION AND PROCESSING:
OCTA was performed on all participants by a single experienced technician. The scans were obtained using the AngioVue software SD-OCT system RTVue-XR Avanti (software version 2.0.5.39). This system has an A-scan repetition rate of 70 kHz, wavelength of 840 nm, and depth resolution of 5 μm in tissue. Both eyes of each patient were examined without pupil dilation during the same visit. Each raster scan volume consisted of 216 line-scan locations at 5 consecutive B-scans. With a B-scan frame rate of 270 frames per second, each scan was acquired in 3.5 seconds. Two scan volumes with a 4.5 × 4.5-mm scanning area centered on the optic disc were captured for each patient (1 vertical priority and 1 horizontal priority raster). The merged 3-dimensional OCT angiograms were produced using the Angiovue software and then exported for all-plexus peripapillary retinal VD measurement using custom software at the Casey Eye Institute. The all-plexus inner retina was defined as the layers between the internal limiting membrane (ILM) and the outer plexiform layer (OPL). VD was defined as the percentage area occupied by the large vessels and microvasculature in the peripapillary region. Other processes were achieved using the embedded software (version 2.0.5.39).
STATISTICAL ANALYSIS:
All data were described using means, medians, or percentages as appropriate. The Shapiro-Wilk test was used to evaluate the normal distribution of continuous variables. Paired t tests and sign tests were used to observe the significance of differences between the acute PACG eyes and the contralateral eyes. Pearson correlation was used to evaluate single correlations between normally distributed variables. Spearman rank correlation test was used to evaluate single correlations between variables with non-normal distributions.
In addition, mixed-effects models were used to assess the correlation between peripapillary retinal VD and individual glaucomatous damage measurements with stratification based on PACG status and adjustment for age and IOP. The significance level was set at a 2-sided P < .05. All analyses were run using Stata 12.0 (StataCorp, LLC, College Station, Texas, USA).
RESULTS
BASELINE CLINICAL CHARACTERISTICS:
Out of 21 patients, 6 were excluded because of poor OCTA quality (signal strength index lower than 60 in either eye). Thus, 15 patients with unilateral acute PACG were included in the analysis (Table 1). Thirteen were female and 2 were male, with a mean age of 67.8 years (range, 54–78 years). Among the acute PACG eyes, 2 were receiving 1 glaucoma medication. Travoprost, once daily at bedtime, was used in 1 case, while brinzolamide, 3 times daily, was used in the other case. Among the unaffected eyes, 1 was receiving pilocarpine twice daily. The duration of medication use was 1–3 years. Among acute PACG eyes, 11 had undergone phacoemulsification surgery and 6 had undergone trabeculectomy. Among unaffected eyes, 2 had undergone phacoemulsification surgery. All acute PACG–affected and unaffected eyes had previously undergone laser peripheral iridotomy. The time interval between previous documented acute episodes and enrollment in this research ranged from 7 days to 12 years. The time interval in acute PACG eyes between phacoemulsification surgery and examination in this research ranged from 7 days to 2 years.
TABLE 1.
Participant Characteristics
| Variable | PACG Eyes (N = 15) |
Contralateral Eyes (N = 15) |
P |
|---|---|---|---|
| Glaucoma eye drops, n (%) eyes | 2(13.3) | 1 (6.7) | |
| Phacoemulsification surgery, n (%)eyes | 11 (73.3) | 2 (13.3) | |
| Trabeculectomy, n (%)eyes | 6(40) | 0 | |
| Median BCVA | 20/40 | 20/20 | .002a |
| Intraocular pressure, mm Hg | 15.2 (5.2) | 16.2 (2.4) | .4982 |
| Visual field mean deviation, dB | 14.2 (6.5) | 2.8 (2.5) | <.0001 |
| RNFL thickness, μm | 71.4 (21.3) | 100.1 (13.5) | .0002 |
| GCC thickness, μm | 78.1 (13.9) | 96.3 (11.3) | .0006 |
| VCDR | 0.8 (0.2) | 0.5 (0.2) | .0002 |
BCVA = best-corrected visual acuity; GCC = ganglion cell complex; PACG = primary angle-closure glaucoma; RNFL = retinal nerve fiber layer; VCDR = vertical cup-to-disc ratio.
Unless otherwise indicated, data are given as the mean (population SD), and Student t tests were used.
Wilcoxon signed ranks test was applied.
The median BCVA was 20/40 in acute PACG eyes and 20/20 in the unaffected eyes (P = .002, Table 1). There was no significant difference in IOP between PACG eyes and unaffected eyes. The mean deviation (MD) of visual field testing was higher in acute PACG eyes than in unaffected eyes (P < .0001, Table 1). The affected eyes had a thinner RNFL (P = .0002) and GCC (P = 0.0006), and larger VCDR (P = .0002), when compared with the unaffected eyes (Table 1).
COMPARISON OF PERIPAPILLARY RETINAL ANGIOGRAMS:
The peripapillary microcirculation of the all-plexus inner retina included the peripapillary retinal circulation, superficial inner retina vessels, and deep inner retina vessels (Figure 1). In the en face pattern, a thick microcapillary network around the disc was visible in the unaffected eyes. However, in the PACG eyes the microcirculation of the inner retina was visibly attenuated compared with the contralateral unaffected eyes (Figure 1). The decrease in the generalized inner retina perfusion associated with the structural thinning of the inner retina was apparent on cross-sectional angiograms of acute PACG eyes when compared with the contralateral unaffected eye (Figure 1). The outer retina (between the OPL and Bruch membrane) is avascular. In unilateral acute PACG patients, a series of correlated peripapillary pathologic changes were evident when compared with the contralateral unaffected eyes. These changes included enlarged cupping, attenuated peripapillary microcapillaries, and thinning of the RNFL (Figure 1).
FIGURE 1.
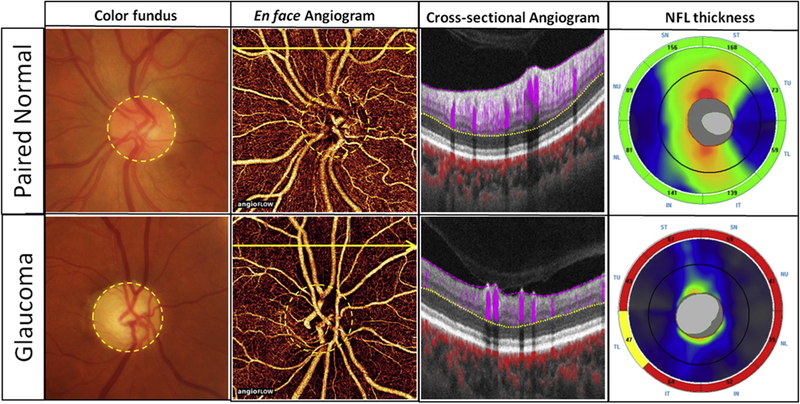
A series of correlated peripapillary pathologic changes were present in acute primary angle-closure glaucoma (PACG) eyes when compared with the contralateral unaffected eyes. The left eye (Top row) of this patient is the unaffected eye and the right eye (Bottom row) is the acute PACG eye. Color fundus photographs: The acute PACG eye had enlarged cup-to-disc ratio. En face angiograms (4.5 × 4.5 mm): En face image of the all-plexus peripapillary retinal circulation. The all-plexus inner retina was defined as the layers between the internal limiting membrane (shown in pink dashed line) and the outer plexiform layer (shown in yellow dashed line). In the acute PACG eye, the peripapillary capillary network was obviously attenuated. Cross-sectional angiograms: Cross-sectional optical coherence tomography angiography (OCTA) was taken at the position of the yellow arrow on the en face OCTA. Blood flow signal of the inner retina (between the pink dashed line and the yellow dashed line) is shown in purple. Blood flow signal of the choroid is shown in red. There was obvious reduction of both flow signals and thicknesses in the retinal nerve fiber layer (RNFL) in the acute PACG eye when compared with the contralateral unaffected eye. RNFL thickness: Peripapillary RNFL thickness decreased significantly in acute PACG eye compared to the contralateral normal eye.
PERIPAPILLARY OPTICAL COHERENCE TOMOGRAPHY ANGIOGRAPHIC MEASUREMENTS AND CORRELATION WITH CONVENTIONAL DIAGNOSTIC PARAMETERS:
The peripapillary retinal VD in acute PACG eyes was 66.6% 6 17.3% (mean ± standard deviation), which was significantly reduced compared to 87.2% 6 8.6% in the unaffected eyes (P < .01, Figure 2).
FIGURE 2.
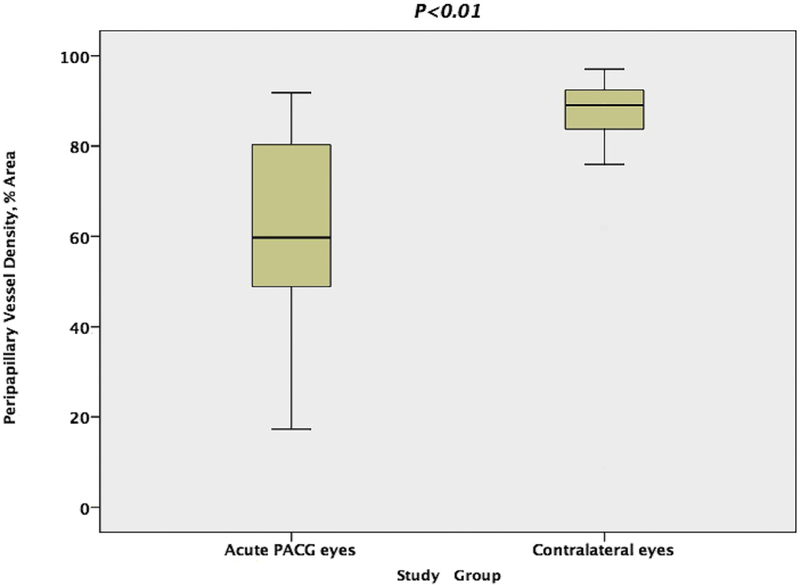
Comparison of peripapillary retinal vessel density in the acute primary angle-closure glaucoma (PACG) eyes and the contralateral eyes. The Mann-Whitney test showed a significant reduction in peripapillary retinal vessel density in acute PACG eyes compared with contralateral eyes.
In the acute PACG eyes, Pearson correlation analysis showed that the peripapillary retinal VD was negatively correlated with VF MD (Figure 3) and positively correlated with the RNFL thickness (Figure 3) and GCC thickness (Table 2). The VF MD was negatively correlated with mean RNFL thickness and GCC thickness (both P = .0004, Table 2).
FIGURE 3.
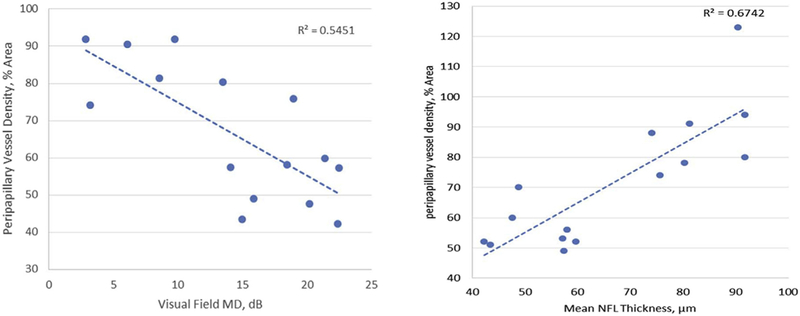
Correlations of peripapillary vessel density with visual field and nerve fiber layer thickness in acute primary angle-closure glaucoma (PACG) eyes. Simple linear regression showed a negative correlation of peripapillary vessel density with the visual field mean deviation (MD) and a positive correlation with the mean retinal nerve fiber layer (RNFL) thickness in acute PACG eyes.
TABLE 2.
Pearson Correlation for Primary Angle-Closure Glaucoma Eyes (N = 15)
| Variable | Peripapillary Vessel Density |
Visual Field Mean Deviation |
|---|---|---|
| VF MD | r = −0.738, P = .0017 | |
| Mean RNFL thickness | r = 0.821, P = .0002 | r = −0.80, P = .0004 |
| Mean GCC thickness | r = 0.843, P < .0001 | r = −0.79, P = .0004 |
GCC = ganglion cell complex; RNFL = retinal nerve fiber layer; VF MD = visual field mean deviation.
In the mixed-effects models (Table 3), when controlling for age and IOP, the peripapillary retinal VD was positively correlated with RNFL and GCC thicknesses (both P < .0001) and negatively correlated with VF MD (P = .0002) and cup-to-disc ratio (P = .0013). It was not correlated with these parameters in the unaffected eyes.
TABLE 3.
Mixed-Effect Model Analysis of Peripapillary Vessel Density
| Variable (Unit) | Peripapillary Vessel Densitya |
|
|---|---|---|
| PACG Eyes (N = 15) | Contralateral Eyes (N = 15) | |
| Visual field mean deviation (dB) | −2.2 (−3.1, −1.3), P = .0002 | −0.2 (−2.5, 2.1), P = .84 |
| Mean RNFL thickness (μm) | 0.7 (0.5,1.0), P < .0001 | 0.2 (−0.2, 0.5), P = .40 |
| Mean GCC thickness (μm) | 1.2 (0.8, 1.5), P < .0001 | 0.2 (−0.3, 0.5), P = .56 |
| Cup-to-disc ratio (0.1) | −7.2 (−12.6, −1.8), P = .0013 | −0.3 (−4.8, 4.2), P = .90 |
GCC = ganglion cell complex; PACG = primary angle-closure glaucoma; RNFL = retinal nerve fiber layer.
The mixed-effect models have the peripapillary vessel density (unit: % area) as the independent variable. The dependent variables include age, intraocular pressure, and the listed variables. Results were adjusted for age and intraocular pressure.
Slope coefficient (95% confidence interval), P value.
DISCUSSION
OCTA IS ESPECIALLY USEFUL IN STUDYING THE PERIPAPILlary microcirculation,17,18 and we used it to investigate the retinal microvasculature of acute PACG. Numerous methods have been used to measure ONH perfusion, but each has limitations. Fluorescein angiography is an invasive method with limited use in glaucoma research.13 Laser Doppler flowmetry20 and laser speckle flowgraphy21 mainly image the microvascular vessels in the superficial layer of the retina. Doppler OCT is not sensitive enough to measure accurately the low velocities of small vessels that make up the disc microcirculation.22 In contrast, OCTA can show more details of the peripapillary capillaries and can construct en face images of the layered micro-vascular structures.18
The flow signal in OCTA comes from the motion of blood cells, and we processed the OCTA images to measure vessel area density. Loss of VD in PACG eyes reflects the loss of capillaries with active flow and may be a measure of reduced perfusion.
We chose a group of patients who had previously had a severe acute PACG attack in 1 eye while the other eye was unaffected. Unilateral acute PACG patients are valuable and clinically available subjects to investigate correlations between vascular abnormalities and other glaucomatous changes. Studying PACG patients has some unique advantages over POAG patients. First, in acute PACG, pathogenic changes, including RNFL and GCC thinning, VF defects, and increased cup-to-disc ratios, are usually more intense and typical than in POAG.19,23 Extreme cases can provide more information in the exploration of vascular factors in glaucoma. Second, although patients with acute PACG have bilateral anatomic abnormalities, acute attacks usually happen in only 1 eye, while the other eye remains unaffected. This naturally occurring internal control is extremely valuable because it eliminates factors such as age, sex, and systemic vascular diseases that could interfere with the conclusions about the vascular factors that are present in the pathologic processes of POAG.3,24,25
We found that the peripapillary microcirculation was extensively damaged after an acute primary angle-closure attack. Vascular factors in PACG eyes, especially in acute PACG eyes, have received little attention in previous studies. In our study, we focused on acute PACG eyes and found that decreases in peripapillary microcirculation could be detected after IOP was controlled and kept stable for years. Singh and associates noticed this phenomenon in a case report.26 In that case, the patient had asymmetric angle-closure glaucoma, and the blood flow in the ophthalmic artery of the afflicted eye was diminished more than in the fellow eye. We further demonstrated by OCTA that there was an extensive decrease in VD in the peripapillary microvascular system of the acute PACG eyes, and these changes were similar to those reported for POAG eyes in previous studies.16,18
By univariate analysis, we found that the VD was negatively correlated with the VF MD and positively correlated with the thickness of the RNFL and GCC. We then used mixed-effects models to eliminate potential correlations between the 2 eyes of the same subjects based on certain variables. After we eliminated age and IOP as potentially confounding variables, the analysis still showed that the decrease in peripapillary VD as significantly correlated with VF loss, thinning of the RNFL and GCC, and cup-to-disc ratio in the acute PACG eyes. These findings are similar to those in studies of POAG eyes where the peripapillary microcirculation was highly correlated with VF pattern standard.18,27–29 In contrast with the PACG eyes in our study, there were no correlations between peripapillary retinal VD and other glaucoma parameters in the unaffected eyes. This indicated that loss of peripapillary retinal VD is associated with acute PACG.
Our study has some limitations. First, the sample size is relatively small. Twenty-one unilateral acute PACG patients were enrolled, and the image quality of 6 patients did not meet the requirement for quantitative analysis. Thus, data from only 15 patients were available for analysis. Second, the acute PACG–affected eyes and contralateral unaffected eyes had dissimilar treatment histories. Some acute PACG eyes underwent lens extraction surgeries, but most unaffected eyes did not. Further study is needed to understand the influence of lens extraction on peripapillary VD. Third, we could not determine the time sequence for the development of peripapillary microcirculation abnormalities or other glaucomatous changes such as RNFL thinning. The sequence of events is very important to understanding the significance of vascular factors in the pathogenesis of glaucoma.29,30 Further studies are needed to provide information on the natural pathologic evolution of this disease.
In conclusion, extensive decreases in the peripapillary microcirculation density were found in eyes affected with acute PACG. The decreases were significantly correlated with other glaucomatous changes, including increases in VF MD and thinning of the RNFL and GCC.
Acknowledgments:
The authors are very grateful to other participants in this study. We thank Dou Zhihui (Chinese Center of Disease Control and Prevention, Beijing, China) and Wang Yang (Beijing, China) for their assistance with statistics. We also acknowledge the contributions of Dr Juan Chi and Dr Bo Wan, who took great effort in performing the examinations (Peking Union Medical College Hospital, Beijing, China).
FUNDING/SUPPORT: NIH GRANTS R01 EY023285, P30 EY010572, OREGON HEALTH & SCIENCE UNIVERSITY (OHSU) FOUNDATION, NSFC (Grant No. 61471226), an unrestricted grant from Research to Prevent Blindness (New York, NY) and the Champalimaud Foundation. The sponsor or funding organization had no role in the design or conduct of this research. Financial Disclosures: OHSU, Yali Jia, and David Huang have financial interest in Optovue, Inc, a company that may have a commercial interest in the results of this research and technology. These potential conflicts of interest have been reviewed and managed by OHSU. The following authors have no financial disclosures: Shunhua Zhang, Chan Wu, Liang Liu, Yao Zhang, Yang Zhang, Hua Zhang, and Yong Zhong. All authors attest that they meet the current ICMJE criteria for authorship.
REFERENCES
- 1.Bourne RR, Stevens GA, White RA, et al. Causes of vision loss worldwide, 1990–2010: a systematic analysis. Lancet Glob Health 2013;1(6):e339–e349. [DOI] [PubMed] [Google Scholar]
- 2.Tham YC, Li X, Wong TY, Quigley HA, Aung T, Cheng CY. Global prevalence of glaucoma and projections of glaucoma burden through 2040: a systematic review and meta-analysis. Ophthalmology 2014;121(11):2081–2090. [DOI] [PubMed] [Google Scholar]
- 3.Yanagi M, Kawasaki R, Wang JJ, Wong TY, Crowston J, Kiuchi Y. Vascular risk factors in glaucoma: a review. Clin Exp Ophthalmol 2011;39(3):252–258. [DOI] [PubMed] [Google Scholar]
- 4.Nongpiur ME, Ku JY, Aung T. Angle closure glaucoma: a mechanistic review. Curr Opin Ophthalmol 2011;22(2):96–101. [DOI] [PubMed] [Google Scholar]
- 5.Costa VP, Harris A, Anderson D, et al. Ocular perfusion pressure in glaucoma. Acta Ophthalmol 2014;92(4):e252–e266. [DOI] [PubMed] [Google Scholar]
- 6.Caprioli J, Coleman AL. Blood pressure, perfusion pressure, and glaucoma. Am J Ophthalmol 2010;149(5):704–712. [DOI] [PubMed] [Google Scholar]
- 7.Leske MC. Ocular perfusion pressure and glaucoma: clinical trial and epidemiologic findings. Curr Opin Ophthalmol 2009;20(2):73–78. [DOI] [PMC free article] [PubMed] [Google Scholar]
- 8.Tobe LA, Harris A, Hussain RM, et al. The role of retrobulbar and retinal circulation on optic nerve head and retinal nerve fibre layer structure in patients with open-angle glaucoma over an 18-month period. Br J Ophthalmol 2015;99(5): 609–612. [DOI] [PubMed] [Google Scholar]
- 9.Kanakamedala P, Harris A, Siesky B, et al. Optic nerve head morphology in glaucoma patients of African descent is strongly correlated to retinal blood flow. Br J Ophthalmol 2014;98(11):1551–1554. [DOI] [PMC free article] [PubMed] [Google Scholar]
- 10.Venkataraman ST, Flanagan JG, Hudson C. Vascular reactivity of optic nerve head and retinal blood vessels in glau- coma-a review. Microcirculation 2010;17(7):568–581. [DOI] [PubMed] [Google Scholar]
- 11.Kobayashi W, Kunikata H, Omodaka K, et al. Correlation of optic nerve microcirculation with papillomacular bundle structure in treatment naive normal tension glaucoma. J Ophthalmol 2014;2014:468908. [DOI] [PMC free article] [PubMed] [Google Scholar]
- 12.Samsudin A, Isaacs N, Tai ML, Ramli N, Mimiwati Z, Choo MM. Ocular perfusion pressure and ophthalmic artery flow in patients with normal tension glaucoma. BMC Ophthalmol 2016;16:39. [DOI] [PMC free article] [PubMed] [Google Scholar]
- 13.Tuulonen A, Nagin P, Schwartz B, Wu DC. Increase of pallor and fluorescein-filling defects of the optic disc in the follow-up of ocular hypertensives measured by computerized image analysis. Ophthalmology 1987;94(5): 558–563. [DOI] [PubMed] [Google Scholar]
- 14.Aizawa N, Kunikata H, Shiga Y, Yokoyama Y, Omodaka K, Nakazawa T. Correlation between structure/function and optic disc microcirculation in myopic glaucoma, measured with laser speckle flowgraphy. BMC Ophthalmol 2014;14(9):113. [DOI] [PMC free article] [PubMed] [Google Scholar]
- 15.Xu J, Han S, Balaratnasingam C, et al. Retinal angiography with real-time speckle variance optical coherence tomography. Br J Ophthalmol 2015;99(10):1315–1319. [DOI] [PubMed] [Google Scholar]
- 16.Liu L, Jia Y, Takusagawa HL, et al. Optical coherence tomography angiography of the peripapillary retina in glaucoma. JAMA Ophthalmol 2015;133(9):1045–1052. [DOI] [PMC free article] [PubMed] [Google Scholar]
- 17.Li J, Yang YQ, Yang DY, et al. Reproducibility of perfusion parameters of optic disc and macula in rhesus monkeys by optical coherence tomography angiography. Chin Med J (Engl) 2016;129(9):1087–1090. [DOI] [PMC free article] [PubMed] [Google Scholar]
- 18.Jia Y, Wei E, Wang X, et al. Optical coherence tomography angiography of optic disc perfusion in glaucoma. Ophthalmology 2014;121(7):1322–1332. [DOI] [PMC free article] [PubMed] [Google Scholar]
- 19.Aung T, Friedman DS, Chew PT, et al. Long-term outcomes in Asians after acute primary angle closure. Ophthalmology 2004;111(8):1464–1469. [DOI] [PubMed] [Google Scholar]
- 20.Rajan V, Varghese B, van Leeuwen TG, Steenbergen W. Review of methodological developments in laser Doppler flowmetry. Lasers Med Sci 2009;24(2):269–283. [DOI] [PubMed] [Google Scholar]
- 21.Sugiyama T, Araie M, Riva CE, Schmetterer L, Orgul S. Use of laser speckle flowgraphy in ocular blood flow research. Acta Ophthalmol 2010;88(7):723–729. [DOI] [PubMed] [Google Scholar]
- 22.Wang Y, Bower BA, Izatt JA, Tan O, Huang D. Retinal blood flow measurement by circumpapillary Fourier domain Doppler optical coherence tomography. J Biomed Opt 2008; 13(6):064003. [DOI] [PMC free article] [PubMed] [Google Scholar]
- 23.Tsai JC. Acute primary angle closure structural damage. Ophthalmology 2011;118(5):1007–1007.e1. [DOI] [PubMed] [Google Scholar]
- 24.Flammer J, Konieczka K, Bruno RM, Virdis A, Flammer AJ, Taddei S. The eye and the heart. Eur Heart J 2013;34(17): 1270–1278. [DOI] [PMC free article] [PubMed] [Google Scholar]
- 25.Shoshani Y, Harris A, Shoja MM, et al. Impaired ocular blood flow regulation in patients with open-angle glaucoma and diabetes. Clin Exp Ophthalmol 2012;40(7):697–705. [DOI] [PubMed] [Google Scholar]
- 26.Singh K, Kaur S. Reduced ocular blood flow in asymmetric glaucoma: cause or effect? Int Ophthalmol 2014;34(4): 909–912. [DOI] [PubMed] [Google Scholar]
- 27.Jimenez-Aragon F, Garcia-Martin E, Larrosa-Lopez R, Artigas-Martin JM, Seral-Moral P, Pablo LE. Role of color Doppler imaging in early diagnosis and prediction of progression in glaucoma. Biomed Res Int 2013;2013:871689. [DOI] [PMC free article] [PubMed] [Google Scholar]
- 28.Yokoyama Y, Aizawa N, Chiba N,et al. Significant correlations between optic nerve head microcirculation and visual field defects and nerve fiber layer loss in glaucoma patients with myopic glaucomatous disk. Clin Ophthalmol 2011;5:1721–1727. [DOI] [PMC free article] [PubMed] [Google Scholar]
- 29.Resch H, Schmidl D, Hommer A, et al. Correlation of optic disc morphology and ocular perfusion parameters in patients with primary open angle glaucoma. Acta Ophthalmol 2011; 89(7):e544–e549. [DOI] [PubMed] [Google Scholar]
- 30.Cherecheanu AP, Garhofer G, Schmidl D, Werkmeister R, Schmetterer L. Ocular perfusion pressure and ocular blood flow in glaucoma. Curr Opin Pharmacol 2013;13(1):36–42. [DOI] [PMC free article] [PubMed] [Google Scholar]