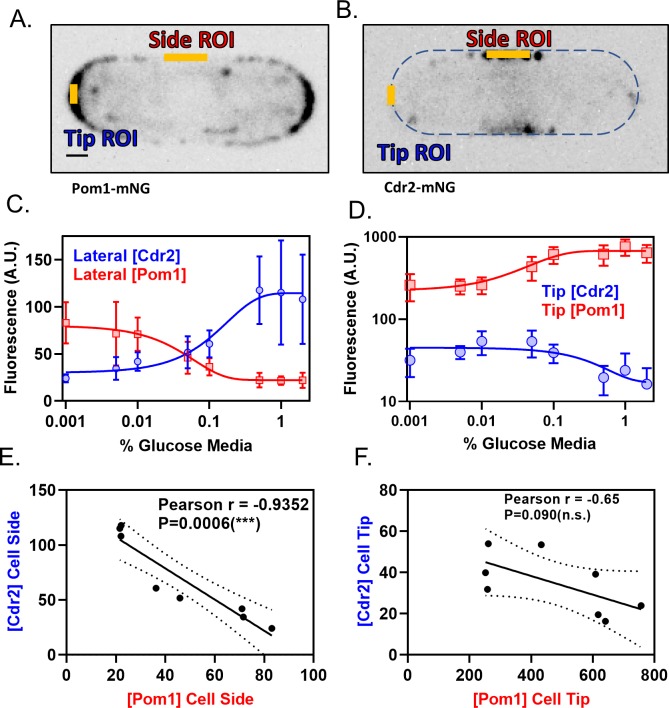
Figure 6. Pom1 and Cdr2 concentrations at the lateral cell cortex depend on glucose availability and are anti-correlated.
(A–B) Localization of Pom1-mNG (panel A) and Cdr2-mNG (panel B) in confocal micrographs at middle cell focal planes. Regions where line-scans were used to measure fluorescence intensity are marked at the tip and side (orange lines). Scale bar, 1 µm. (C) Concentration of Pom1 (red squares) or Cdr2 (blue circles) at cell sides in a range of glucose concentrations, measured using ‘Side ROI’ as in panels A and B (n > 10 cells/concentration). (D) Concentration of Pom1 (red squares) or Cdr2 (blue circles) at cell tips in a range of glucose concentrations, measured using ‘Tip ROI’ as in panels A and B (n > 10 cells/concentration). (E) Correlation of Cdr2 vs Pom1 concentrations at cell sides in each glucose concentration from panel C. Concentrations are anticorrelated across all tested media glucose concentrations (p=0.0006, Pearson r = −0.9352, n = 8 concentrations). (F) Correlation of Cdr2 vs Pom1 concentrations at cell tips in each glucose concentration from panel D. Concentrations show weak anticorrelation across the tested media glucose concentrations, but the correlation is not statistically significant (p=0.09, Pearson r = −0.65, n = 8 concentrations).

