

SUMMARY
Cell fate decisions are governed by sequence-specific transcription factors (TFs) that act in small populations of cells within developing embryos. To understand their functions in vivo, it is important to identify TF binding sites in these cells. However, current methods cannot profile TFs genome-wide at or near the single cell level. Here we adapt the CUT&RUN method to profile TFs in low cell numbers, including single cells and individual pre-implantation embryos. Single-cell experiments suggest that only a fraction of TF binding sites are occupied in most cells, in a manner broadly consistent with measurements of peak intensity from multi-cell studies. We further show that chromatin binding by the pluripotency TF NANOG is highly dependent on the SWI/SNF chromatin remodeling complex in individual blastocysts but not in cultured cells. Ultra-low input CUT&RUN (uliCUT&RUN) therefore enables interrogation of TF binding from rare cell populations of particular importance in development or disease.
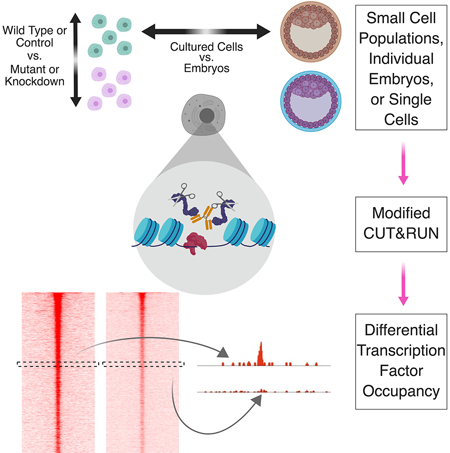
Graphical Abstract
eTOC BLURB
A modified CUT&RUN method makes it possible to map chromatin proteins in very low cell numbers, including the profiling of several transcription factors in single cells, enabling interrogation of rare cell populations of particular importance in development or disease
INTRODUCTION
Cellular heterogeneity presents a significant obstacle to the study of complex systems in metazoans (Yuan et al., 2017). Key developmental processes are often initiated in small populations of cells that expand and differentiate to generate complex tissues within the embryo. In adults, rare tissue-specific stem cells act in response to stimuli or damage to maintain tissue homeostasis. In addition, cells in some cancer types with properties of stem cells facilitate regeneration of the tumor mass after therapy. Because of the important roles of rare stem and progenitor cell populations in each of these settings, sensitive methods for characterizing their regulation and functions are necessary to better understand development and disease.
Cell fate decisions are orchestrated in large part by the concerted actions of TFs and chromatin remodeling proteins. Expression of lineage-specific TFs leads to the activation and repression of specific sets of genes that dictate cell identity, while chromatin remodeling proteins facilitate and enforce changes in gene expression (Young, 2011). The functions of developmental TFs and chromatin remodeling enzymes are interdependent—while some TFs direct chromatin remodeling proteins to specific regulatory regions, chromatin remodeling at enhancers is necessary for binding of other TFs with roles in directing cell fate (Zaret and Mango, 2016). Accordingly, comprehensive maps of the binding sites of TFs and chromatin regulators are necessary to understand how gene expression patterns are rewired during cell fate changes.
In spite of efforts to increase the sensitivity of methods for mapping the genomic locations of chromatin proteins, no current method is sufficiently sensitive to allow mapping of TFs, chromatin remodeling proteins, or other non-histone chromatin binding proteins in fewer than 1,000 cells. As an alternative strategy, methods for identification of open chromatin regions have enabled inference of regulatory elements such as enhancers and silencers, which are generally accessible to non-sequence-specific enzymes that generate DNA breaks (Buenrostro et al., 2013; Crawford et al., 2004; Sabo et al., 2004). Highly sensitive modifications of two such methods, ATAC-seq and DNase-seq, have enabled analysis of chromatin accessibility in single cells, allowing examination of epigenomic variability and identification of cell type-specific chromatin features (Buenrostro et al., 2015b; Cusanovich et al., 2015; Jin et al., 2015). While these techniques are effective for discovery of potential regulatory features, in many cases it is not possible to determine whether binding of chromatin proteins render particular genomic regions accessible, and if so, which factors are responsible. Chromatin remodeling enzymes generally bind without preference for DNA sequence, preventing identification of DNA sequence motifs specific for these factors within open chromatin regions. Even for sequence-specific TFs, many enhancers include binding sites for multiple TFs (Long et al., 2016). Furthermore, groups of paralogous TFs often bind similar motifs. Therefore, high confidence assignment of accessible chromatin peaks to any one TF is not possible in many cases.
Modifications to traditional chromatin immunoprecipitation (ChIP) protocols have been developed in recent years to profile TF binding in small populations of cells, including ChIPmentation, MOWChIP-seq, carrier-assisted ChIP-seq, ULI-NChIP, µChIP, and DROP-ChIP (Brind’Amour et al., 2015; Cao et al., 2015; Dahl et al., 2016; Liu et al., 2016; Rotem et al., 2015; Schmidl et al., 2015). Several of these techniques enable mapping of abundant histone modifications such as H3K4me3 and H3K27me3 in fewer than 1,000 cells. However, ChIP-based methods for mapping chromatin occupancy of TFs currently require a minimum of 10,000 cells (and typically many more) to observe reproducible peaks of enrichment (Schmidl et al., 2015; Zwart et al., 2013). Because of these difficulties, the genomic landscape of TF binding in single cells, individual pre-implantation embryos, or other rare populations has been unattainable.
CUT&RUN is a recently described method for genome-scale profiling derived from ChIC, in which a recombinant protein A-micrococcal nuclease (MNase) fusion protein is recruited via antibodies to the genomic locations of chromatin proteins, and underlying DNA fragments are liberated from bulk chromatin by endonucleolytic cleavage (Schmid et al., 2004; Skene and Henikoff, 2017). Unlike most ChIP-based approaches, CUT&RUN does not require sonication or crosslinking of chromatin (although crosslinking can be performed), eliminating these potential sources of artifacts (Baranello et al., 2016; Jain et al., 2015; Meyer and Liu, 2014; Teytelman et al., 2013). Most importantly, specific DNA digestion by targeted MNase results in low background, due to the fact that undigested chromatin is largely insoluble, allowing undigested regions to be easily removed prior to library construction. Consequently, an increased signal to noise and decreased requirement for high read coverage are key advantages of CUT&RUN over other mapping approaches. CUT&RUN has been successfully used to map H3K27me3 genome-wide using as few as 100 cells and the insulator protein CTCF from as few as 1,000 (Skene et al., 2018).
Despite these advances, there are still no methods capable of profiling TF occupancy genome-wide in single cells or individual embryos. In this study, we adapt the CUT&RUN method for ultra-low input by modifying several steps at various stages of the original protocol. These modifications enable us to profile the genomic occupancies of several chromatin proteins in small populations of cells, individual pre-implantation mouse embryos, and single cells. In single cells, we find that the fractional occupancies of TF binding sites typically reflect their peak intensities from multi-cell ChIP-seq maps, suggesting multi-cell peak intensities reflect the steady-state proportion of cells with bound TF at each site. Moreover, we show that the combined reads of as few as five single cells can capture features of multi-cell maps. Finally, we test the extent to which properties of TF binding previously measured in cultured cells are shared in vivo—a question that could not be addressed using ChIP-seq approaches. We focused on the pluripotency TF NANOG, which has previously been shown to display minimal requirement for the SWI/SNF family ATPase BRG1 for binding to its genomic targets in cultured mouse embryonic stem cells (mESCs) (King and Klose, 2017). Interestingly, we find that NANOG is highly dependent on BRG1 for association with its genomic targets in mouse blastocysts, suggesting NANOG is significantly more sensitive to the underlying chromatin environment for association with its targets in vivo. Together, we show that uliCUT&RUN permits the study of TF binding in single cells, as well as biologically relevant populations in vivo that are difficult to obtain in large numbers.
RESULTS
Adaptation of CUT&RUN for very low cell numbers
To profile chromatin proteins from low numbers of cells, we altered several steps of the original CUT&RUN protocol to optimize for low input, including alterations to buffers, sample volumes, incubation times, quantities of spike-in DNA, along with modifications to the methods for library preparation and purification (see STAR Methods); we denote the modified protocol as “ultra-low input CUT&RUN” (uliCUT&RUN). We used uliCUT&RUN to profile the genomic locations of the insulator protein CTCF and H3K4me3, a mark of active promoter regions, from populations of mESCs ranging in number from 500,000 to 10. Two biological replicates for each antibody at each cell number were performed, along with control libraries that lacked a primary antibody. As additional controls, we generated biological replicate 50,000- and 50-cell libraries in which non-specific IgG was used in place of a primary antibody. We selected reads of less than 120 bp in length after paired-end sequencing of CTCF libraries and 150–500 bp reads for H3K4me3, corresponding to footprints of sequence-specific DNA binding proteins and nucleosomes, respectively, as previously described (Skene and Henikoff, 2017).
We focused first on known locations of CTCF and H3K4me3 in mESCs. To this end, we identified peaks of CTCF and H3K4me3 enrichment from published ChIP-seq datasets from independent laboratories; hereafter, these are designated “established” genomic locations for each DNA-binding protein or histone modification. We visualized uliCUT&RUN read densities in heatmap form over 4 kb surrounding the established locations of CTCF or H3K4me3, observing striking enrichment for all cell numbers tested (Fig. 1A-B). The heatmaps revealed a sharply delimited pattern of CTCF enrichment directly over established binding sites and a broader pattern of H3K4me3 enrichment, consistent with the fact that CTCF interacts with DNA via a small sequence motif while H3K4me3 is often enriched over larger domains near active gene promoters. In contrast, libraries lacking a primary antibody or using IgG in lieu of a primary antibody showed minimal enrichment at these sites (Fig. 1A-B; S1A-B).
Figure 1. Localization of chromatin proteins using uliCUT&RUN.
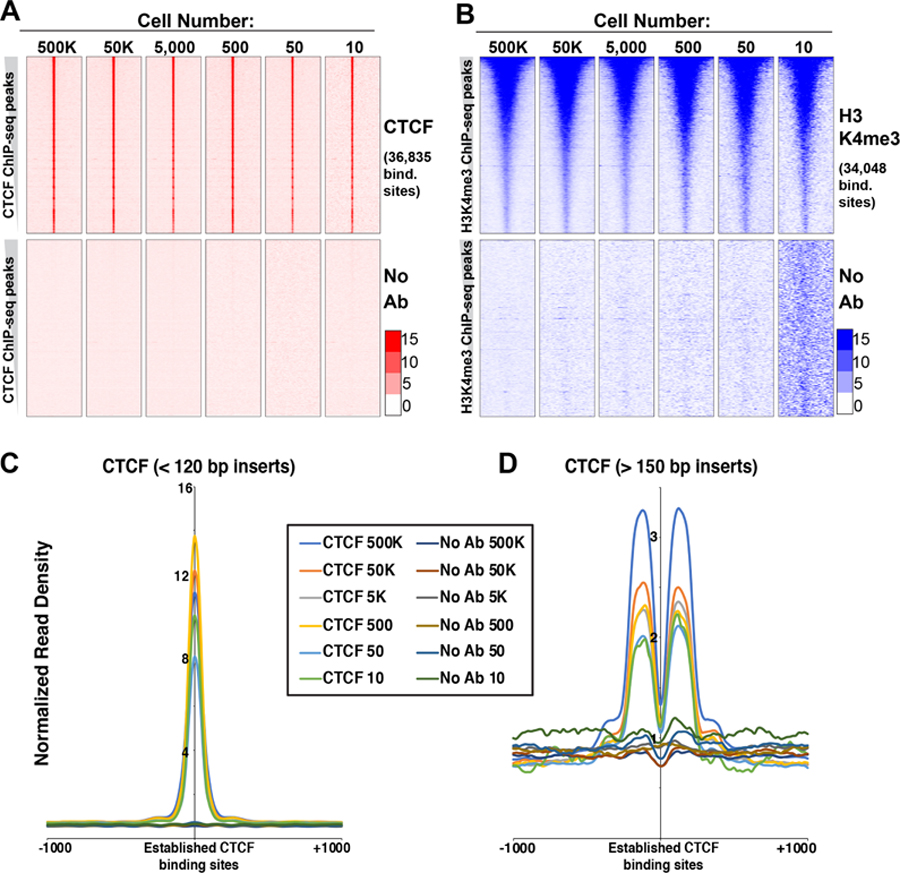
A, uliCUT&RUN data for CTCF and no primary antibody (No Ab) for indicated cell numbers. Shown is the normalized read density surrounding CTCF binding sites (center), called from GSE11431 with 2 kb of adjacent sequence on each side. Each heatmap row corresponds to one binding site (+/− 2kb), and rows are sorted from highest ChIP-seq peak intensity (top) to lowest (bottom). Heatmaps include combined data from two biological replicates. B, uliCUT&RUN data for H3K4me3. Data are centered on peaks called from GSE31039 and organized as in (A). C-D, Average enrichment of < 120 bp (C) or > 150 bp (D) reads from CTCF or No Ab libraries over established CTCF binding sites and flanking regions. See also Figure S1.
Well-positioned nucleosomes have been shown to surround CTCF binding sites (Carone et al., 2014; Fu et al., 2008; Teif et al., 2012). Henikoff and colleagues previously demonstrated that small reads (< 120 bp) from high cell number CTCF CUT&RUN libraries were specifically localized over CTCF binding sites while larger reads (> 150 bp) formed peaks of enrichment at the locations flanking CTCF that are known to be occupied by nucleosomes (Skene and Henikoff, 2017). These mutually exclusive patterns showed that while the smaller class of inserts corresponds to footprints of CTCF, the larger class is derived from flanking nucleosomes. We observed a similar pattern for CTCF uliCUT&RUN libraries derived from all cell numbers tested (Fig. 1C-D). These data demonstrate that uliCUT&RUN footprints CTCF and flanking nucleosomes with high specificity from as few as 10 cells.
To further evaluate the quality of the low cell number maps, we called peaks from uliCUT&RUN libraries and examined their overlap with established binding sites. Remarkably, CTCF uliCUT&RUN libraries from 500,000 to 50 cells identified 57–99% of established sites, while 10-cell CTCF libraries identified 25–42% (Fig. 2A). H3K4me3 libraries were slightly less rich at very low cell numbers, with 42–94% of established sites covered at or above 500 cells, and 23–35% of established sites identified by 10- and 50-cell libraries (Fig. 2B). Upon comparing these peaks, we observed a high degree of overlap across the entire range of cell numbers, demonstrating the reproducibility of uliCUT&RUN, despite lower overall coverage at the lowest cell numbers (Fig. S2A-B). Furthermore, for all cell numbers profiled, we observed significantly higher read enrichment surrounding the established genomic locations of CTCF and H3K4me3 in CTCF and H3K4me3 libraries, respectively, compared to control libraries (Fig. 2C-D). Finally, to examine the specificity of uliCUT&RUN, we tested for enrichment of known DNA sequence motifs. We observed that the sequence motifs corresponding to CTCF and its paralog CTCFL/BORIS (which are similar) were the only motifs highly overrepresented in CTCF libraries from all cell numbers profiled (Fig. 2E). Together, these findings demonstrate uliCUT&RUN generates high quality genome-scale maps of chromatin proteins from low cell numbers.
Figure 2. uliCUT&RUN maps from low cell numbers are specific, reproducible, and information-rich.

A-B, Percentage of high input ChIP-seq peaks identified by uliCUT&RUN for CTCF (A) or H3K4me3 (B) from two biological replicates of indicated cell numbers. C-D, Box plots quantifying uliCUT&RUN read density over the binding sites of CTCF (C) or H3K4me3 (D). The 25th and 75th percentiles (box), median (line), and 1.5X the interquartile range (whiskers) are shown without outliers. #p<2.2e-16, calculated using a Mann-Whitney U test, relative to both IgG control samples (from 50 or 50,000 cells). E, Significance of enrichment of motifs in CTCF uliCUT&RUN peaks from all cell numbers, plotted by the negative log of their p-value. P-values were calculated in HOMER using a binomial test. See also Figure S2.
Ultra-low input mapping of a diverse set of chromatin proteins
CTCF and H3K4me3 have proven to be among the most robust epitopes for ChIP-based studies, raising the question of whether uliCUT&RUN can effectively map a broader array of DNA-binding factors. To explore this issue, we generated 50,000- and 50-cell profiles for several TFs, histone modifications, and two chromatin modifying enzymes in mESCs. These proteins include both activating and repressive factors that are expressed at different levels in mESCs and utilize different modes of chromatin binding. In each case, uliCUT&RUN profiles from both 50 and 50,000 cells showed robust enrichment at established genomic locations for each factor (Fig. 3A-G). Although IgG or no antibody controls exhibited subtle enrichment over the binding sites of several TFs (Fig. 3A-G and Fig. S3A-F), consistent with the fact that many TF binding sites are highly accessible to nucleases (Thurman et al., 2012), enrichment at these sites was minimal in control libraries relative to TF-specific libraries. These findings demonstrate the broad utility of uliCUT&RUN for mapping of multiple classes of chromatin proteins, including both activating and repressive factors and histone modifications, from as few as 50 cells.
Figure 3. Profiling of a diverse array of chromatin proteins in low cell numbers.

A-G, uliCUT&RUN enrichment of indicated chromatin proteins from 50 and 50,000 mESCs. Heatmaps are sorted as in Fig. 1, depicting uliCUT&RUN enrichment at established binding sites (ChIP-seq peaks) for OCT4 (GSE11724, A); SOX2 (GSE11724, B); NANOG (GSE11724, C); BRG1 (GSE14344, D); H3K27ac (GSE31039, E); and EZH2 (GSE49435, F and G). Heatmaps include combined data from two biological replicates. H, Percentage of established TF binding sites identified by two uliCUT&RUN biological replicates each of 50 or 50,000 cells. I-K, Average enrichment over binding sites of OCT4 (I), SOX2 (J), or NANOG (K) that either were identified in both 50,000- and 50-cell TF-specific uliCUT&RUN libraries or were found only in one. See also Figures S3 and S4.
Mapping of TFs from low cell numbers represents the application of uliCUT&RUN with the highest potential utility, due to the fact that ChIP-based approaches for TF mapping require 104-107 cells—far more than required for mapping of histone modifications (Schmidl et al., 2015; Zwart et al., 2013). We therefore performed additional analyses of uliCUT&RUN profiles of developmental TFs. 79–96% of established binding sites were identified in peaks of enrichment from 50,000-cell samples of SOX2 and NANOG, while 50,000-cell OCT4 libraries included 54–74% of established binding sites (Fig. 3H). Furthermore, 60%−80% of established SOX2 and NANOG binding sites were identified in 50-cell libraries, along with 25–52% of OCT4 binding sites (Fig. 3H). As expected, peaks shared by 50,000- and 50-cell libraries exhibited much higher average enrichment than non-shared peaks for each TF (Fig. 3I-K), suggesting that many of the non-overlapping peaks are marginal. Finally, the established DNA sequence motifs corresponding to OCT4, SOX2, and NANOG were significantly enriched within peaks from both 50- and 50,000-cell libraries (Fig. S4A-C). These data suggest that although uliCUT&RUN can efficiently map the binding sites of a wide range of chromatin proteins in low cell numbers, it is especially useful for studies focused on TFs, due to the fact that orders of magnitude fewer cells are required for TF mapping by uliCUT&RUN than are needed for ChIP-seq studies.
Profiling of TFs in single cells by uliCUT&RUN
In principle, the capacity of uliCUT&RUN to profile TF occupancy from 10–50 cells is sufficiently sensitive to interrogate biological samples containing very few cells, such as preimplantation embryos or small tissue specimens. However, given that experiments in single cells can capture features of gene regulation missed in studies of cell populations, we explored the possibility of single-cell TF mapping experiments using uliCUT&RUN. To this end, we first sorted single mESCs into individual wells of 96-well plates, confirmed exactly one cell was found in nearly every well (Fig. S5A), and performed uliCUT&RUN with CTCF antibody or no antibody. In total, 120 CTCF single cells or 47 no antibody control single cells were profiled over several independent experimental trials (as is necessary due to the requirement for parallel, rather than pooled, processing of each library). Strikingly, despite variability from cell-to-cell, we observed higher read density over established CTCF binding sites in most CTCF single-cell libraries relative to surrounding regions and no antibody controls, demonstrating antibody-specific enrichment at established binding sites (Fig. 4A). Reinforcing this point, examination of heatmaps from individual CTCF or control single cells revealed a clear pattern of read enrichment directly over established CTCF binding sites in CTCF cells (examples shown in Fig. 4B), despite sparser coverage than observed for multi-cell heatmaps (Table S1 and see below).
Figure 4. Single-cell TF mapping by uliCUT&RUN.

A, Average enrichment over established CTCF binding sites (+/− 2kb) shown as a one-dimensional (linear) heatmap for each single cell, with heatmaps of individual cells stacked for comparison. B, Heatmaps of several individual single cells for CTCF or no primary antibody controls (No Ab). Similar to Fig. 1A, reads are shown surrounding CTCF binding sites (center), called from GSE11431 with 2 kb of adjacent sequence on each side. Each heatmap row corresponds to one binding site (+/− 2kb), and rows are sorted from highest ChIP-seq peak intensity (top) to lowest (bottom). C, Percentage of established CTCF binding sites identified when indicated numbers of single cell data were combined. D, Motifs significantly enriched from 5 or 50 combined CTCF single cell libraries. P-values were calculated in HOMER using a binomial test. See also Figure S5.
As anticipated for single diploid cells, which contain 2–4 copies of each binding site depending on the cell cycle phase, coverage of established binding sites typically consisted of single reads (Fig. S5B). We next quantified the proportions of established binding sites that were identified after combination of reads from various numbers of CTCF single-cell libraries. The combined reads from 50 single-cell libraries identified approximately 25% of established binding sites, while combinations from fewer cells resulted in proportionately fewer sites identified (Fig. 4C). Finally, we tested whether the DNA sequence motif corresponding to CTCF was significantly enriched within the combined reads from five or fifty CTCF single-cell maps. Notably, we observed statistically significant enrichment of the CTCF binding motif (and the related CTCFL/BORIS motif) in both combinations (Fig. 4D).
Single cell profiling reveals differential occupancy of binding sites by pluripotency TFs
To test whether developmental TFs could also be profiled in single cells, we performed single-cell uliCUT&RUN using antibodies recognizing SOX2 or NANOG, profiling 26 single cells for each TF and 13 no antibody control cells. As with CTCF, most single cells exhibited higher read coverage over the binding sites of each TF relative to surrounding regions or no antibody control cells (examples shown in Fig. 5A-B). However, for both SOX2 and NANOG, the binding sites near the tops of the heatmaps—corresponding to the multi-cell ChIP-seq peaks with the highest read densities—appeared to have higher read coverage than the lower regions of the heatmaps. TF binding is digital in individual cells, where each site is either bound or unbound by a given TF. Consequently, if TF binding site A has a higher multi-cell ChIP-seq peak intensity than binding site B, it is often assumed that site A is bound in a higher fraction of cells than site B. However, this assumption has never been tested, due to the lack of a method for single-cell profiling. In addition, common artifacts of ChIP-seq include non-specific enrichment of genomic regions that are more efficiently sheared or biases due to crosslinking (Baranello et al., 2016; Jain et al., 2015; Meyer and Liu, 2014; Teytelman et al., 2013), raising the possibility that factors other than fractional TF occupancy determine multi-cell ChIP-seq peak intensity. With single-cell uliCUT&RUN maps of TF binding, the relationship between fractional TF occupancy at each binding site and peak intensity in multi-cell experiments can be evaluated.
Figure 5. Variable occupancy across established SOX2 and NANOG binding sites in mESCs.

A-B, Heatmaps depicting individual single cells for SOX2 (A), NANOG (B), including no antibody controls (No Ab), as in (Fig. 4B). C-D, Distribution of single-cell Sox2 (C) or Nanog (D) uliCUT&RUN reads that overlap established TF binding sites. Five quintiles were determined from published multi-cell ChIP-seq data, from highest peak intensity (1st quintile) to the lowest (5th quintile). E, Single cell maps of SOX2, NANOG, or No Ab at the Pou5f1 locus. Each single cell is shown as one row. 50,000 cell data are shown as a reference. F, Percentage of high input ATAC-seq (GSE85330) peaks identified by single-cell ATAC-seq (GSE65360) and the percentage of established TF sites with read coverage in single-cell uliCUT&RUN maps of CTCF, SOX2, and NANOG. Blue dots denote the averages. G, Quantification of read densities within 40 bp of the peak centers of established factor binding sites. Boxes range from the 25th to the 75th percentiles of the data and the whiskers span the data points within 1.5 times the interquartile range. P-values were calculated using Mann-Whitney U tests. See also Figure S5.
To address this issue, we partitioned established SOX2 and NANOG binding sites into five groups ranked according to their multi-cell ChIP-seq peak intensity, from the highest 20% (1st quintile) to the lowest (5th quintile). For both SOX2 and NANOG, reads from single-cell uliCUT&RUN maps were highly overrepresented among the top two quintiles (i.e., greater than 20% of single-cell uliCUT&RUN reads that overlap with established binding sites fell within each of these quintiles) and underrepresented among the bottom three (Fig. 5C-D). Indeed, binding sites within the top ChIP-seq quintile for both SOX2 and NANOG were more frequently identified than the bottom three quintiles combined. Next, we tested whether higher background within the top quintiles (resulting from higher MNase accessibility at these sites), contributes to overrepresentation of the strongest TF binding sites in single cell maps. Background enrichment can be a critical parameter in single cell studies, since MNase accessibility may vary depending on chromatin structure near the binding sites of each factor. To this end, we subtracted aggregate read density of control cells from TF-specific read density for each quintile and examined enrichment over established TF binding sites. Consistent with our finding that the strongest ChIP-seq peaks are more frequently identified by single cell uliCUT&RUN, we observed higher aggregate read density among the top quintiles for each TF (Fig. S5C-E). In addition, we found that the strongest peaks from high cell number uliCUT&RUN maps were also overrepresented in single cell uliCUT&RUN maps (Fig. S5F).
Significantly, we observed that most SOX2 and NANOG single cell uliCUT&RUN maps exhibited enrichment at several peaks within the Pou5f1 super-enhancer (Fig. 5E), which was previously shown to be highly bound by both factors (Whyte et al., 2013). Thus, despite the substantially sparser coverage of single-cell maps relative to multi-cell maps, TF binding sites that exhibit occupancy in a high proportion of single cells can be identified. Collectively, these findings provide evidence for one of the central assumptions of multi-cell mapping studies, namely that higher ChIP-seq peak intensities result from higher fractional occupancy of TFs.
Finally, we examined the information content of single cell uliCUT&RUN maps for CTCF, NANOG, and SOX2 and used single-cell maps of open chromatin domains as a frame of reference for evaluation of single-cell uliCUT&RUN data. As with uliCUT&RUN, individual genomic regions in single-cell ATAC-seq and DNase-seq studies were inefficiently recovered (Buenrostro et al., 2015b; Cusanovich et al., 2015; Jin et al., 2015), underscoring the difficulties with single cell approaches that target DNA sequences (present in 2–4 copies per cell) rather than RNA (present in thousands of copies per cell for some transcripts) (Marinov et al., 2014). Compared to the fraction of multi-cell ATAC-seq peaks (Liu et al., 2017) identified by single-cell ATAC-seq (Buenrostro et al., 2015b), single-cell uliCUT&RUN libraries identified TF binding sites at a higher rate on average (Fig. 5F), suggesting relatively higher sensitivity of the uliCUT&RUN approach, at least for the TFs profiled in this study. To further test the specificity of single-cell uliCUT&RUN maps, we quantified read enrichment over established TF binding sites in TF-specific and no antibody controls. We observed significantly higher read enrichment near TF binding sites in TF-specific single-cell libraries compared to no antibody controls for all three factors profiled (Fig. 5G). Together, these data demonstrate specific (albeit sparse) TF profiling in single cells using uliCUT&RUN.
NANOG association with its genomic targets depends on BRG1 in vivo
OCT4, SOX2, KLF4, and NANOG are critical for pluripotency in inner cell mass cells of blastocyst stage embryos, as well as their cultured counterparts, ESCs (Young, 2011). In mESCs, BRG1—the catalytic component of esBAF, a SWI/SNF family nucleosome remodeling complex that creates open chromatin structure at enhancers and gene promoters—is required for association of OCT4 with approximately 60% of its normal genomic binding sites (Hainer and Fazzio, 2015; Hodges et al., 2018; Hu et al., 2011; King and Klose, 2017). In contrast, chromatin association of SOX2 and NANOG is only modestly dependent on BRG1 function (Hainer and Fazzio, 2015; King and Klose, 2017), suggesting that continuous chromatin remodeling is dispensable for sustained binding of these factors at most loci. However, BRG1 is maternally deposited in oocytes and functions starting at zygotic genome activation (Bultman, 2006), whereas NANOG is expressed only at late morula and blastocyst stages (Chambers et al., 2003; Mitsui et al., 2003). Therefore, although NANOG binding is largely unaffected in BRG1-depleted mESCs, BRG1 may be required to open chromatin structure prior to the blastocyst stage to allow initial NANOG binding. Such a possibility has not been addressed on a genome-wide level because blastocysts are composed of ~30–80 cells and are therefore poorly suited to ChIP-based approaches.
In light of these questions, we made use of the unique ability of uliCUT&RUN to map TF occupancy in small cell populations to examine whether BRG1 is critical for chromatin association of NANOG in mouse blastocysts. After adapting uliCUT&RUN for embryos (see STAR Methods), we first performed pilot experiments mapping localization of CTCF in individual blastocysts. We observed enrichment of CTCF at its established mESC binding sites (Fig. 6A-B), demonstrating that uliCUT&RUN can be adapted for use in single pre-implantation embryos. Next, we tested the effect of BRG1 (gene name: Smarca4) depletion on genome-wide association of NANOG. We injected one-cell mouse embryos with previously validated endoribonuclease prepared siRNAs (esiRNAs) targeting Smarca4, Nanog, or EGFP (Fazzio et al., 2008; Hainer et al., 2015), cultured each embryo to the early blastocyst stage (~30–50 cells), and mapped NANOG enrichment using uliCUT&RUN. Knockdown (KD) of each factor was confirmed by RT-qPCR using the cytoplasmic fraction that is normally discarded during the CUT&RUN procedure, as well as immunostaining of a parallel set of injected embryos (Fig. S6A-C). Consistent with previous studies (Carey et al., 2015), Smarca4 KD had no observable effect on Nanog expression in the inner cell mass but caused a modest increase in Nanog expression in trophoblast cells (Fig. 6C), resulting in moderately elevated Nanog levels overall (Fig. S6A). Nanog KD strongly reduced NANOG enrichment at its genomic binding sites, demonstrating the specificity of in vivo uliCUT&RUN (Fig. 6D).
Figure 6. Chromatin association of NANOG is dependent on BRG1 in vivo.

A, CTCF or no primary antibody (No Ab) uliCUT&RUN maps (two biological replicates each) of single blastocysts are shown as heatmaps, sorted as in Fig. 1. B, One-dimensional heatmaps showing average enrichment over all CTCF binding sites for each replicate. C, NANOG immunofluorescence (red) of EGFP or Smarca4 KD blastocysts. Boundaries of each inner cell mass are highlighted (dotted lines) and DAPI stained nuclei are shown in blue. D, One-dimensional heatmaps of embryos knocked down as indicated (four biological replicates per group) and subjected to uliCUT&RUN with NANOG antibody or no antibody. E, Quantification of NANOG peaks identified from each group of blastocysts. Replicates were combined for peak identification. F-G, Aggregate NANOG enrichment following Smarca4 depletion in (F) blastocysts or (G) 50 mESCs, measured by uliCUT&RUN. All replicates of each group were averaged. H, Browser tracks showing NANOG enrichment in EGFP or Smarca4 KD embryos (mESC data are shown for reference). The Nanog distal enhancer (DE) is highlighted. See also Figure S6.
Interestingly, NANOG occupancy was strongly reduced overall upon Smarca4 KD (Fig. 6D), despite normal NANOG expression in the inner cell mass and modestly elevated NANOG levels in trophoblast of Smarca4 KD embryos. Nearly 70% fewer peaks of NANOG binding were identified in Smarca4 KD embryos (Fig. 6E), consistent with the approximately 74% average reduction of NANOG occupancy overall (Fig. 6F). In contrast, NANOG uliCUT&RUN from 50 Smarca4 KD mESCs, as well as re-analysis of published NANOG ChIP-seq data from Smarca4 knockout mESCs (King and Klose, 2017), revealed only a modest reduction in NANOG occupancy relative to control mESCs (Fig. 6G, Fig. S6D). These findings demonstrate that NANOG association with its target sites is much more dependent on BRG1 function in vivo than in mESCs. As a physiologically relevant example, we examined the distal enhancer of the Nanog gene, where NANOG has been shown to bind in ESCs (Boyer et al., 2005; Levasseur et al., 2008; Loh et al., 2006). We observed NANOG enrichment at this site in all control blastocysts, whereas enrichment was low or undetectable in three of four Smarca4 KD embryos (Fig. 6H). Critically, we observed no developmental delays or morphological abnormalities upon Smarca4 KD in embryos, consistent with previous studies (Bultman et al., 2000; Kidder et al., 2009) and ruling out this potential confounding factor.
DISCUSSION
Here we have shown that uliCUT&RUN is a powerful method for mapping the genomic locations of chromatin proteins, allowing mapping of TFs from single cells and individual pre-implantation embryos. Although this method facilitates profiling of a broad range of chromatin proteins from low cell numbers, the increase in sensitivity for TF mapping is the most pronounced. Consequently, uliCUT&RUN is well suited for numerous new avenues of research in areas where purified cell populations isolated from animal models or patients are too few to profile TFs by ChIP-seq and no cell culture model can accurately mimic the in vivo setting.
In addition to rich maps of chromatin protein occupancy from 50 cells, we were able to map the genome-wide binding sites of CTCF and two pluripotency TFs, SOX2 and NANOG, in single cells. Since each individual TF binding site is present in only 2–4 copies per diploid cell, single cell TF profiling represents a considerable technical challenge. Despite this challenge, we observed binding at several sites within the Pou5f1 super-enhancer in a large majority of the single cells that were profiled, demonstrating that the sparseness of single-cell uliCUT&RUN data does not prevent identification of high-occupancy sites. Binding sites with lower ChIP-seq peak intensities were much less frequently covered in single-cell uliCUT&RUN libraries, suggesting these sites are occupied in a much lower fraction of cells at any given time. It should be noted that, as with single cell ATAC-seq and DNase-seq, false negatives—sites that are occupied in a portion of cells but not identified in single cell maps—are possible with uliCUT&RUN from single cells. Therefore, the profiles of numerous single cells should be considered when interpreting an absence of reads at individual regions by any of these three approaches. In contrast, uliCUT&RUN appears to be unique among single-cell approaches in its ability to generate negative control (no antibody or non-specific IgG) maps, allowing potential false positives to be identified and eliminated from downstream analyses.
Although future single-cell studies focused on the variability of TF binding and its effects on transcriptional heterogeneity are now possible with uliCUT&RUN, another potential area of research enabled by this approach is the examination of TF occupancy in limited biological samples from patients or animal models. Typically, a tradeoff between cell number and cell purity in tissue samples prevents use of ChIP-seq to profile purified populations of tissue-specific stem cells or cells with stem cell properties within tumors. The ability of uliCUT&RUN to obtain maps of factor binding from 50 cells that are highly overlapping with maps from high cell numbers enables mapping from virtually any available specimen. A similar argument applies to studies of TFs in pre- or early post-implantation embryos, where fewer than 10,000 cells are available. As proof-of-concept, we used uliCUT&RUN to show that NANOG is significantly more dependent on esBAF for chromatin association in vivo than in ESCs—a result that would not have been attainable using conventional mapping methods. These findings suggest that chromatin remodeling by esBAF is broadly required in early embryos to allow NANOG binding in the inner cell mass, whereas sustained esBAF function appears to be dispensable for NANOG binding at many sites in ESCs (King and Klose, 2017). It remains to be seen whether other developmentally important TFs have different requirements for chromatin association in embryos than widely assumed based on studies performed in cultured cells.
STAR METHODS
CONTACT FOR REAGENT AND RESOURCE SHARING
Further information and requests for resources and reagents should be directed to and will be fulfilled by Thomas Fazzio (thomas.fazzio@umassmed.edu) or Sarah Hainer (sarah.hainer@pitt.edu).
EXPERIMENTAL MODEL AND SUBJECT DETAILS
Cell culture
E14 mouse ES cells (Hooper et al., 1987) were cultured as previously described (Chen et al., 2013). Cells have been verified that they are of male mouse origin through sequencing performed in this and previous studies and were previously tested to ensure they were free of mycoplasma.
Mouse
All animal studies were performed in accordance with UMMS guidelines on animal care. These studies were approved by the Institutional Animal Care and Use Committee of University of Massachusetts Medical School (approval number A-1833).
Super-ovulated FVB females were mated with FVB males and zygotes were collected ~17–19 hours post-hCG. Zygotes were washed in M2 medium with hyaluronidase to remove surrounding cumulus cells, followed by three additional washes in M2. Zygotes were not sexed, as sex-specific differences are not applicable at this stage and sexing of embryos prior to uliCUT&RUN was not possible. Zygote microinjections were performed on Ziess AxioVert200 microscope using an Eppendorf Femtojet microinjector. Approximately 5pL of esiRNAs against EGFP, Smarca4 or Nanog was injected per zygote, at the concentration of 0.5µg/µL. Zygotes were subsequently placed in KSOM media in a 5% CO2, 5% O2 incubator and cultured until the blastocyst stage. Blastocysts were washed twice in M2 and the zona pellucidae were removed by acid Tyrode’s solution, and the blastocysts were washed two additional times in M2. Individual blastocysts to be used for uliCUT&RUN were then pipetted into NE buffer.
METHOD DETAILS
uliCUT&RUN procedure and library preparation
Nuclei prep:
The CUT&RUN protocol was modified from Skene and Henikoff (Skene and Henikoff, 2017). Mouse ES cells were counted using a TC-10 or TC-20 cell counter (Biorad) and diluted to respective cell amounts. Cells were pelleted at 600g for 3 minutes at 4°C, supernatant was discarded and cells were washed with 1mL cold PBS. Cells were pelleted at 600g for 3 minutes at 4°C, s upernatant was discarded and cells were resuspended in 1mL cold nuclear extraction (NE) buffer (20mM HEPES-KOH, pH 7.9, 10mM KCl, 0.5mM Spermidine, 0.1% TritonX-100, 20% glycerol, freshly added protease inhibitors). Nuclei were pelleted at 600g for 3 minutes at 4°C, supernatant was discarded and nuclei were resuspended in 600µL NE buffer. During the cell washes, Concanavalin A beads (Polysciences) were prepared. For 500,000 nuclei 200µL bead slurry was used, for 50,000 nuclei 150µL bead slurry was used, for 5,000 nuclei, 100µL bead slurry was used, for 500 nuclei or 50 nuclei 50µL bead slurry was used, and for 10 nuclei 20µL bead slurry were used. Beads were transferred to a microfuge tube containing 3X volume cold Binding Buffer (20mM HEPES-KOH, pH 7.9, 10mM KCl, 1mM CaCl2, 1mM MnCl2). Beads were washed twice in 1mL cold Binding Buffer and resuspended in 300µL Binding Buffer. Nuclei were added to beads with gentle vortexing and incubated for 10 minutes at room temperature.
Antibody binding:
After nuclei binding, supernatant was discarded and bead-bound nuclei were blocked with 1mL cold Blocking Buffer (20mM HEPES, pH 7.5, 150mM NaCl, 0.5mM Spermidine, 0.1% BSA, 2mM EDTA, freshly added protease inhibitors) which was added with repeated gentle pipetting and incubated for 5 minutes at room temperature. Supernatant was discarded and nuclei/beads were washed in 1mL cold Wash Buffer (20mM HEPES, pH 7.5, 150mM NaCl, 0.5mM Spermidine, 0.1% BSA, freshly added protease inhibitors) and resuspended in 250µL cold Wash Buffer. Primary antibody was added with gentle vortexing of bead-bound nuclei in 250µL cold Wash Buffer to a final concentration of 1:100 (5µL antibody per sample). For negative controls, either (non-immunized) rabbit IgG or no primary antibody can be used (we have not noticed significant differences between these controls). Samples were incubated with rotation at 4°C for 2 hours. Supernatant was discar ded and samples were washed twice in 1mL cold Wash Buffer. Supernatant was discarded and samples were resuspended in 250µL cold Wash Buffer.
Protein A-micrococcal nuclease (pA-MN) binding and cleavage:
pA-MN was added with gentle vortexing of the nuclei in 250µL cold Wash Buffer to a final concentration of 1:400. Samples were incubated with rotation at 4°C for 1 hour. Supernatant was discarded and samples were washed twice in 1mL cold Wash Buffer. Supernatant was discarded and samples were resuspended in 150µL cold Wash Buffer. Samples were equilibrated to 0°C on ice water for 5–10 minutes. To initiate cleavage, 3µL 100mM CaCl2 was added during gentle vortexing, and samples were flicked quickly to mix and returned to ice water. After 5 minutes of digestion, reactions were stopped with addition of 150µL 2XSTOP buffer (200mM NaCl, 20mM EDTA, 4mM EGTA, 50ug/mL RNaseA, 40ug/mL glycogen, 10pg/mL yeast spike-in DNA). Samples were incubated at 37°C for 20 minutes to digest RNA and release DNA fragments. Samples were centrifuged at 16,000g for 5 minutes and supernatants were transferred to new microfuge tubes while pellets and beads were discarded. Following addition of 3µL 10% SDS and 2.5µL 20mg/mL ProteinaseK, samples were mixed by inversion and incubated at 70°C for 10 minutes. DNA was purified using phenol/chloroform/isoamyl alcohol (PCI) extraction followed by chloroform extraction and precipitated with glycogen and ethanol. DNA was pelleted with a high-speed spin at 4°C, washed, air dried for ~5 minutes and resuspended in 36.5µL 0.1XTE.
Library preparation:
Libraries were prepared using a modification of the previously described protocol (Skene and Henikoff, 2017). DNA end-repair, phosphorylation, and A-tailing was performed in a single reaction, as follows. T4 DNA Polymerase (NEB) was diluted 1:20. 5µL 10X T4 DNA ligase buffer (NEB), 2.5µL 10mM dNTPs, 1.25µL 10mM ATP, 3.13µL 40% PEG4000, 0.63µL T4 PNK (NEB), 0.5µL diluted T4 DNA Polymerase, and 0.5µL Taq polymerase (homemade) was added to 36.5µL of CUT&RUN enriched DNA. Samples were incubated at 12°C for 15 minutes, 37°C for 15 minutes, and 72°C for 20 minutes in a thermocycler. Samples were put on ice immediately and the following adapter ligation reaction was performed. PE Illumina adapters with inline barcodes were used for these experiments. 55µL of 2X Quick ligase buffer (NEB), 5µL Quick ligase (NEB), and 5µL of 1.5µM adapter mix was added to 50µL of A-tailed DNA and samples were incubated at 20°C for 15 minutes i n a thermocycler. Immediately following adapter ligation, samples were purified using Ampure XP beads (Beckman Coulter). Beads were warmed to room temperature during adapter ligation and 38µL well-mixed beads were added to libraries. Samples were mixed thoroughly and incubated for 15 minutes at room temperature. Following solution clearing on a magnetic rack, supernatants were discarded and beads were washed two times with 200µL 80% EtOH. Samples were briefly spun, residual liquid was discarded, and beads were allowed to air dry for ~5 minutes. DNA was eluted from beads by resuspending beads in 30µL 10mM Tris-HCl, pH 8.0, and incubating at room temperature for 2 minutes. Following solution clearing on a magnetic rack, 27.5µL DNA was transferred to a 0.2mL PCR tube and libraries were amplified by PCR as follows. 10µL 5X KAPA HiFi buffer, 1.5µL 10mM dNTPs, 5µL 20µM PE PCR 1.0, 5µL 20µM PE PCR 2.0, 1µL KAPA Hotstart HiFi DNA Polymerase was added to 27.5µL of library DNA. The following PCR program was used: 98°C 45 seconds, 98°C 15 seconds, 60°C 10 seconds, steps two and three were repeated the specified number of times and 72°C 1 minute. For DNA isolated from 500,000 or 50,000 cells, 14 cycles was used; for DNA isolated from 5,000 cells, 16 cycles was used; for DNA isolated from 500 cells, 17 cycles was used; for DNA isolated from 50 cells, 19 cycles was used; for DNA isolated from 10 cells, 21 cycles was used. The number of PCR cycles was determined using qPCR following 5 cycles of initial amplification using a procedure previously described for ATAC-seq library preparation (Buenrostro et al., 2013; 2015a). Following library amplification, samples were loaded on an agarose gel, and DNA corresponding to 150–700 bp was gel extracted using Qiagen Buffer QG and Econospin Mini Spin Columns (Epoch Life Science). Libraries were sequenced on an Illumina NextSeq500.
Single-cell uliCUT&RUN samples were prepared as above with the following alterations to the protocol. Cells were washed, resuspended in PBS + 1% FBS and single cells were sorted into individual wells of a 96-well plate containing 100µL NE buffer using a BD FACSAria II Cell Sorter. 15µL of Concanavalin A beads per sample were washed twice with Binding Buffer, resuspended in 50µL of Binding Buffer per sample, and 50µL was added directly to the each well containing an individual cell. During the 10-minute binding incubation, samples were mixed by pipetting and transferred to 1.5mL microfuge tubes. After discarding the cytoplasmic fraction and blocking the sample in Blocking Buffer, beads were washed and resuspended in 125µL Wash Buffer. Primary antibody was added during gentle vortexing in 125µL Wash Buffer to a final concentration of 1:100 (2.5µL of antibody per sample). Following a 2-hour incubation with rotation at 4°C and a single wash step, beads were resuspended in 125µL Wash Buffer and pA-MN was added to a final 2022concentration of 1:400, in 125µL Wash Buffer during gentle vortexing. Following one wash, beads were resuspended in 150µL Wash buffer and equilibrated to 0°C in ice water for 5–10 minutes. 3µL 100mM CaCl2 was added during gentle vortexing and digestion was permitted to proceed for 30 minutes. Chelation of the reaction was performed with 2XSTOP buffer containing only 1pg/mL yeast spike-in DNA. Release of fragments and extraction was performed as above. Library preparation was performed as above with the following changes. Libraries were amplified for 22 cycles and samples were size selected twice by running two successive agarose gels.
Blastocyst uliCUT&RUN samples were prepared as above with the following alterations. Harvested blastocysts were washed twice in M2 and the zona pellucida was removed by acid Tyrode’s solution, followed by two additional M2 washes. Individual blastocysts were then pipetted into 300µL NE buffer, centrifuged for 2 minutes at 600g, and incubated on ice for 10 minutes. 20µL of Concanavalin A beads were washed twice with Binding Buffer, resuspended in 150µL of Binding Buffer, and added directly to tubes. Samples were incubated at room temperature for 10 minutes. Blocking, incubation with primary antibody, and incubation with pA-MN was performed as above. Following two washes, beads were resuspended in 150µL Wash Buffer and equilibrated to 0˚C in ice water for 5–10 minutes. 3µL 100mM CaCl2 was added during gentle vortexing, and digestion was permitted to proceed for 30 minutes. Chelation of the reaction was performed with 2XSTOP buffer. Release of fragments and extraction was performed as above. Library preparation was performed as above with the following changes. Libraries were amplified for 18 cycles, and samples were size selected twice by running two successive agarose gels.
Immunofluorescence and RT-qPCR
Zygotes were harvested and microinjected as described above and cultured to the blastocyst stage. The zona pellucidae were removed and embryos were fixed in 4% PFA. Immunostaining was performed as previously described (Torres-Padilla et al., 2006). Antibodies against NANOG and BRG1 were used at 1:200 dilution. The secondary antibody used was AlexaFluor 546 goat anti-rabbit IgG (Molecular Probes) at 1:500 dilution. Stained blastocysts were either mounted on coverslips or in drops of Vectashield Mounting Medium with DAPI (Vector Laboratories) to retain their three- dimensional structure. Microscopy was performed on AxioObserver.Z1/7 microscope using 63X/1.4 NA oil objective (coverslips) or 40x/1.3 NA oil objective (drops).
RNA was isolated from the cytosolic fraction of blastocysts using Agencourt RNAClean XP beads (Beckman Coulter). Isolated RNA was used to synthesize cDNA with a mixture of oligo-dT and random hexamers (Promega). cDNA was used in quantitative PCR reactions with Smarca4 or Nanog specific primers and KAPA SYBR FAST qPCR Master Mix on an Eppendorf Realplex 2.
QUANTIFICATION AND STATISTICAL ANALYSIS
uliCUT&RUN data analysis
Paired-end reads were trimmed to 25 bases, barcodes were removed, and reads were then aligned to mm10 using Bowtie2 with the parameters -N 1 and -X 1000. Duplicates were removed using Picard (http://broadinstitute.github.io/picard/). Reads with low quality score (MAPQ < 10) were removed. Reads were separated into the following size classes: < 120bp for TF occupancy and 150–500bp for nucleosome occupancy. These reads were processed in HOMER (Heinz et al., 2010). Genome browser tracks were generated from mapped reads using the “makeUCSCfile” command. Mapped reads were aligned over specific regions using the “annotatePeaks” command to make 20 bp bins over regions of interest and sum the reads within each bin. Peaks were called using parameters similar to those previously described (Skene et al., 2018) but implemented in HOMER using the “findPeaks” command with the following parameters: -style factor<or>histone -P 1 -poisson 0.01 -F 0.5 -L 2 -LP 0.001 -i noab. Peaks overlapping with published ChIP-seq datasets were determined based on enrichment +/− 40 bp surrounding the ChIP-seq peak center. Motifs were identified using the “findMotifs” command. Published ChIP-seq datasets used to compare CUT&RUN datasets were: CTCF (GSE11431); H3K4me3 (GSE31039); OCT4 (GSE11724); SOX2 (GSE11724); NANOG (GSE11724); BRG1 (GSE14344); H3K27ac (GSE31039); and EZH2 (GSE49435). These datasets were aligned, converted to mm10 using LiftOver, and processed in HOMER. Peaks were called using the “findPeaks” command.
To test for enrichment of uliCUT&RUN samples over background, we summed the normalized reads within 40 bp surrounding each binding site for both biological replicates per condition and performed Mann-Whitney U tests of antibody-specific libraries relative to IgG controls. To test for differences in gene expression by RT-qPCR, we used two-tailed unpaired t-tests. P-values for motif enrichment were performed by HOMER software, using a binomial test.
ATAC-seq data analysis
ATAC-seq datasets analyzed were from H1 ESC 50,000 cells (GSE85330) and 96 randomly selected H1 ESC single cells (GSE65360). Paired-end reads were trimmed to 24 bases and reads were then aligned to hg19 using Bowtie2 with the parameter -X 2000. Duplicates were removed using Picard. Reads with low quality score (MAPQ < 10) and reads mapping to the mitochondrial genome (chrM) were removed. Reads were separated into size classes as described (Buenrostro et al., 2013) and only nucleosome free reads (less than 100 bp) were used for subsequent analyses. Peaks were called using the “findPeaks” command. Overlapping peaks were identified using the “mergePeaks” command.
Supplementary Material
Read density of IgG biological replicates over the established binding sites of CTCF (A) and H3K4me3 (B). Heatmaps are organized and sorted as in Fig. 1.
A Overlap of CTCF binding sites identified by uliCUT&RUN for various cell numbers. For each uliCUT&RUN replicate at each cell number, the number of peaks overlapping with established CTCF binding sites was determined. The color of each box reflects the fraction of binding sites in the lower cell number library that are shared with the higher cell number for each comparison. The number listed in each box is the number of overlapping peaks. B, Overlap of H3K4me3 binding sites. Data are depicted as in (A).
Read density of IgG biological replicates over established binding sites of OCT4 (A), SOX2 (B), NANOG (C), BRG1 (D), H3K27ac (E), and EZH2 (F). Established binding sites and sorting of heatmaps are identical to those in Fig. 3.
Motifs enriched in peaks of enrichment from 50- and 50,000-cell uliCUT&RUN experiments mapping OCT4 (A), SOX2 (B), and NANOG (C). Shown are the top five most significant motifs enriched within each set of peaks, including the DNA logo, its corresponding TF, and its p-value. Overlapping peaks between two biological replicates for each cell number were used for these analyses.
A, Test of flow sorting efficacy reveals highly efficient delivery of single cells to wells of a 96-well plate. Individual mESCs were sorted into 96-well plates in two biological replicates with Hoechst 33342 stain, and the number of Hoechst- stained cells were counted. B, Quantification of the number of reads covering the central 1 bp of established CTCF binding sites. Only binding sites with read coverage are shown. All CTCF single cells and binding sites were combined into one pie chart. C-E, Aggregate read enrichment for single cell maps after subtraction of control cell read density and stratification by multi-cell ChIP-seq peak intensity. Normalized read density from combined control (no antibody) single cell uliCUT&RUN maps was subtracted from normalized TF-specific read density for each quintile and plotted over binding sites for each factor. F, Distribution of single cell uliCUT&RUN reads over binding sites identified from multi-cell uliCUT&RUN maps. Five quintiles were determined from 50,000-cell uliCUT&RUN data for each factor, and single cell uliCUT&RUN reads falling into each quintile were quantified as in Figure 5C-D.
A, RT-qPCR of cytoplasmic RNAs from embryos injected with indicated esiRNAs at the one cell stage and cultured to blastocysts. **P<0.01, two-tailed Student’s t-test. N.S., not significant. B-C, Immunofluorescence for NANOG (B) or BRG1 (C) in blastocyst stage embryos upon KD of Nanog or Smarca4, respectively by injection of esiRNAs at the one cell stage, as above. D, Changes in NANOG enrichment following Smarca4 knockout ESCs, from analysis of previously published ESC ChIP-seq data (King and Klose, 2017). Replicates corresponding to each KO were averaged.
HIGHLIGHTS.
A modified CUT&RUN method allows chromatin profiling from small numbers of cells
Transcription factors are profiled from single cells and blastocyst stage embryos
NANOG binding in vivo depends on SWI/SNF function
ACKNOWLEDGMENTS
We thank S. Henikoff, T. Wu, and C.-H. Chao for providing purified pA-MN protein. We thank the UMMS and University of Pittsburgh Flow Cytometry cores and the Health Sciences Sequencing Core at the University of Pittsburgh Children’s Hospital for assistance. Finally, we thank J. Benanti, I. Bach, J. Dekker, and M. Walhout for critical reading of the manuscript. This work was supported by NIH grants R01HD072122 (to T.G.F.) and R01HD080224 (to O.J.R.). A.B. is supported by a fellowship from the Human Frontier Science Programme (LT000857/2015-L). S.J.H. is a Special Fellow of the Leukemia and Lymphoma Society. T.G.F. is a Leukemia and Lymphoma Society Scholar.
Footnotes
Publisher's Disclaimer: This is a PDF file of an unedited manuscript that has been accepted for publication. As a service to our customers we are providing this early version of the manuscript. The manuscript will undergo copyediting, typesetting, and review of the resulting proof before it is published in its final citable form. Please note that during the production process errors may be discovered which could affect the content, and all legal disclaimers that apply to the journal pertain.
DECLARATION OF INTERESTS
The authors declare no competing interests.
DATA AND SOFTWARE AVAILABILITY
Data availability
Sequencing data (pertaining to all figures) are available at Gene Expression Omnibus (GSE111121).
Code availability
Code for sequencing data analysis is available (https://github.com/sarahhainer/uliCUT-RUN).
Data visualization
Heatmaps were made with Java Treeview. Browser tracks were made with the UCSC genome browser. The graphical abstract was made with BioRender.
REFERENCES
- Baranello L, Kouzine F, Sanford S, and Levens D (2016). ChIP bias as a function of cross-linking time. Chromosome Res 24, 175–181. [DOI] [PMC free article] [PubMed] [Google Scholar]
- Boyer LA, Lee TI, Cole MF, Johnstone SE, Levine SS, Zucker JP, Guenther MG, Kumar RM, Murray HL, Jenner RG, et al. (2005). Core Transcriptional Regulatory Circuitry in Human Embryonic Stem Cells. Cell 122, 947–956. [DOI] [PMC free article] [PubMed] [Google Scholar]
- Brind’Amour J, Liu S, Hudson M, Chen C, Karimi MM, and Lorincz MC (2015). An ultra-low-input native ChIP-seq protocol for genome-wide profiling of rare cell populations. Nat Commun 6, 6033. [DOI] [PubMed] [Google Scholar]
- Buenrostro JD, Giresi PG, Zaba LC, Chang HY, and Greenleaf WJ (2013). Transposition of native chromatin for fast and sensitive epigenomic profiling of open chromatin, DNA-binding proteins and nucleosome position. Nat Meth 10, 1213–1218. [DOI] [PMC free article] [PubMed] [Google Scholar]
- Buenrostro JD, Wu B, Chang HY, and Greenleaf WJ (2015a). ATAC-seq: A Method for Assaying Chromatin Accessibility Genome-Wide. Curr Protoc Mol Biol 109, 2129.1–29.9. [DOI] [PMC free article] [PubMed] [Google Scholar]
- Buenrostro JD, Wu B, Litzenburger UM, Ruff D, Gonzales ML, Snyder MP, Chang HY, and Greenleaf WJ (2015b). Single-cell chromatin accessibility reveals principles of regulatory variation. Nature 523, 486–490. [DOI] [PMC free article] [PubMed] [Google Scholar]
- Bultman SJ (2006). Maternal BRG1 regulates zygotic genome activation in the mouse. Genes and Development 20, 1744–1754. [DOI] [PMC free article] [PubMed] [Google Scholar]
- Bultman S, Gebuhr T, Yee Della, La Mantia C, Nicholson J, Gilliam A, Randazzo F, Metzger D, Chambon P, Crabtree G, et al. (2000). A Brg1 Null Mutation in the Mouse Reveals Functional Differences among Mammalian SWI/SNF Complexes. Mol Cell 6, 1287–1295. [DOI] [PubMed] [Google Scholar]
- Cao Z, Chen C, He B, Tan K, and Lu C (2015). A microfluidic device for epigenomic profiling using 100 cells. Nat Meth 12, 959–962. [DOI] [PMC free article] [PubMed] [Google Scholar]
- Carey TS, Cao Z, Choi I, Ganguly A, Wilson CA, Paul S, and Knott JG (2015). BRG1 Governs NanogTranscription in Early Mouse Embryos and Embryonic Stem Cells via Antagonism of Histone H3 Lysine 9/14 Acetylation. Mol Cell Biol 35, 4158–4169. [DOI] [PMC free article] [PubMed] [Google Scholar]
- Carone BR, Hung J-H, Hainer SJ, Chou M-T, Carone DM, Weng Z, Fazzio TG, and Rando OJ (2014). High-resolution mapping of chromatin packaging in mouse embryonic stem cells and sperm. Dev Cell 30, 11–22. [DOI] [PMC free article] [PubMed] [Google Scholar]
- Chambers I, Colby D, Robertson M, Nichols J, Lee S, Tweedie S, and Smith A (2003). Functional expression cloning of Nanog, a pluripotency sustaining factor in embryonic stem cells. Cell 113, 643–655. [DOI] [PubMed] [Google Scholar]
- Chen PB, Hung J-H, Hickman TL, Coles AH, Carey JF, Weng Z, Chu F, and Fazzio TG (2013). Hdac6 regulates Tip60-p400 function in stem cells. Elife 2, e01557. [DOI] [PMC free article] [PubMed] [Google Scholar]
- Crawford GE, Holt IE, Mullikin JC, Tai D, Blakesley R, Bouffard G, Young A, Masiello C, Green ED, Wolfsberg TG, et al. (2004). Identifying gene regulatory elements by genome-wide recovery of DNase hypersensitive sites. Proc Natl Acad Sci USA 101, 992–997. [DOI] [PMC free article] [PubMed] [Google Scholar]
- Cusanovich DA, Daza R, Adey A, Pliner HA, Christiansen L, Gunderson KL, Steemers FJ, Trapnell C, and Shendure J (2015). Multiplex single cell profiling of chromatin accessibility by combinatorial cellular indexing. Science 348, 910–914. [DOI] [PMC free article] [PubMed] [Google Scholar]
- Dahl JA, Jung I, Aanes H, Greggains GD, Manaf A, Lerdrup M, Li G, Kuan S, Li B, Lee AY, et al. (2016). Broad histone H3K4me3 domains in mouse oocytes modulate maternal-to-zygotic transition. Nature 537, 548–552. [DOI] [PMC free article] [PubMed] [Google Scholar]
- Fazzio TG, Huff JT, and Panning B (2008). An RNAi screen of chromatin proteins identifies Tip60-p400 as a regulator of embryonic stem cell identity. Cell 134, 162–174. [DOI] [PMC free article] [PubMed] [Google Scholar]
- Fu Y, Sinha M, Peterson CL, and Weng Z (2008). The Insulator Binding Protein CTCF Positions 20 Nucleosomes around Its Binding Sites across the Human Genome. PLoS Genet 4, e1000138. [DOI] [PMC free article] [PubMed] [Google Scholar]
- Hainer SJ, and Fazzio TG (2015). Regulation of Nucleosome Architecture and Factor Binding Revealed by Nuclease Footprinting of the ESC Genome. Cell Reports 13, 61–69. [DOI] [PMC free article] [PubMed] [Google Scholar]
- Hainer SJ, Gu W, Carone BR, Landry BD, Rando OJ, Mello CC, and Fazzio TG (2015). Suppression of pervasive noncoding transcription in embryonic stem cells by esBAF. Genes & Development 29, 362–378. [DOI] [PMC free article] [PubMed] [Google Scholar]
- Heinz S, Benner C, Spann N, Bertolino E, Lin YC, Laslo P, Cheng JX, Murre C, Singh H, and Glass CK (2010). Simple combinations of lineage-determining transcription factors prime cis-regulatory elements required for macrophage and B cell identities. Mol Cell 38, 576–589. [DOI] [PMC free article] [PubMed] [Google Scholar]
- Hodges HC, Stanton BZ, Cermakova K, Chang C-Y, Miller EL, Kirkland JG, Ku WL, Veverka V, Zhao K, and Crabtree GR (2018). Dominant-negative SMARCA4 mutants alter the accessibility landscape of tissue-unrestricted enhancers. Nature Structural & Molecular Biology 25, 61–72. [DOI] [PMC free article] [PubMed] [Google Scholar]
- Hooper M, Hardy K, Handyside A, Hunter S, and Monk M (1987). HPRT-deficient (Lesch-Nyhan) mouse embryos derived from germline colonization by cultured cells. Nature 326, 292–295. [DOI] [PubMed] [Google Scholar]
- Hu G, Schones DE, Cui K, Ybarra R, Northrup D, Tang Q, Gattinoni L, Restifo NP, Huang S, and Zhao K (2011). Regulation of nucleosome landscape and transcription factor targeting at tissue-specific enhancers by BRG1. Genome Res 21, 1650–1658. [DOI] [PMC free article] [PubMed] [Google Scholar]
- Jain D, Baldi S, Zabel A, Straub T, and Becker PB (2015). Active promoters give rise to false positive “Phantom Peaks” in ChIP-seq experiments. Nucleic Acids Res 43, 6959–6968. [DOI] [PMC free article] [PubMed] [Google Scholar]
- Jin W, Tang Q, Wan M, Cui K, Zhang Y, Ren G, Ni B, Sklar J, Przytycka TM, Childs R, et al. (2015). Genome-wide detection of DNase I hypersensitive sites in single cells and FFPE tissue samples. Nature 510, 363–17. [DOI] [PMC free article] [PubMed] [Google Scholar]
- Kidder BL, Palmer S, and Knott JG (2009). SWI/SNF-Brg1 regulates self-renewal and occupies core pluripotency-related genes in embryonic stem cells. Stem Cells 27, 317–328. [DOI] [PubMed] [Google Scholar]
- King HW, and Klose RJ (2017). The pioneer factor OCT4 requires the chromatin remodeller BRG1 to support gene regulatory element function in mouse embryonic stem cells. Elife 6, e22631. [DOI] [PMC free article] [PubMed] [Google Scholar]
- Levasseur DN, Wang J, Dorschner MO, Stamatoyannopoulos JA, and Orkin SH (2008). Oct4 dependence of chromatin structure within the extended Nanog locus in ES cells. Genes & Development 22, 575–580. [DOI] [PMC free article] [PubMed] [Google Scholar]
- Liu Q, Jiang C, Xu J, Zhao M-T, Van Bortle K, Cheng X, Wang G, Chang HY, Wu JC, and Snyder MP (2017). Genome-Wide Temporal Profiling of Transcriptome and Open Chromatin of Early Cardiomyocyte Differentiation Derived From hiPSCs and hESCs. Circ. Res. 121, 376–391. [DOI] [PMC free article] [PubMed] [Google Scholar]
- Liu X, Wang C, Liu W, Li J, Li C, Kou X, Chen J, Zhao Y, Gao H, Wang H, et al. (2016). Distinct features of H3K4me3 and H3K27me3 chromatin domains in pre-mplantation embryos. Nature 537, 558–562. [DOI] [PubMed] [Google Scholar]
- Loh Y-H, Wu Q, Chew J-L, Vega VB, Zhang W, Chen X, Bourque G, George J, Leong B, Liu J, et al. (2006). The Oct4 and Nanog transcription network regulates pluripotency in mouse embryonic stem cells. Nat Genet 38, 431–440. [DOI] [PubMed] [Google Scholar]
- Long HK, Prescott SL, and Wysocka J (2016). Ever-Changing Landscapes: Transcriptional Enhancers in Development and Evolution. Cell 167, 1170–1187. [DOI] [PMC free article] [PubMed] [Google Scholar]
- Marinov GK, Williams BA, McCue K, Schroth GP, Gertz J, Myers RM, and Wold BJ (2014). From single-cell to cell-pool transcriptomes: stochasticity in gene expression and RNA splicing. Genome Res 24, 496–510. [DOI] [PMC free article] [PubMed] [Google Scholar]
- Meyer CA, and Liu XS (2014). Identifying and mitigating bias in next-generation sequencing methods for chromatin biology. Nat Rev Genet 15, 709–721. [DOI] [PMC free article] [PubMed] [Google Scholar]
- Mitsui K, Tokuzawa Y, Itoh H, Segawa K, Murakami M, Takahashi K, Maruyama M, Maeda M, and Yamanaka S (2003). The homeoprotein Nanog is required for maintenance of pluripotency in mouse epiblast and ES cells. Cell 113, 631–642. [DOI] [PubMed] [Google Scholar]
- Rotem A, Ram O, Shoresh N, Sperling RA, Goren A, Weitz DA, and Bernstein BE (2015). Single-cell ChIP-seq reveals cell subpopulations defined by chromatin state. Nat Biotech 33, 1165–1172. [DOI] [PMC free article] [PubMed] [Google Scholar]
- Sabo PJ, Hawrylycz M, Wallace JC, Humbert R, Yu M, Shafer A, Kawamoto J, Hall R, Mack J, Dorschner MO, et al. (2004). Discovery of functional noncoding elements by digital analysis of chromatin structure. Proc Natl Acad Sci USA 101, 16837–16842. [DOI] [PMC free article] [PubMed] [Google Scholar]
- Schmid M, Durussel T, and Laemmli UK (2004). ChIC and ChEC; genomic mapping of chromatin proteins. Mol Cell 16, 147–157. [DOI] [PubMed] [Google Scholar]
- Schmidl C, Rendeiro AF, Sheffield NC, and Bock C (2015). ChIPmentation: fast, robust, low-input ChIP-seq for histones and transcription factors. Nat Meth 12, 963–965. [DOI] [PMC free article] [PubMed] [Google Scholar]
- Skene PJ, and Henikoff S (2017). An efficient targeted nuclease strategy for high-resolution mapping of DNA binding sites. Elife 6, e21856. [DOI] [PMC free article] [PubMed] [Google Scholar]
- Skene PJ, Henikoff JG, and Henikoff S (2018). Targeted in situ genome-wide profiling with high efficiency for low cell numbers. Nature Protocols 13, 1006–1019. [DOI] [PubMed] [Google Scholar]
- Teif VB, Vainshtein Y, Caudron-Herger M, Mallm J-P, Marth C, Höfer T, and Rippe K (2012). Genome-wide nucleosome positioning during embryonic stem cell development. Nature Structural & Molecular Biology 19, 1185–1192. [DOI] [PubMed] [Google Scholar]
- Teytelman L, Thurtle DM, Rine J, and van Oudenaarden A (2013). Highly expressed loci are vulnerable to misleading ChIP localization of multiple unrelated proteins. Proc Natl Acad Sci USA 110, 18602–18607. [DOI] [PMC free article] [PubMed] [Google Scholar]
- Thurman RE, Rynes E, Humbert R, Vierstra J, Maurano MT, Haugen E, Sheffield NC, Stergachis AB, Wang H, Vernot B, et al. (2012). The accessible chromatin landscape of the human genome. Nature 489, 75–82. [DOI] [PMC free article] [PubMed] [Google Scholar]
- Torres-Padilla M-E, Bannister AJ, Hurd PJ, Kouzarides T, and Zernicka-Goetz M (2006). Dynamic distribution of the replacement histone variant H3.3 in the mouse oocyte and preimplantation embryos. Int. J. Dev. Biol 50, 1–7. [DOI] [PubMed] [Google Scholar]
- Whyte WA, Orlando DA, Hnisz D, Abraham BJ, Lin CY, Kagey MH, Rahl PB, Lee TI, and Young RA (2013). Master transcription factors and mediator establish super-enhancers at key cell identity genes. Cell 153, 307–319. [DOI] [PMC free article] [PubMed] [Google Scholar]
- Young RA (2011). Control of the embryonic stem cell state. Cell 144, 940–954. [DOI] [PMC free article] [PubMed] [Google Scholar]
- Yuan G-C, Cai L, Elowitz M, Enver T, Fan G, Guo G, Irizarry R, Kharchenko P, Kim J, Orkin S, et al. (2017). Challenges and emerging directions in single-cell analysis. Genome Biol 18, 84. [DOI] [PMC free article] [PubMed] [Google Scholar]
- Zaret KS, and Mango SE (2016). Pioneer transcription factors, chromatin dynamics, and cell fate control. Curr Opin Genet Dev 37, 76–81. [DOI] [PMC free article] [PubMed] [Google Scholar]
- Zwart W, Koornstra R, Wesseling J, Rutgers E, Linn S, and Carroll JS (2013). A carrier-assisted ChIP-seq method for estrogen receptor-chromatin interactions from breast cancer core needle biopsy samples. BMC Genomics 14, 232. [DOI] [PMC free article] [PubMed] [Google Scholar]
Associated Data
This section collects any data citations, data availability statements, or supplementary materials included in this article.
Supplementary Materials
Read density of IgG biological replicates over the established binding sites of CTCF (A) and H3K4me3 (B). Heatmaps are organized and sorted as in Fig. 1.
A Overlap of CTCF binding sites identified by uliCUT&RUN for various cell numbers. For each uliCUT&RUN replicate at each cell number, the number of peaks overlapping with established CTCF binding sites was determined. The color of each box reflects the fraction of binding sites in the lower cell number library that are shared with the higher cell number for each comparison. The number listed in each box is the number of overlapping peaks. B, Overlap of H3K4me3 binding sites. Data are depicted as in (A).
Read density of IgG biological replicates over established binding sites of OCT4 (A), SOX2 (B), NANOG (C), BRG1 (D), H3K27ac (E), and EZH2 (F). Established binding sites and sorting of heatmaps are identical to those in Fig. 3.
Motifs enriched in peaks of enrichment from 50- and 50,000-cell uliCUT&RUN experiments mapping OCT4 (A), SOX2 (B), and NANOG (C). Shown are the top five most significant motifs enriched within each set of peaks, including the DNA logo, its corresponding TF, and its p-value. Overlapping peaks between two biological replicates for each cell number were used for these analyses.
A, Test of flow sorting efficacy reveals highly efficient delivery of single cells to wells of a 96-well plate. Individual mESCs were sorted into 96-well plates in two biological replicates with Hoechst 33342 stain, and the number of Hoechst- stained cells were counted. B, Quantification of the number of reads covering the central 1 bp of established CTCF binding sites. Only binding sites with read coverage are shown. All CTCF single cells and binding sites were combined into one pie chart. C-E, Aggregate read enrichment for single cell maps after subtraction of control cell read density and stratification by multi-cell ChIP-seq peak intensity. Normalized read density from combined control (no antibody) single cell uliCUT&RUN maps was subtracted from normalized TF-specific read density for each quintile and plotted over binding sites for each factor. F, Distribution of single cell uliCUT&RUN reads over binding sites identified from multi-cell uliCUT&RUN maps. Five quintiles were determined from 50,000-cell uliCUT&RUN data for each factor, and single cell uliCUT&RUN reads falling into each quintile were quantified as in Figure 5C-D.
A, RT-qPCR of cytoplasmic RNAs from embryos injected with indicated esiRNAs at the one cell stage and cultured to blastocysts. **P<0.01, two-tailed Student’s t-test. N.S., not significant. B-C, Immunofluorescence for NANOG (B) or BRG1 (C) in blastocyst stage embryos upon KD of Nanog or Smarca4, respectively by injection of esiRNAs at the one cell stage, as above. D, Changes in NANOG enrichment following Smarca4 knockout ESCs, from analysis of previously published ESC ChIP-seq data (King and Klose, 2017). Replicates corresponding to each KO were averaged.