Abstract
The pentose phosphate pathway (PPP) is essential for reductive biosynthesis, antioxidant processes and nucleotide production. Common tracers such as [1,2-13C2]glucose rely on detection of 13C in lactate and require assumptions to correct natural 13C abundance. Here we introduce a novel and specific tracer of the PPP, [2,3-13C2]glucose. 13C NMR analysis of the resulting isotopomers is informative because [1,2-13C2]lactate arises from glycolysis and [2,3-13C2]lactate arises exclusively through the PPP. A correction for natural abundance is unnecessary. In rats receiving [2,3-13C2]glucose, the PPP was more active in the fed versus fasted state in the liver and the heart, consistent with increased expression of key enzymes in the PPP. Both the PPP and glycolysis were substantially increased in hepatoma compared to liver. In summary, [2,3-13C2]glucose and 13C NMR simplify assessment of the PPP.
Keywords: stable isotope, NADPH, ribose, glucose 6-phosphate dehydrogenase, glycolysis, NMR, hepatoma, lactate
Graphical Abstract
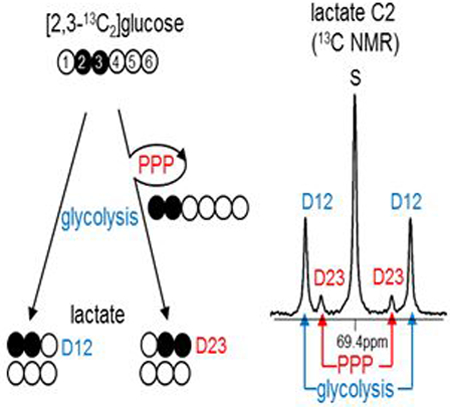
[2,3-13C2]glucose is a novel and specific tracer of the pentose phosphate pathway (PPP). 13C NMR analysis of lactate after the administration of [2,3-13C2]glucose informs PPP activity and glycolysis because [1,2-13C2]lactate arises from glycolysis and [2,3-13C2]lactate arises exclusively through the PPP. In rats receiving [2,3-13C2]glucose, the PPP was more active in the fed versus fasted state in most organs. Both the PPP and glycolysis were substantially increased in hepatoma compared to liver. [2,3-13C2]glucose and 13C NMR simplify assessment of the PPP.
The pentose phosphate pathway (PPP) plays a key role in reductive biosynthesis, antioxidant processes and cell proliferation. In the oxidative phase of the PPP, decarboxylation of glucose 6-phosphate (G6P) carbon 1 (C1) produces pentose and NADPH (Figure 1). Subsequent carbon rearrangements in the non-oxidative phase yield fructose 6-phosphate (F6P) or glyceraldehyde 3-phosphate (GA3P). NADPH is required for lipogenesis, cholesterol synthesis, or glutathione reduction while ribose 5-phosphate from the PPP is necessary for nucleotide synthesis. Although this metabolic pathway is critical for cell viability, detection of flux in the PPP can be challenging because it interacts with glycolysis (or gluconeogenesis) by sharing three intermediates - G6P, F6P and GA3P – and the flux is much lower compared to glycolysis.
Figure 1. PPP and carbon rearrangement.
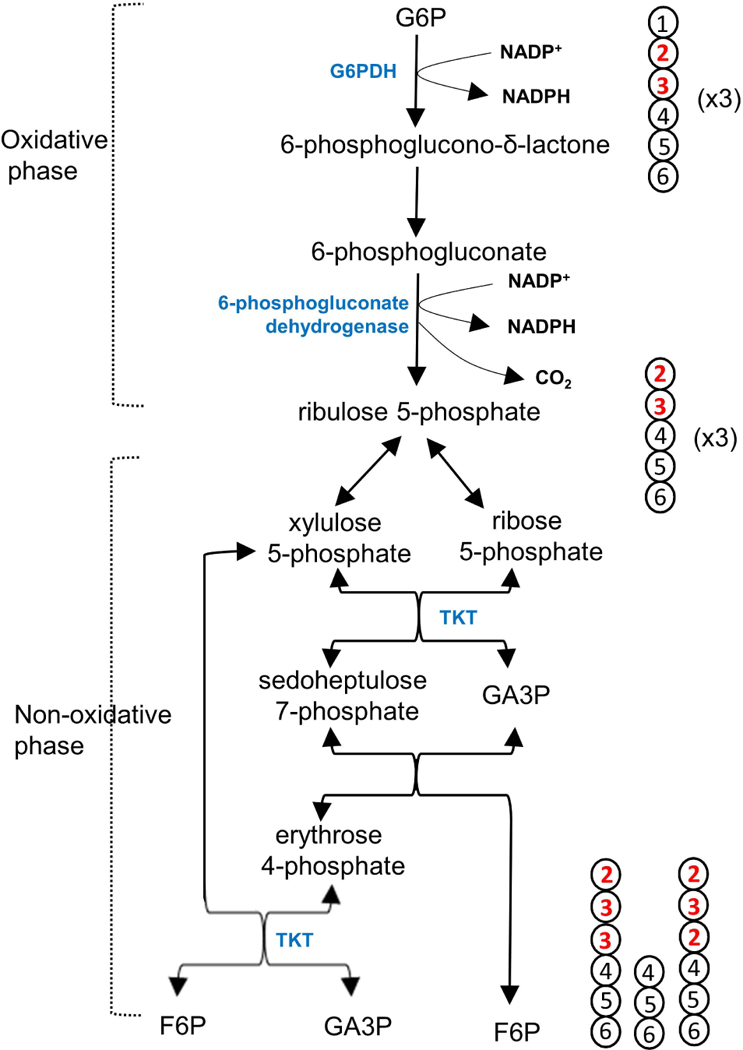
The entry of G6P (3x) into the PPP produces F6P (2x) and GA3P through the oxidative phase followed by carbon rearrangement in the non-oxidative phase. Carbon 1 of G6P is lost in the oxidative phase, producing pentose and NADPH. Pentose carbons are rearranged through multiple reactions catalyzed by TKT and transaldolase, producing F6P and GA3P. With the use of [2,3-13C2]glucose tracer, the PPP generates [1,2-13C2]F6P or [1,2,3-13C3]F6P. [1,2-13C2]F6P is produced through the tracer interaction with unlabeled intermediates of the pathway. [1,2,3-13C3]F6P is possible by [2,3-13C2]glucose interaction with another [2,3-13C2]glucose through the PPP. In the illustration, the numbers in circles (carbons) indicate the original carbon positions of G6P prior to the PPP.
Activity of the PPP has been explored in intact tissues using 14C-labeled tracers [1, 2]. More recently alternative approaches using 13C stable isotopes have been explored, but each method is associated with practical limitations. For example, [1,2-13C2]glucose has been used extensively to estimate PPP flux relative to glycolysis by monitoring the 13C distribution in lactate [3–5]. With this labeling pattern, glycolysis produces [2,3-13C2]lactate while flux in the PPP produces [3-13C1]lactate. In principle this is an attractive method, but the informative metabolic product –[3-13C1]lactate– generated from the PPP needs to be distinguished from natural 13C abundance [6–8]. With additional measurements, corrections are possible but require the assumption that the lactate pool is fully mixed. [U-13C3]glycerol was used to detect hepatic PPP activity by analyzing 13C-labeling patterns in glucose since the PPP shares intermediates with gluconeogenesis [9, 10]. However, this approach requires active gluconeogenesis. Hyperpolarized [1-13C1]gluconolactone detects the PPP by production of hyperpolarized 13C bicarbonate released in the 6-phosphogluconate dehydrogenase reaction [11]. Although eventually the method may be applicable for imaging the PPP, the technology is not widely available.
Here we introduce a novel tracer of the PPP, [2,3-13C2]glucose. The modification of 13C positions from [1,2-13C2]glucose markedly simplifies analysis with detection by NMR. Glycolysis of [2,3-13C2]glucose generates [1,2-13C2]lactate while flux through the PPP produces [2,3-13C2]lactate (Figure 2A). These lactate isotopomers – [1,2-13C2]lactate reflecting glycolysis and [2,3-13C2]lactate reflecting the PPP – are easily distinguished by 13C NMR because of the differences in 13C-13C scalar coupling constants (Figure 2B). The possibility of having two adjacent 13C-13C at natural abundance is practically zero (0.011 × 0.011 = ~ 0.0001). Thus the assay with [2,3-13C2]glucose eliminates corrections associated with natural abundance. Furthermore, the critical lactate isotopomer, [2,3-13C]lactate, cannot arise due to metabolism in the TCA cycle and export of pyruvate. Metabolism of [1,2-13C2]pyruvate via pyruvate carboxylation to [1,2-13C2]oxaloacetate or via pyruvate decarboxylation to [1-13C1]acetyl-CoA (or both pathways) cannot generate [2,3-13C2]oxaloacetate that would be a competing source of [2,3-13C2]pyruvate. Consequently, the appearance of [2,3-13C2]lactate from [2,3-13C2]glucose arises exclusively from the PPP.
Figure 2. [2,3-13C2]glucose for the assessment of the PPP and glycolysis.
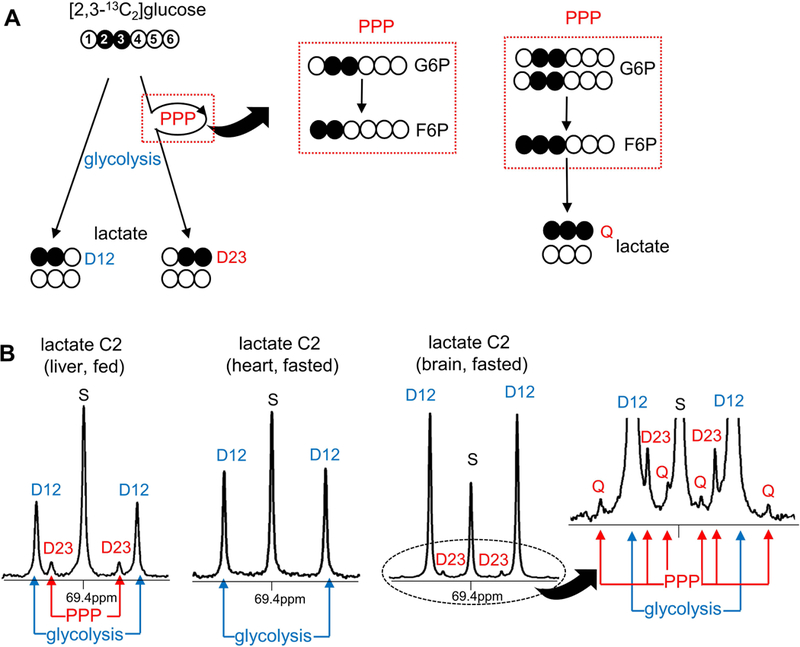
(A) Glycolysis of [2,3-13C2]glucose produces [1,2-13C2]lactate while the PPP activity leads to [2,3-13C2]lactate due to [1,2-13C2]F6P formation through the pathway. Two [2,3-13C2]glucose interactions through the PPP may generate [1,2,3-13C3]F6P and subsequently [U-13C3]lactate. (B) All resulting lactate isotopomers ([1,2-13C2], [2,3-13C2] and [U-13C3]) are distinguished by 13C NMR of lactate C2. D12 is the signal from [1,2-13C2]lactate (reflecting glycolysis) while D23 and Q are the signals from [2,3-13C2]- and [U-13C3]lactate, respectively (reflecting the PPP). Thus the ratio of D23 / D12 (or [D23+Q] / D12) represents PPP flux relative to glycolysis (PPP / glycolysis). The lack of D23 in fasted heart informs trivial PPP activity. A singlet (S) is natural 13C abundance. Abbreviations: D12, doublet from coupling of C1 with C2; D23, doublet from coupling of C2 with C3; Q, quartet from coupling C2 with both C1 and C3; open circle = 12C; black circle = 13C.
In the current study, we administered [2,3-13C2]glucose to healthy rats under differing nutritional conditions and hepatoma-bearing rats. The latter model was chosen because earlier studies suggest increased activity of the PPP in this cancer [12, 13]. The PPP activity in the liver and the heart was higher under a fed compared to a fasted condition. Both the PPP activity and glycolysis were dramatically increased in orthotopic hepatomas. We found that the new approach using [2,3-13C2]glucose and 13C NMR analysis substantially simplifies assessment of the PPP activity.
MATERIALS AND METHODS
Research Design
The study was approved by the Institutional Animal Care and Use Committee at the University of Texas Southwestern Medical Center. Male Sprague Dawley (SD) rats were purchased from Charles River Laboratories (Wilmington, MA), and they were placed on a 12-hour day/night cycle and had free access to standard rodent chow and water. We studied three groups of SD rats (328 ± 3 g). A group of rats (n=5) was fasted beginning at 4:00 pm for an overnight fast with free access to water before the study day (‘fasted’ group). Another group (n=5) had free access to food and water (‘fed’ group). Finally, for the study of hepatomas, rats received intrahepatic injections of rat hepatoma cells (N1S1; 1 × 10⁷ cells/100 μL) to establish orthotopic liver tumors. The progress of tumor growth was monitored by proton magnetic resonance imaging (1H MRI), and tumors grew ~10 mm-diameter at approximately three weeks of intrahepatic inoculation of the cells. These hepatoma-bearing rats (n=3) were fasted overnight beginning at 4:00 pm. All animals received [2,3-13C2]glucose (99%; 200 mg/kg; Omicron biochemicals, South Bend, IN) intraperitoneally under isoflurane anesthesia. After the administration, rats quickly awakened and rested for 60 min before sacrifice under anesthesia. Blood of healthy rats was drawn from the inferior vena cava. Brain, skeletal muscle from thighs, heart and liver were harvested and freeze-clamped using liquid nitrogen and kept at −80°C for subsequent processing. From hepatoma-bearing rats, tumors were dissected from liver, and tumor and surrounding liver tissues were freeze-clamped.
Sample processing for NMR analysis
For the extraction of water-soluble metabolites including lactate, blood (6 mL) and ground tissues from brain (1.5g), skeletal muscle (3g), heart (0.9g), liver (3g), and hepatoma (3g) were treated with perchloric acid (10%). The acid mixture was vortexed for 1 min, centrifuged, and the supernatant was transferred to a new tube. The extraction was repeated, and combined supernatant was neutralized with KOH, centrifuged, and lyophilized. The dried residue was dissolved in 2H2O (300 μL for extracts from liver, skeletal muscle or hepatoma, and 200 μL for extracts from blood, brain or heart) containing 4,4-dimethyl-4-silapentane-1-sulfonic acid (DSS; 5mM) as a NMR reference and the supernatant was transferred into to a NMR tube.
After 1H and 13C NMR acquisition, some samples from liver extracts were further purified using a column made of anion exchange resin (4 mL; dowex 1 Chloride/1X8–100; Sigma) since the spectral quality in lactate region was not satisfactory. The column loaded the extracts was eluted using DI water (100 mL) followed by acetic acid (1N, 15 mL). The pH of acetic acid portion was adjusted to 7.4 using KOH and lyophilized. The dried residue was dissolved in 2H2O for 13C NMR acquisition.
NMR spectroscopy and 1H MRI of hepatoma
All NMR spectra were collected using a Varian INOVA 14.1 T spectrometer (Agilent, Santa Clara, CA) equipped with a 3-mm broadband probe with the observe coil tuned to 13C (150 MHz) or 1H (600 MHz). 13C NMR spectra were collected using a 45° pulse (5.0 μs), 34,965 Hz sweep width, 104,986 data points, and a 1.5-sec interpulse delay at 25 °C. Proton decoupling was performed using a standard WALTZ-16 pulse sequence. Spectra were averaged ~23,000 scans requiring 20 hours. 1H NMR spectra were collected using a 90° pulse, 10,000 Hz sweep width, 19,979 data points, a 2.0-sec acquisition time, and a 1.0-sec interpulse delay at 25 °C. 1H spectra were averaged 16 scans. Spectra were analyzed using ACD/Labs NMR spectral analysis program (Advanced Chemistry Development, Inc., Toronto, Canada).
MRI of hepatoma-bearing rats under isoflurane anesthesia was collected using 4.7 T MR imaging system (Agilent) equipped with a 60 mm Quad Volume coil. T1- weighted MR images were acquired using 250-msec repetition time, 4.15-msec echo time, 70° flip angle, 65*65-cm field of view, 256 * 256 matrix and 2-mm section thickness.
RNA extraction and real-time quantitative PCR (RT–qPCR) analysis
Total RNA was extracted from tissues using TRIzol (Ambion, Carlsbad, CA). Complementary DNA (cDNA) was synthesized from 1 μg total RNA with oligo-dT primers using high capacity cDNA reverse transcription kit according to the manufacturer’s protocol (Applied Biosystems, Grand Island, NY) on the S1000™ Thermal cycler (Bio rad laboratories, Hercules, CA). RT–qPCR was performed with the iTaq™ Universal SYBR® Green Supermix (Bio rad laboratories, Hercules, CA) on the CFX384™ real time system (Bio rad laboratories, Hercules, CA). The results were normalized by glyceraldehyde 3-phosphate dehydrogenase (GAPDH) expression. The PCR primers are shown in Supplemental Table 1.
Assessment of the PPP activity using [2,3-13C2]glucose
Glycolysis of [2,3-13C2]glucose produces [1,2-13C2]lactate while the PPP leads to [2,3-13C2]lactate due to [1,2-13C2]F6P formation through the pathway (Figures 1 and 2). The entry of [2,3-13C2]glucose into the PPP produces [1,2-13C2]pentose after decarboxylation of glucose C1 in the oxidative phase (Figure 1). Carbons of [1,2-13C2]pentose are rearranged through multiple steps in the non-oxidative phase, generating [1,2-13C2]F6P and subsequently [2,3-13C2]lactate (Figure 2). Thus [1,2-13C2]lactate and [2,3-13C2]lactate reflect glycolysis and PPP activity, respectively, after the administration of [2,3-13C2]glucose. Interestingly, a small signal from [1,2,3-13C3]lactate (i.e., [U-13C3]lactate) was also detected in brain from three fasted animals in the current study. This can be explained by tracing the origins of carbons 1–3 in F6P produced through the PPP [2]. The production of [U-13C3]lactate requires [1,2,3-13C3]F6P formation through the PPP; C2-C3 of [2,3-13C2]G6P becoming C1-C2 of [1,2,3-13C3]F6P, and C2 or C3 of another [2,3-13C2]G6P becoming C3 of [1,2,3-13C3]F6P (Figure 1). The interaction of [2,3-13C2]glucose with another [2,3-13C2]glucose in the pathway produces [1,2,3-13C3]F6P that leads to [U-13C3]lactate (Figure 2A). Thus [U-13C3]lactate as well as [2,3-13C2]lactate are consequences of PPP activity.
All these resulting lactate isotopomers can be quantified by 13C NMR of lactate C2 at 69.4 ppm (Figure 2B). A singlet (S) reflects [2-13C1]lactate due to natural abundance. A doublet with 13C-13C coupling constant 55.4 Hz (D12) is the signal from [1,2-13C2]lactate while the other doublet with coupling constant 36.8 Hz (D23) is the signal from [2,3-13C2]lactate. A quartet (Q) reflects [U-13C3]lactate. Thus the ratio of D23 / D12 (or [D23 + Q] / D12 in the presence of Q) reflects a PPP flux relative to glycolysis.
The possibility of pyruvate regeneration through the TCA cycle should be considered. Pyruvate enters the TCA cycle via pyruvate carboxylase or pyruvate dehydrogenase, and the metabolism of [1,2-13C2]pyruvate (from glycolysis) through the TCA cycle does not generate a competing source of [2,3-13C2]pyruvate (Supplemental Figure 1A). However, the entry of [2,3-13C2]pyruvate (from the PPP) into the TCA cycle via pyruvate dehydrogenase may lead to [1,2-13C2]pyruvate; [2,3-13C2]pyruvate → [1,2-13C2]acetyl-CoA → [4,5-13C2]citrate → [4,5-13C2]α-ketoglutarate (↔ [4,5-13C2]glutamate) → [1,2-13C2]- or [3,4-13C2]malate (50%:50% due to symmetric molecules in the TCA cycle) → [1,2-13C2]- or [3-13C1]pyruvate (Supplemental Figure 1B). This entry of [2,3-13C2]pyruvate can be examined by the appearance of [4,5-13C2]glutamate since α-ketoglutarate is in exchange with glutamate. The potential contribution of [4,5-13C2]α-ketoglutarate to [1,2-13C2]pyruvate was roughly estimated using the ratio of [4,5-13C2]glutamate / [1,2-13C2]lactate (D45 in glutamate C4 / D12 in lactate C2 on 13C NMR). The ratio was 0.11 in brain tissues from fed animals, but it was trivial in other organs (Supplemental Figure 1C). Since only half of the α-ketoglutarate results in [1,2-13C2]pyruvate through the TCA cycle, the maximum contribution of the [1,2-13C2]pyruvate from the TCA cycle to total [1,2-13C2]pyruvate cannot exceed 6% in the brain of this study. The actual contribution is expected to be lower than 6% because the TCA cycle intermediates can be exported through metabolic network. Nevertheless, ignoring [1,2-13C2]pyruvate generation through the TCA cycle in the current work underestimates the ratio of PPP/glycolysis.
The PPP is active in erythrocytes and 13C-enriched lactate was present in blood. This may contaminate 13C-lactate produced by organ tissues in a whole animal study. Therefore we assumed that 13C-enriched lactate in an organ was predominately derived from tissue metabolism rather than contributed by blood within the organ. This assumption was validated using an erythrocyte-specific metabolite, 2,3-bisphosphoglycerate, as described below.
Quantitation of lactate, [1,2-13C2]lactate or [2,3-13C2]lactate
The relative concentration of lactate was measured by 1H NMR of perchloric acid extracts using 1H signal from the methyl group (1.35 ppm) of lactate normalized by a NMR reference (i.e., DSS). The relative concentrations of [1,2-13C2]-, [2,3-13C2]- and [U-13C3]lactate were measured by D12, D23 and Q signal, respectively, using 13C NMR of lactate C2 normalized by DSS.
Statistical Analysis
Data are presented as means ± SEM. Comparisons between groups were performed using two-tailed Student’s t test, where p < 0.05 was considered significant.
RESULTS
13C NMR and [2,3-13C2]glucose simplify the detection of PPP activity.
In 13C NMR spectra of the extracts derived from multiple organs of animals receiving [2,3-13C2]glucose, lactate C2 region at 69.4 ppm typically had 5 peaks with a singlet and two doublets (Figure 2B). The doublets from [2,3-13C2]lactate and [1,2-13C2]lactate were well resolved with 36.8-Hz coupling constant in D23 and 55.4-Hz in D12. These D23 and D12 are direct readouts of the PPP and glycolysis, respectively. The singlet was signal from natural 13C abundance, informing the pool size of lactate. However, there were a few exceptions with different labeling patterns in lactate C2; hearts from fasted rats had only 3 peaks – a singlet and D12 – while several brains from fasted animals had 9 peaks – a singlet, two doublets and a quartet (Q, Figure 2B). The absence of D23 in the fasted heart reflects trivial PPP activity. As noted, the quartet from [1,2,3-13C3]lactate is also evidence of the PPP activity. The quartet signal was smaller than doublet signals, but it was well resolved in the current work.
PPP activity is enhanced in the heart and liver of fed animals.
Based on the ratio of D23/D12 in lactate, the PPP flux relative to glycolysis was ranged 0 −16% in all studied organs - brain, skeletal muscle, heart and liver (Figure 3A-D). The relative PPP flux was higher under a fed compared to a fasted condition in all tissues. Aside from brain, the production of [2,3-13C2]lactate (normalized by DSS; D23/DSS) through the PPP was also enhanced under a fed condition in all other organs, noticeably liver and heart. Furthermore, the mRNA expressions of key PPP enzymes such as glucose 6-phosphate dehydrogenase (G6PDH) and transketolase (TKT) were significantly higher in these two organs under a fed state. Since NADPH from the PPP can be utilized in lipogenesis, lipogenic enzymes were further examined. The expressions of fatty acid synthase (FAS) and sterol regulatory element-binding protein-1c (SREBP1c) were increased in heart and dramatically enhanced in liver under a fed condition while they were not altered in brain and skeletal muscle. Glycolysis (D12/DSS) under a fed condition was decreased in brain, increased in heart, but not altered in skeletal muscle and liver compared to a fasted state (Fig 3).
Figure 3. PPP, glycolysis and mRNA of enzymes.
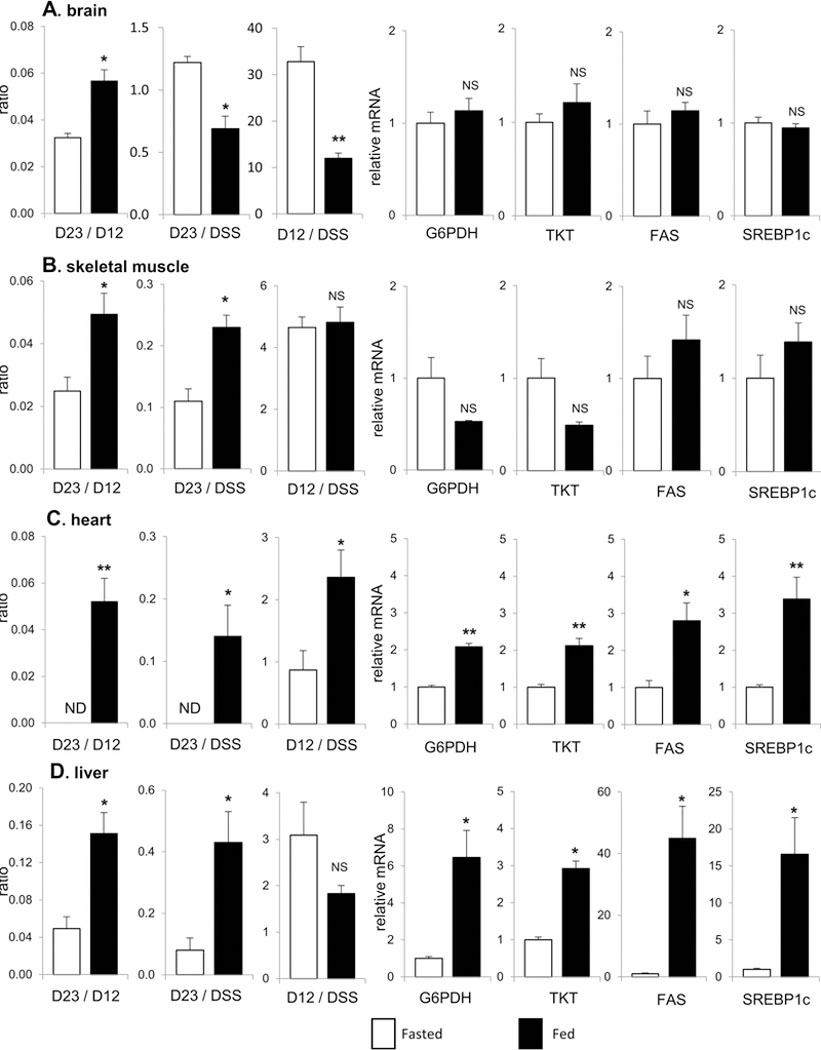
(A) In brain, the ratio of D23/D12 (PPP/glycolysis) is higher under a fed than a fasted condition. However, the levels of D23 and D12 (reflecting [2,3-13C2]lactate production through the PPP and [1,2-13C2]lactate through glycolysis, respectively) are lower under a fed condition. The expressions of G6PDH, TKT, FAS and SREBP1c are not altered under a fed compared to a fasted state. (B) In skeletal muscle, the ratio of D23/D12 and the level of D23 are higher under a fed than a fasted condition. The level of D12 and the expressions of G6PDH, TKT, FAS and SREBP1c are not altered under a fed condition. (C) In heart, the ratio of D23/D12, the level of D23 and the level of D12 all are higher under a fed compared to a fasted condition. The expressions of G6PDH, TKT, FAS and SREBP1c are also higher under a fed condition. (D) In liver, the ratio of D23/D12 and the level of D23 are substantially higher under a fed than a fasted condition while the level of D12 is not altered. The expressions of G6PDH, TKT, FAS and SREBP1c all are higher under a fed condition. Abbreviations: D12, doublet from coupling of C1 with C2; D23, doublet from coupling of C2 with C3; DSS, 4,4-dimethyl-4-silapentane-1-sulfonic acid (NMR reference); ND, not detected; NS, not significant; Data are means ± SEM (n=5); ∗, p<0.05; ∗∗, p<0.001
PPP activity is increased in hepatomas.
A typical MR image of hepatoma and 13C NMR of lactate C2 in hepatoma extracts are shown in Figure 4A-B. The ratio of D23/D12 in hepatomas was not altered, but the levels of both [2,3-13C2]lactate (D23/DSS) and [1,2-13C2]lactate (D12/DSS) were substantially higher compared to surrounding liver tissues; [2,3-13C2]lactate was 9-fold and [1,2-13C2]lactate was 8-fold increase. The concentration of lactate was also much higher in hepatomas (Figure 4C). Consistent with the NMR data, the mRNA expressions of G6PDH and TKT were higher in hepatomas than the liver surrounding the tumors. The expression of FAS was not altered and that of SREBP1c was decreased in hepatomas (Figure 4D).
Figure 4. PPP activity in hepatoma.
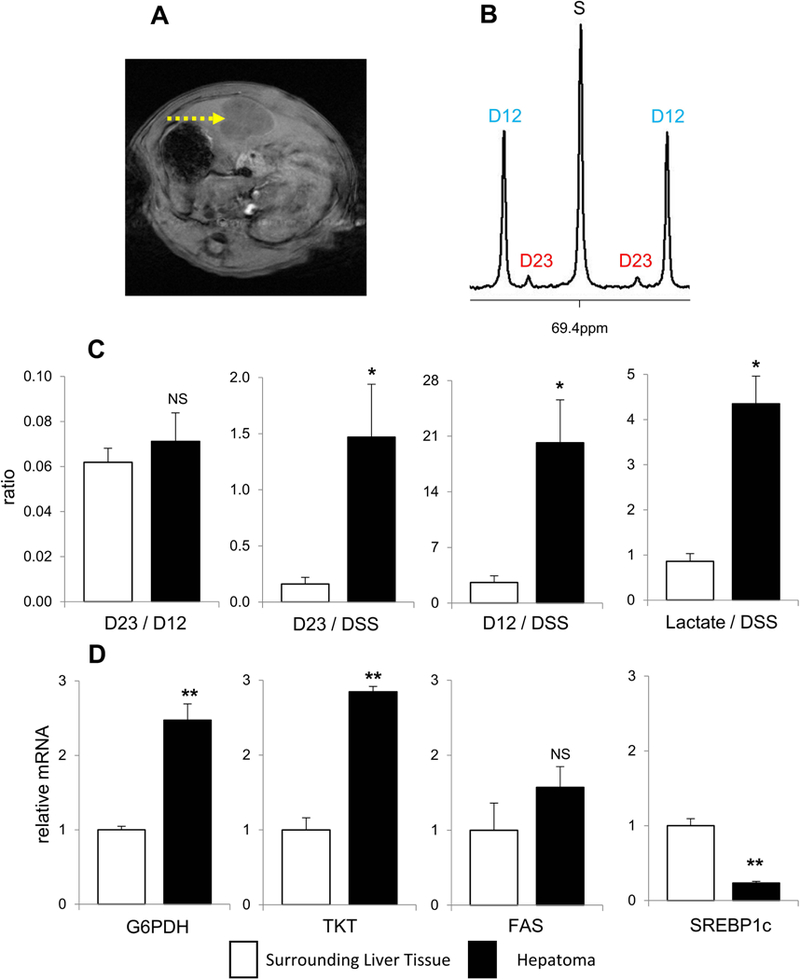
(A) T1-weighted MRI shows hepatoma (arrow) of a rat on the 14th day after the inoculation of tumor cells. (B) 13C NMR of lactate C2 from hepatoma shows the signal from [2,3-13C2]lactate (D23) produced through the PPP and the signal from [1,2-13C2]lactate (D12) through glycolysis. (C) The ratio of D23/D12 (PPP/glycolysis) is the same between hepatomas and surrounding liver tissues. However, the level of D23 (PPP activity), the level of D12 (glycolysis), and the concentration of lactate all are higher in hepatomas compared to surrounding liver tissues. (D) The mRNA expressions of G6PDH and TKT are higher, but the expression of SREBP1c is lower in hepatomas compared to surrounding liver tissue. The expression of FAS is not altered in hepatomas. Data are means ± SEM (n=3); ∗, p<0.05; ∗∗, p<0.001.
DISCUSSION
We demonstrated that [2,3-13C2]glucose is a convenient tracer to detect PPP activity by monitoring 13C distribution in lactate. In the 13C NMR spectrum of lactate C2, the areas of D23 and D12 are direct readouts of the PPP and glycolysis, respectively. The PPP activity in heart and liver were higher under a fed compared to a fasted condition. Both the PPP and glycolysis were substantially increased in hepatomas. Overall the PPP activity measured by NMR was consistent with the gene expressions of G6PDH and TKT.
Like many earlier studies, this method relies on detection of the 13C distribution in lactate. However, there are multiple advantages with the use of [2,3-13C2]glucose compared to alternative tracers. Most importantly, analysis is simple since it does not require correction for natural abundance. In the case with [1,2-13C2]glucose tracer, the PPP activity leads to [3-13C1]lactate – a single-labeled lactate. This needs to be distinguished from natural abundance to estimate the PPP activity, which requires assumptions like a steady state and full mixing in a lactate pool. Such assumptions and corrections are unnecessary with [2,3-13C2]glucose due to essentially zero probability of having two adjacent 13C-13C at natural abundance. In the current study, the quantitation of [2,3-13C2]- and [1,2-13C2]lactate using a NMR reference is another advantage, which prevents potentially misleading information from the ratio of D23/D12 (i.e., PPP/glycolysis) alone. As an example, brain had a higher ratio of PPP/glycolysis under a fed compared to a fasted state. However, this result does not mean higher PPP activity under the condition because the production of [2,3-13C2]lactate through the PPP (D23/DSS) was actually somewhat lower under a fed compared to a fasted condition. This difference can be easily clarified by much reduced glycolysis (D12/DSS) in the brain under a fed condition (Figure 3A). Another example is the result from hepatoma-bearing rats. The ratio of D23/D12 (PPP/glycolysis) was the same between hepatomas and surrounding liver tissues. However, quantitation of [2,3-13C2]- and [1,2-13C2]lactate demonstrated dramatic increases in both the PPP activity and glycolysis in the tumors (Figure 4C).
It is important to be aware that [2,3-13C2]glucose produces [U-13C3]lactate through the PPP (in addition to [2,3-13C2]lactate) if the fractional enrichment in the glucose pool is high. Aside from brain under a fasted condition, [U-13C3]lactate was not detected in other organs or brain from fed animals in the current study. This must be due to tracer dilution by endogenous glucose or stored glycogen. Since the possibility of [1,2,3-13C3]F6P generation (and consequently [U-13C3]lactate) must be higher with a higher fraction of [2,3-13C2]glucose, we further examined 13C enrichment of glucose using NMR analysis of β-glucose C3 (at 77.0 ppm) assuming a singlet as natural abundance. Indeed, the brain from fasted animals had the highest enrichment - 18% - by [2,3-13C2]glucose. Other organs and hepatomas had less than 10% enrichment (Figure 5). Organs from fed animals had lower enrichments by [2,3-13C2]glucose compared to the ones from fasted animals.
Figure 5. 13C enrichment of glucose in organs of rats after the load of [2,3-13C2]glucose.
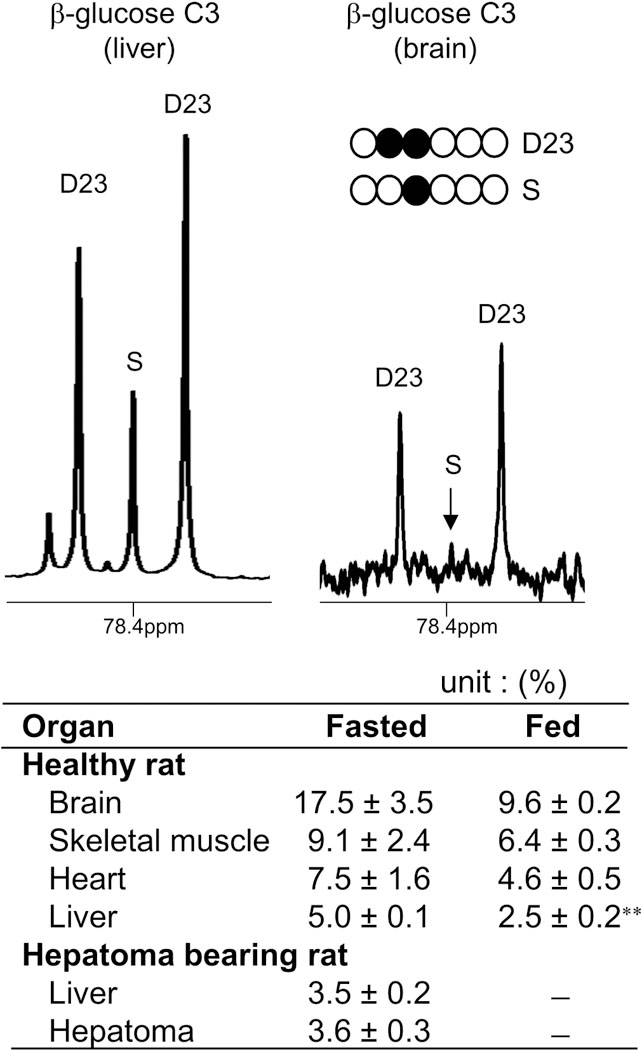
13C NMR shows the signal from β-glucose C3 of liver or brain tissue extracts from a fasted animal. 13C enrichment by [2,3-13C2]glucose was calculated by assuming a singlet as natural abundance. The table shows the enrichments in the organs of animals after 60 min of [2,3-13C2]glucose administration. Data are means ± SEM (n=3–5); ∗∗, p<0.001.
The PPP flux was much less compared to glycolysis in most organs regardless of nutritional states, having less than 10% of glycolysis. This is consistent with previous reports measured by other tracers [14]. One exception was the liver from fed animals with 15%. Fed livers also showed the highest increment in the expressions of lipogenic enzymes, which is also consistent with previous reports [15, 16]. In theory, NADPH from the PPP can be utilized in antioxidant processes or lipogenesis. However, we demonstrated previously that the PPP activity in liver paralleled lipogenesis rather than antioxidant processes [17]. This study confirmed the significance of the PPP for reductive biosynthesis in the liver under a fed condition. The PPP has also received attention in cancer studies because ribose is necessary for nucleotide synthesis and NADPH for anabolic metabolism to support cell growth [5, 18–21]. PPP activity in tumors has been considered high since the expressions of its enzymes were increased in many cancer cells [22–24]. In addition, silencing of G6PDH and TKT arrested metabolic processes for anabolic reactions in a breast cancer cell line [25]. In a mouse model of human brain tumor, the ratio of PPP/glycolysis measured by [1,2-13C2]glucose was not altered [5]. A similar result was obtained in orthotopic hepatoma using [2,3-13C2]glucose in the current work, but we further demonstrated that [2,3-13C2]lactate produced through the PPP was actually dramatically increased in the tumor by quantifying the lactate.
In the current study with whole animals, 13C-labeling patterns of lactate from organ extracts could be contaminated by lactate from blood circulation within the organ. This possibility was investigated by examining a characteristic metabolite in blood. Unique among all cells, erythrocytes maintain a high concentration of 2,3-bisphosphoglycerate that is formed from 1,3-bisphosphoglycerate during glycolysis. We found that the signal from 2,3-bisphosphoglycerate (C1 at 179.0 ppm) was three- to five-fold of the signal from lactate (C1 at 183.2 ppm) in blood extracts (Figure 6). Thus, if the lactate from the circulation contributed significantly to tissue lactate, we would expect signal from 2,3-bisphosphoglycerate in the organ extracts. However, it was not detected in any organs examined, demonstrating minimal contamination from the lactate of blood.
Figure 6. NMR signals of brain extracts without contamination from blood.
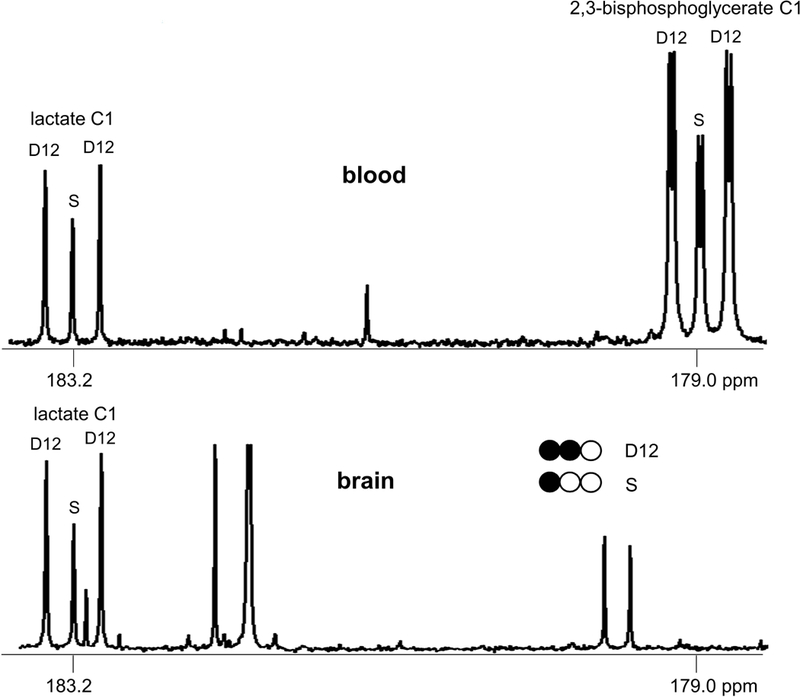
13C NMR spectra show the signals from lactate and/or 2,3-bisphosphoglycerate in the perchloric acid extracts of blood and brain from a rat receiving [2,3-13C2]glucose. 2,3-bisphosphoglycerate is a unique metabolite in erythrocytes. In blood extracts of this animal, the signal from 2,3-bisphosphoglycerate is 4-fold of that from lactate. The absence of 2,3-bisphosphoglycerate signal of the brain extracts demonstrates minimal contamination by blood. Thus 13C-labeling pattern of lactate in the brain extracts essentially reflects brain metabolism only. Similar observations were made in other organ tissues.
In summary, [2,3-13C2]glucose is a convenient tracer to measure the PPP activity using 13C NMR. It is free from corrections for natural abundance and [2,3-13C2]lactate from the glucose exclusively reflects the PPP activity without a competing source generated through the metabolic network of mammalian tissues. Since the PPP plays a pivotal role in multiple biochemical processes, we envision that the novel tracer will be useful in studies involving cancer, obesity or oxidative stress.
Supplementary Material
Acknowledgements:
We thank Xiaodong Wen and Rebecca E. Murphy for excellent technical support. This study was supported by the National Institutes of Health [DK099289, EB015908 and DK058398].
ABBREVIATIONS:
- DSS
4,4-dimethyl-4-silapentane-1-sulfonic acid
- F6P
fructose 6-phosphate
- FAS
fatty acid synthase
- G6P
glucose 6-phosphate
- G6PDH
glucose 6-phosphate dehydrogenase
- GA3P
glyceraldehyde 3-phosphate
- GAPDH
glyceraldehyde 3-phosphate dehydrogenase
- Glu
glutamate
- α-kG
α-ketoglutarate
- OAA
oxaloacetate
- PC
pyruvate carboxylase
- PDH
pyruvate dehydrogenase (PDH)
- PPP
pentose phosphate pathway
- SREBP1c
sterol regulatory element-binding protein-1c
- TKT
transketolase
REFERENCES
- 1.Scofield RF, Kosugi K, Chandramouli V, Kumaran K, Schumann WC, Landau BR. The nature of the pentose pathway in liver. J Biol Chem 1985;260:15439–15444. [PubMed] [Google Scholar]
- 2.Magnusson I, Chandramouli V, Schumann WC, Kumaran K, Wahren J, Landau BR. Pentose pathway in human liver. Proc Natl Acad Sci USA 1988;85:4682–4685. [DOI] [PMC free article] [PubMed] [Google Scholar]
- 3.Lee WN, Boros LG, Puigjaner J, Bassilian S, Lim S, Cascante M. Mass isotopomer study of the nonoxidative pathways of the pentose cycle with [1,2-13C2]glucose. Am J Physiol 1998;274:E843–E851. [DOI] [PubMed] [Google Scholar]
- 4.Miccheli A, Tomassini A, Puccetti C, Valerio M, Peluso G, Tuccillo F, Calvani M, Manetti C, Conti F. Metabolic profiling by 13C-NMR spectroscopy: [1,2-13C2]glucose reveals a heterogeneous metabolism in human leukemia T cells. Biochimie 2006; 88:437–448. [DOI] [PubMed] [Google Scholar]
- 5.Marin-Valencia I, Cho SK, Rakheja D, Hatanpaa KJ, Kapur P, Mashimo T, Jindal A, Vemireddy V, Good LB, Raisanen J, Sun X, Mickey B, Choi C, Takahashi M, Togao O, Pascual JM, Deberardinis RJ, Maher EA, Malloy CR, Bachoo RM. Glucose metabolism via the pentose phosphate pathway, glycolysis and Krebs cycle in an orthotopic mouse model of human brain tumors. NMR Biomed 2012;25:1177–1186. [DOI] [PMC free article] [PubMed] [Google Scholar]
- 6.Fernandez CA, Des Rosiers C, Previs SF, David F, Brunengraber H. Correction of 13C mass isotopomer distributions for natural stable isotope abundance. J Mass Spectrom 1996;31:255–262. [DOI] [PubMed] [Google Scholar]
- 7.Hellerstein MK, Neese RA. Mass isotopomer distribution analysis at eight years: theoretical, analytic, and experimental considerations. Am J Physiol 1999;276:E1146–E1170. [DOI] [PubMed] [Google Scholar]
- 8.Midani FS, Wynn ML, Schnell S. The importance of accurately correcting for the natural abundance of stable isotopes. Anal Biochem 2017;520:27–43. [DOI] [PMC free article] [PubMed] [Google Scholar]
- 9.Jin ES, Sherry AD, Malloy CR. Interaction between the pentose phosphate pathway and gluconeogenesis from glycerol in the liver. J Biol Chem 2014;289:32593–32603. [DOI] [PMC free article] [PubMed] [Google Scholar]
- 10.Jin ES, Sherry AD, Malloy CR. An oral load of [13C3]glycerol and blood NMR analysis detect fatty acid esterification, pentose phosphate pathway, and glycerol metabolism through the tricarboxylic acid cycle in human liver. J Biol Chem 2016;291:19031–19041. [DOI] [PMC free article] [PubMed] [Google Scholar]
- 11.Moreno KX, Harrison CE, Merritt ME, Kovacs Z, Malloy CR, Sherry AD. Hyperpolarized δ-[1-13 C]gluconolactone as a probe of the pentose phosphate pathway. NMR Biomed 2017;30: e3713. [DOI] [PMC free article] [PubMed] [Google Scholar]
- 12.Yin X, Tang B, Li JH, Wang Y, Zhang L, Xie XY, Zhang BH, Qiu SJ, Wu WZ, Ren ZG. ID1 promotes hepatocellular carcinoma proliferation and confers chemoresistance to oxaliplatin by activating pentose phosphate pathway. J Exp Clin Cancer Res 2017;36:166. [DOI] [PMC free article] [PubMed] [Google Scholar]
- 13.Kowalik MA, Columbano A, Perra A. Emerging Role of the Pentose Phosphate Pathway in Hepatocellular Carcinoma. Front Oncol 2017;7:87. [DOI] [PMC free article] [PubMed] [Google Scholar]
- 14.Jalloh I, Carpenter KL, Grice P, Howe DJ, Mason A, Gallagher CN, Helmy A, Murphy MP Menon DK, Carpenter TA, Pickard JD, Hutchinson PJ. Glycolysis and the pentose phosphate pathway after human traumatic brain injury: microdialysis studies using 1,2-13C2 glucose. J Cereb Blood Flow Metab 2015;35: 111–120. [DOI] [PMC free article] [PubMed] [Google Scholar]
- 15.Horton JD, Bashmakov Y, Shimomura I, Shimano H. Regulation of sterol regulatory element binding proteins in livers of fasted and refed mice. Proc Natl Acad Sci U S A 1998;95:5987–5992. [DOI] [PMC free article] [PubMed] [Google Scholar]
- 16.Kamei Y, Miura S, Suganami T, Akaike F, Kanai S, Sugita S, Katsumata A, Aburatani H, Unterman TG, Ezaki O, Ogawa Y. Regulation of SREBP1c gene expression in skeletal muscle: role of retinoid X receptor/liver X receptor and forkhead-O1 transcription factor. Endocrinology 2008;149:2293–2305. [DOI] [PubMed] [Google Scholar]
- 17.Jin ES, Lee MH, Murphy RE, Malloy CR. Pentose phosphate pathway activity parallels lipogenesis but not antioxidant processes in rat liver. Am J Physiol Endocrinol Metab 2018;314:E543–E551. [DOI] [PMC free article] [PubMed] [Google Scholar]
- 18.Patra KC, Hay N. The pentose phosphate pathway and cancer. Trends Biochem Sci 2014;39:347–354. [DOI] [PMC free article] [PubMed] [Google Scholar]
- 19.Jiang P, Du W, Wu M. Regulation of the pentose phosphate pathway in cancer. Protein Cell 2014;5: 592–602. [DOI] [PMC free article] [PubMed] [Google Scholar]
- 20.Vander Heiden MG, Cantley LC, Thompson CB. Understanding the Warburg effect: the metabolic requirements of cell proliferation. Science 2009;324:1029–1033. [DOI] [PMC free article] [PubMed] [Google Scholar]
- 21.Boros LG, Torday JS, Lim S, Bassilian S, Cascante M, Lee WN. Transforming growth factor beta2 promotes glucose carbon incorporation into nucleic acid ribose through the nonoxidative pentose cycle in lung epithelial carcinoma cells. Cancer Res 2000;60:1183–1185. [PubMed] [Google Scholar]
- 22.Vizán P, Alcarraz-Vizán G, Díaz-Moralli S, Solovjeva ON, Frederiks WM, Cascante M. Modulation of pentose phosphate pathway during cell cycle progression in human colon adenocarcinoma cell line HT29. Int J Cancer 2009;124:2789–2796. [DOI] [PubMed] [Google Scholar]
- 23.Langbein S, Frederiks WM, zur Hausen A, Popa J, Lehmann J, Weiss C, Alken P, Coy JF. Metastasis is promoted by a bioenergetic switch: new targets for progressive renal cell cancer. Int J Cancer 2008;122: 2422–2428. [DOI] [PubMed] [Google Scholar]
- 24.Kowalik MA, Columbano A, Perra A. Emerging Role of the Pentose Phosphate Pathway in Hepatocellular Carcinoma. Front Oncol 2017;7:87. [DOI] [PMC free article] [PubMed] [Google Scholar]
- 25.Benito A, Polat IH, Noé V, Ciudad CJ, Marin S, Cascante M. Glucose-6-phosphate dehydrogenase and transketolase modulate breast cancer cell metabolic reprogramming and correlate with poor patient outcome. Oncotarget 2017;8:106693–106706. [DOI] [PMC free article] [PubMed] [Google Scholar]
Associated Data
This section collects any data citations, data availability statements, or supplementary materials included in this article.


