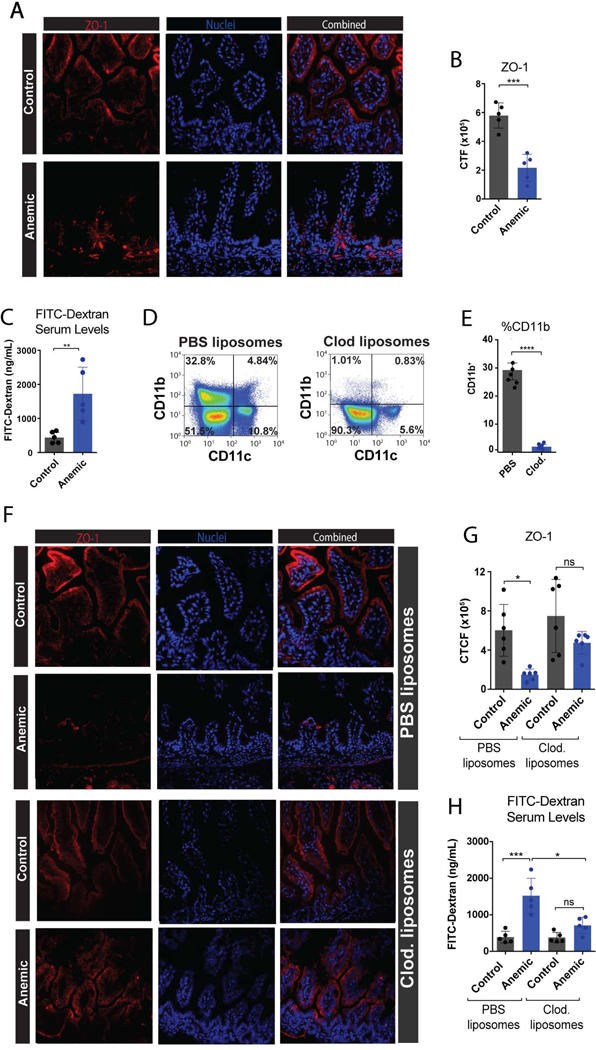
Figure 6. Anemia induces a decrease in epithelial barrier function through macrophages.

(A) Fluorescence microscopy imaging of intestines isolated from control or anemic pups at P8, followed by staining for ZO-1 (red) and nuclei (DAPI) (blue). (B) Quantification of ZO-1 staining in 6A. (C) Quantification of FITC-Dextran detectable in serum following oral gavage into control or anemic neonates. (D) Representative flow dot plots showing number of CD11b+ macrophages following treatment with PBS control liposomes or clodronate liposomes. (E) Quantification of CD11b+ macrophages isolated from neonatal intestines following treatment with PBS control liposomes or clodronate liposomes as indicated. (F) Fluorescence microscopy imaging of intestines isolated from control or anemic pups at P8 with or without clodronate treatment as indicated. (G) Quantification of ZO-1 staining in 6F. (H) Quantification of FITC-Dextran detectable in serum following oral gavage into control or anemic neonates with or without clodronate treatment as indicated. CTF = corrected total fluorescence. Data are presented as mean ± SEM, ns = non significant, *P < .05, **P < .01, ***P < .001, ****P < .0001.
