EVOLUTION Correction for “Conserved transcriptomic profiles underpin monogamy across vertebrates,” by Rebecca L. Young, Michael H. Ferkin, Nina F. Ockendon-Powell, Veronica N. Orr, Steven M. Phelps, Ákos Pogány, Corinne L. Richards-Zawacki, Kyle Summers, Tamás Székely, Brian C. Trainor, Araxi O. Urrutia, Gergely Zachar, Lauren A. O’Connell, and Hans A. Hofmann, which was first published January 22, 2019; 10.1073/pnas.1813775116 (Proc Natl Acad Sci USA 116:1331–1336).
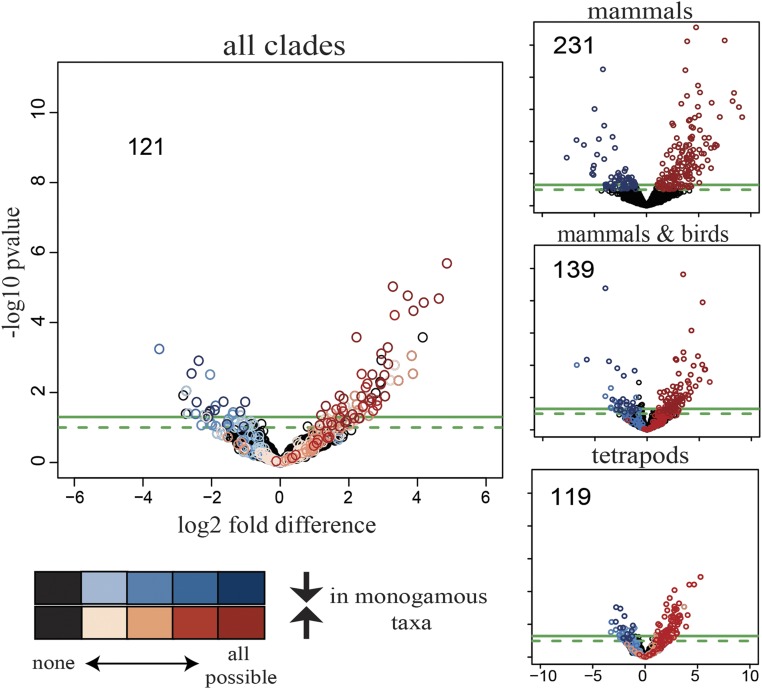
The authors wish to note the following: “When conducting the DESeq2 analyses on the orthologous gene groups (OGGs), the wrong data frame was called in R due to a naming error. Because of how different data frames were generated throughout the analysis pipeline, this error was reproduced consistently, introducing a systematic error. The numbers of concordantly regulated OGGs as shown in the various panels of Fig. 3 in the main paper have now been updated. Instead of the original 123 genes, there are now 121 genes, with 50 genes maintained in the corrected analysis.
Fig. 3.
Volcano plots indicating which of the 1,979 OGGs identified across all clades are differentially expressed at different taxonomic levels (mammals only, mammals and birds, tetrapods, all clades). Differential expression analysis was performed using DESeq2, where the monogamous (nonmonogamous) species of each clade were included as interspecific replicates of monogamy (nonmonogamy). Black circles show no differential expression at any taxonomic level. Differential expression analysis was performed on distinct evolutionary subgroups: mammals only (231 OGGs concordantly regulated), mammals and birds (139 OGGs), tetrapods (i.e., including frogs; 119 OGGs), and all four clades of vertebrates (i.e., including fishes; 121 OGGs). OGGs with a –log10 P value > 1 and a log2 fold-difference less than −1 (blue) or greater than 1 (red), respectively, are highlighted. The darker each circle, the more concordant across clades is the expression of the OGG that it represents. As more lineages are added to the analysis, more OGGs that are significant in one analysis fall below the significance threshold in another; however, adding species pairs increases the statistical power due to the increased number of interspecific replicates; thus, with the exception of evolutionary-subgroup mammals only versus mammals and birds, the decrease in number of OGGs meeting our threshold cutoff is small.
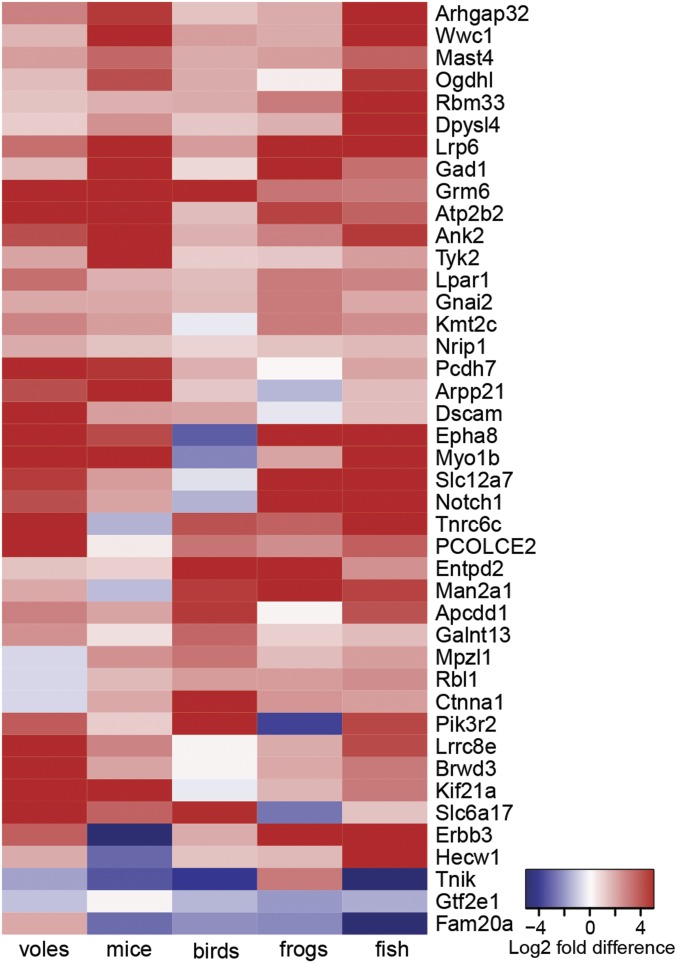
“In addition, the heatmap of candidate genes shown in the original Fig. 5 is incomplete: In the corrected analysis, there are 42 candidate genes that fit our candidate gene criteria [i.e., significant in DESeq2 analysis of all clades, greater than ±1 log2 fold-difference between the species pairs, and above threshold in 6 of 10 Rank-Rank Hypergeometric Overlap (RRHO) pairwise analyses]. This list contains all but 4 of the 24 genes previously reported in Fig. 5.”
Fig. 5.
Discovery of monogamy candidate genes (OGGs). To ensure a rigorous and conservative approach toward identifying OGGs robustly associated with monogamy across clades, any given gene/OGG had to fulfill two selection criteria. First, an OGG had to show a ±1 log2 fold expression difference between the monogamous and nonmonogamous species in at least four clades. Second, an OGG had to be among the most up- or the most down-regulated in 6 of the 10 RRHO analyses (as shown in Fig. 4); this again required an OGG to be concordantly expressed in at least four of the five lineages. Which clade (if any) is nonconcordant can vary for each OGG. Relative expression levels of these candidates are illustrated in the heatmap. Note that no clade is more often discordant than any other (SI Appendix, Table S7).
The corrected Fig. 3 and Fig. 5 appear below, along with their respective legends; the legend for Fig. 3 has been corrected. For the supporting information, the SI Appendix has been updated online to correct Fig. S5, its legend, and Table S7; and Datasets S1 and S2 have also been corrected online.


