

Abstract
Stem cell‐derived exosomes have exhibited promise for applications in tissue regeneration. However, one major problem for stem cell‐derived exosome therapies is identifying appropriate source cells. In the present study, we aimed to compare the bone regenerative effect of exosomes secreted by bone marrow mesenchymal stem cells (BMSCs) derived from type 1 diabetes rats (dBMSC‐exos) and exosomes secreted by BMSCs derived from normal rats (nBMSC‐exos). BMSCs were isolated from rats with streptozotocin‐induced diabetes and normal rats. dBMSC‐exos and nBMSC‐exos were isolated by an ultracentrifugation method and identified. The effects of dBMSC‐exos and nBMSC‐exos on the proliferation and migration of BMSCs and human umbilical vein endothelial cells (HUVECs) were investigated. The effects of exosomes on the osteogenic differentiation of BMSCs and the angiogenic activity of HUVECs were compared. Finally, a rat calvarial defect model was used to compare the effects of exosomes on bone regeneration and neovascularization in vivo. In vitro, dBMSC‐exos and nBMSC‐exos both enhanced the osteogenic differentiation of BMSCs and promoted the angiogenic activity of HUVECs, but nBMSC‐exos had a greater effect than dBMSC‐exos. Similarly, in vivo, both dBMSC‐exos and nBMSC‐exos promoted bone regeneration and neovascularization in rat calvarial defects, but the therapeutic effect of nBMSC‐exos was superior to that of dBMSC‐exos. The present study demonstrates for the first time that the bone regenerative effect of exosomes derived from BMSCs is impaired in type 1 diabetes, indicating that for patients with type 1 diabetes, the autologous transplantation of BMSC‐exos to promote bone regeneration may be inappropriate. stem cells translational medicine 2019;8:593–605
Keywords: Exosomes, Type 1 diabetes, Osteogenesis, Angiogenesis, Bone regeneration
Significance Statement.
Exosomes, originating from the endosomes of parental cells, are highly stable in terms of cargo storage and therefore faithfully reflect the genomic characteristics of their parent cell. Thus, one major problem for stem cell‐derived exosome therapies is identifying appropriate source cells. In the present study, it was found for the first time that diabetes mellitus (DM) impairs the bone regenerative effect of exosomes derived from bone marrow mesenchymal stem cells (BMSC‐exos). This reveals that for patients with DM, the autologous transplantation of BMSC‐exos to promote bone regeneration may be inadequate. Considering that patients with DM themselves are more susceptible to impaired bone healing and osteonecrosis, there is a compelling need to develop bone reparative strategies specifically targeting the population of patients with DM. Therefore, the findings are of great significance for the future clinical translation of BMSC‐exos‐based therapies.
Introduction
In the past decade, stem cell‐derived exosomes have gained great importance in regenerative medicine and have exhibited promise for clinical translation. However, one major problem for stem cell‐derived exosome therapies is identifying appropriate source cells 1.
Exosomes originate from the endosomes of parental cells and thus possess the biological characteristics of source cells, such as the surface markers and the protein, RNA and DNA cargo 1, 2. In a previous study, we found that exosomes derived from different cell types exhibited different therapeutic effects 3. Moreover, it has been reported that characteristics of the microenvironment of parental cells, such as hypoxia, may also influence the function of exosomes produced by these cells 4, 5. It is therefore critical to carefully consider the biological characteristics of the cell of origin and use the appropriate source cells for therapeutic purposes.
Type 1 diabetes (T1DM) is a chronic autoimmune disease that leads to the destruction of pancreatic β cells and is characterized by insulin deficiency and resultant hyperglycemia, and it affects approximately 1.25 million people in the U.S. 6, 7. Reports have indicated that T1DM patients have an approximately fivefold higher risk of hip fracture compared with individuals without diabetes, which is partly due to the reduced bone mineral density (BMD) and bone quality 8. Bone regeneration is a complex process with overlapping phases in which bone marrow mesenchymal stem cells (BMSCs) play a central role 9, 10. During the bone regeneration process, BMSCs are recruited and induced to migrate, proliferate, and differentiate into osteoblasts, which can synthesize proteoglycans, type I collagen and other noncollagenous proteins for bone matrix mineralization 9, 11. Recently, researchers have demonstrated that T1DM and hyperglycemia adversely affect the osteogenic potential of BMSCs 6, 12. However, to the best of our knowledge, whether the osteogenic potential of exosomes derived from BMSCs (BMSC‐exos) is impaired in T1DM has not been investigated.
In the present study, we aimed to compare the bone regenerative effect of exosomes secreted by BMSCs derived from T1DM rats (dBMSC‐exos) and exosomes secreted by BMSCs derived from normal rats (nBMSC‐exos). As vasculature is critical for appropriate bone development and regeneration 13, the proangiogenic effect of dBMSC‐exos and nBMSC‐exos was also investigated. This study may provide a better understanding of the appropriate source cells for future exosome therapies.
Materials and Methods
Induction of T1DM
All animal experiments were approved by the Animal Research Committee of Shanghai Jiao Tong University Affiliated Sixth People's Hospital. Eighteen 4‐week‐old male Sprague‐Dawley rats were randomized into two groups: the T1DM group (n = 9) and the normal group (n = 9). T1DM was induced by a single intraperitoneal injection of streptozotocin (Sigma–Aldrich, Saint Louis, MO; 55 mg/kg) dissolved in 10 mmol/l citrate buffer (pH 4.5) 14. The nine matched normal rats were injected intraperitoneally with an equivalent volume of citrate buffer. Blood glucose concentrations were tested after 7 days using a blood glucose metre (Accu‐Chek; Roche Diagnostics, Indianapolis, IN). Rats showing blood glucose levels higher than 16.7 mmol/l were confirmed to have T1DM and were selected for further study 15. Rats were kept for 12 weeks after confirmation of T1DM.
Isolation and Culture of Rat BMSCs
The isolation and culture of rat BMSCs was performed as described in our previous study 16. In brief, after euthanasia and sterilization, the femurs of diabetic rats and normal rats were harvested under sterile conditions. Then, the bone marrow was flushed from femurs using a 10‐ml syringe fitted with a 25‐gauge needle. After centrifugation, the cell pellet was resuspended and cultured in growth medium containing Minimum Essential Medium Eagle α Modification (α‐MEM, 5.5 mM glucose; HyClone, Logan, UT) supplemented with 10% fetal bovine serum (FBS; Gibco, Grand Island, NY) and 1% penicillin/streptomycin (Gibco). For the HG treatment groups, cells were cultured in medium supplemented with d‐glucose (25 mM) to mimic the diabetes state in vitro (19683085). The medium was changed after 24 hours to discard nonadherent cells. Cells from passages 4 to 6 were used in the following experiments.
Culture of Human Umbilical Vein Endothelial Cells
Primary human umbilical vein endothelial cells (HUVECs) were purchased from ScienCell Research Laboratories (Catalogue #8000; Carlsbad, CA). The cells were cultured in endothelial cell medium (5.5 mM glucose) supplemented with 5% FBS, 1% endothelial cell growth supplement and 1% penicillin/streptomycin (ScienCell Research Laboratories) according to the manufacturer's instructions. For the HG treatment groups, cells were cultured in medium supplemented with d‐glucose (25 mM) to mimic the diabetes state in vitro (30055307). HUVECs at passage 4 were used in the following experiments.
Isolation and Identification of dBMSC‐Exos and nBMSC‐Exos
dBMSC‐exos and nBMSC‐exos were isolated and purified according to our established protocol 3, 17. Briefly, after reaching 70%–80% confluence, BMSCs were washed three times with phosphate‐buffered saline (PBS) and cultured in MesenGro hMSC medium (StemRD, San Francisco, CA) for an additional 48 hours. The conditioned medium was collected and centrifuged at 300g for 15 minutes and then at 2,000g for 15 minutes at 4°C before being passed through a 0.22‐μm filter (Steritop; Millipore, Darmstadt, Germany) to remove the remaining cells and cellular debris. The filtered solution was then centrifuged at 4,000g in an ultra‐clear tube (Millipore) until the volume in the upper compartment was concentrated to approximately 200 μl. The ultrafiltration liquid was washed twice with PBS, and the ultrafiltration was repeated to 200 μl. For purification, the washed ultrafiltration liquid was laid onto a 30% sucrose/D2O cushion and ultracentrifuged at 100,000g for 2 hours. The pelleted exosomes were resuspended in 15 ml of PBS and centrifuged at 4,000g in ultra‐clear tubes to concentrate the volume to approximately 200 μl.
The concentration and size distribution of dBMSC‐exos and nBMSC‐exos were measured by tuneable resistive pulse sensing (TRPS) analysis with qNano (Izon Science, Cambridge, MA). Exosome morphology was observed using an FEI Tecnai G2 spirit transmission electron microscope (FEI, Eindhoven, The Netherlands). Specific exosome biomarkers CD9, CD63, and TSG101 were examined by Western blot (WB). Intracellular GM130 protein was examined to confirm the purity of the exosomes. BMSC lysate was used as a control.
Cell Cycle Analysis
BMSCs and HUVECs were treated with or without 1 × 10¹⁰ per milliliter exosomes for 24 hours. Then, the cells were digested to obtain a single‐cell suspension containing 80% precooled ethanol in PBS and stained with a propidium iodide (PI)/RNase staining buffer (BD Biosciences, San Jose, CA) at 37°C according to the manufacturer's instructions. Then, the DNA content was analyzed using a FACSCalibur flow cytometer (BD Biosciences).
Cell Proliferation Assay
The effect of dBMSC‐exos and nBMSC‐exos on the proliferation of rat BMSCs and HUVECs was assessed by the Cell Counting Kit‐8 (CCK‐8) assay (Dojindo, Kyushu Island, Japan) following our established protocol 3. BMSCs and HUVECs were seeded into 96‐well plates at 4,000 cells per well and 5,000 cells per well, respectively. The cells were cultured with 100 μl of growth medium containing different concentrations of exosomes (0, 1 × 10⁹, 1 × 10¹⁰ per milliliter). Cell proliferation curves were constructed by measuring the amount of formazan dye using a microplate reader at a wavelength of 450 nm.
Cell Migration Assay
Cell migration was evaluated by scratch wound and transwell assays, as previously described 3, 18. For the scratch wound assay, 1.5 × 10⁵ BMSCs or 5 × 10⁵ HUVECs were seeded into 6‐well plates and cultured in growth medium for 12 hours. Next, one scratch was made in each well using a 200‐μl pipette tip. After washing with PBS, the medium was then replaced with α‐MEM or endothelial cell medium supplemented with 1 × 10¹⁰ per milliliter dBMSC‐exos, 1 × 10¹⁰ per milliliter nBMSC‐exos, or without exosomes. Wound closure was monitored by capturing images at different time points with a light microscope (Leica, Wetzlar, Germany). The scratched areas were measured using ImageJ software (National Institutes of Health, Bethesda, MD).
For the transwell assay, 8 × 10⁴ cells were suspended in α‐MEM or endothelial cell medium and seeded into the upper chamber of a 24‐well transwell plate with an 8‐μm pore size (Corning, NY). Next, the lower chamber was filled with 500 μl of complete growth medium supplemented with 1 × 10¹⁰ per milliliter dBMSC‐exos, 1 × 10¹⁰ per milliliter nBMSC‐exos, or without exosomes. After 12 hours, cells on the upper surface of the membrane were carefully wiped off using a cotton swab, and the migrated cells on the lower surface were stained with 1% crystal violet for 5 minutes. The number of migrated cells in five randomly selected fields per well was counted using a light microscope (Leica).
Osteogenic Differentiation
Osteogenic differentiation was induced using osteogenic induction medium (OIM, OriCell, Cyagen Biosciences, Guangzhou, China) according to the manufacturer's instructions. Various doses of dBMSC‐exos and nBMSC‐exos were added to OIM in the experimental group, whereas cells in the control group were cultured in OIM without exosomes. Osteogenic differentiation was assessed by alkaline phosphatase (ALP) staining and ALP activity on day 3, quantitative reverse transcription polymerase chain reaction (qRT‐PCR), WB, and immunofluorescence (IF) on day 7, and alizarin red S staining on day 14 according to our established protocol 19.
ALP Staining and ALP Activity Measurement
For ALP staining, BMSCs were washed with PBS and fixed with 4% paraformaldehyde for 15 minutes. The cells were then incubated with BCIP/NBT ALP Color Development Substrate (Beyotime, Shanghai, China) for 15 minutes. To measure the ALP activity, cells were lysed in radioimmunoprecipitation assay lysis buffer (Sigma–Aldrich); ALP activity was then evaluated using an ALP assay kit (Nanjing Jiancheng Biotechnology Co., Ltd., Nanjing, China). The optical density at 520 nm was measured using a microplate reader.
Alizarin Red Staining
Calcium mineral deposits were evaluated by alizarin red S staining. After fixation with 4% paraformaldehyde for 25 minutes, BMSCs were stained with alizarin red S (Cyagen Biosciences) for 10 minutes and then washed with PBS. To quantify the mineralization, the calcium deposits were desorbed using 10% cetylpyridinium chloride (Sigma), and the absorbance at 570 nm was measured.
qRT‐PCR
cDNA was synthesized using PrimeScript RT Master Mix (Takara Bio, Otsu, Japan). qRT‐PCR was performed using SYBR Green I Master Mix (Takara Bio) according to the manufacturer's instructions. The following primers were provided by BioTNT (BioTNT, Shanghai, China): Col1 forward: 5′‐CATCGGTGGTACTAAC‐3′, reverse: 5′‐CTGGATCATATTGCACA‐3′; runt‐related transcription factor 2 (Runx2) forward: 5′‐ACTTCCTGTGC TCGGTGCT‐3′, reverse: 5′‐GACGGTTATGGTCAAGGTGAA‐3′; vascular endothelial growth factor A (VEGFA) forward: 5′‐TGCACCCACGACAGAAGGGGA‐3′, reverse: 5′‐TCACCGCCTTGGCTTGCTACAT‐3′; glyceraldehyde‐3‐phosphate dehydrogenase (GAPDH) forward: 5′‐GGCATGGACTGTGGTCATGAG‐3′, reverse: 5′‐TGCACCACCAACTGTTAGC‐3′. PCR was performed for 40 cycles, and the mRNA expression levels of the target genes were analyzed relative to the mRNA expression levels of Gapdh using the 2−ΔΔCt method.
WB Analysis
Cell or exosome lysates were diluted at a 1:5 ratio with loading buffer (6×) and heated at 95°C for 6 minutes. Protein extracts were separated by 10% sodium dodecyl sulfate polyacrylamide gel electrophoresis and blotted onto polyvinylidene fluoride membranes (Millipore, Billerica, MA). Next, the membranes were blocked in 5% nonfat milk for 2 hours. Then, the membranes were incubated overnight with primary antibodies specific to CD9 (1:10,000, Abcam, MA), CD63 (1:5,000, Abcam), TSG101 (1:1,000, Proteintech Group, IL), GM130 (1:5,000, Proteintech Group), RUNX2 (1:3,000, Cell Signaling Technology, Beverly, MA), COL1 (1:6,000, Abcam), VEGFA (1:1,000, Abcam) and GAPDH (1:4,500, Cell Signaling Technology). Next, the membranes were incubated with horseradish peroxidase‐conjugated secondary antibodies for 1 hour at room temperature. The immunoreactive bands were detected using a FluorChem WB imaging system (ProteinSimple, San Jose, CA).
Immunofluorescence
BMSCs were fixed using 4% paraformaldehyde for 15 minutes, permeabilized with 0.3% Triton X‐100 for 10 minutes, and blocked with 5% Bovine Serum Albumin (BSA) in PBS + 0.1% Tween 20 for 1 hour at room temperature. Then, the cells were incubated with anti‐COL1 (1:500, Abcam) and anti‐RUNX2 (1:250, CST) antibodies overnight at 4°C. After washing, the cells were incubated with Alexa‐488‐conjugated secondary antibodies (1:800, Jackson ImmunoResearch Inc., West Grove, PA) for 2 hours at room temperature. Nuclei were stained with DAPI (Sigma–Aldrich), and actin filaments were labeled with TRITC‐phalloidin (Yeasen Biotechnology, Shanghai, China). Fluorescence was detected by confocal microscopy (Cell Voyager, Yokohama, Japan).
HUVEC Tube Formation Assay
To investigate HUVEC network formation, the tube formation assay was performed as previously described 20. Briefly, each well of a 96‐well plate was coated with 50 μl of cold Matrigel (Corning, Corning, NY). After pretreatment with medium in the presence or absence of 1 × 10¹⁰ per milliliter dBMSC‐exos or nBMSC‐exos for 48 hours, 1 × 10⁴ HUVECs in 150 μl of medium were seeded in the wells. Images were captured after 4 and 8 hours under a light microscope. The ability to form capillary‐like structures was determined by the number of branch points and tubule lengths in three randomly chosen fields.
In Vivo Matrigel Plug Angiogenesis Assay
Angiogenesis was evaluated in vivo as the growth of blood vessels from subcutaneous tissue into a solid Matrigel plug containing the test sample according to a previously published protocol 20. Growth factor‐reduced Matrigel (300 μl) was mixed in liquid form at 4°C with 100 μl of PBS (negative control), dBMSC‐exos, nBMSC‐exos, and basic fibroblast growth factor (bFGF, positive control). The final concentration of dBMSC‐exos and nBMSC‐exos was 1 × 10¹⁰ per milliliter, and the final concentration of bFGF was 150 ng/ml. The Matrigel mix was then injected subcutaneously into the ventral area of 6‐week‐old athymic nude mice. After 14 days, the mice were sacrificed, and the Matrigel plugs were excised. After fixation with 4% paraformaldehyde, the plugs were embedded in paraffin, sectioned, and stained with Masson's trichrome to visualize the endothelial cells/vessels as dark red and the Matrigel as blue. The number of migrated cells was counted in five randomly selected fields using a light microscope.
Critical Size Calvarial Defect Model
BMSCs were transplanted in a scaffold consisting of ShakeGel three‐dimensional (3D) hydrogel (Biomaterials USA, Richmond, VA), which is a functionalized polysaccharide‐based bioactive hydrogel 21. According to the manufacturer's protocol, BMSCs were washed with PBS and suspended in PBS at 3 × 10⁶ cells per milliliter. Then, equal volumes of the cell suspension and hydrogel were mixed and immediately applied to the calvarial bone defects in rats. For the implantation of BMSCs treated with exosomes, the cells were precultured with exosomes at a concentration of 1 × 10¹⁰ per milliliter for 5 days before being mixed with the hydrogel. To ensure that the cells were exposed to exosomes in vivo, exosomes were added to the mixed hydrogel composites at a final concentration of 1 × 10¹⁰ per milliliter.
All animal experimental procedures were approved by the Animal Research Ethics Committee of Shanghai Jiao Tong University Affiliated Sixth People's Hospital. According to previous studies 17, 21, 8‐week‐old male Sprague‐Dawley rats were anesthetized, and a 2‐cm incision was made along the sagittal plane across the cranium. Two 5‐mm circular critical‐sized bone defects were carefully created on each side of the cranium using a trephine, avoiding damage to the dura mater. The cell/hydrogel composites were then implanted into the defects. Twenty‐four rats were randomized into three groups according to the following implants: (a) hydrogel mixed with BMSCs (control group; n = 8); (b) hydrogel mixed with BMSCs treated with dBMSC‐exos (dBMSC‐exos group; n = 8); and (c) hydrogel mixed with BMSCs treated with nBMSC‐exos (nBMSC‐exos group; n = 8).
To compare blood vessel formation, vascular perfusion was performed according to previous studies 21, 22. Briefly, 8 weeks after surgery, the rats were anesthetized, and the rib cage was opened. Then, heparinized saline, 4% paraformaldehyde, and 10 ml of MICROFIL (Flow Tech, Carver, MA) were successively perfused into the left ventricle. Finally, the rats were kept overnight at 4°C. Then, the craniums were harvested. The cranium was first assessed by micro computed tomography (micro‐CT) to evaluate bone formation. Then, half of the cranium was evaluated by undecalcified histological analysis, and the other half was decalcified and assessed by micro‐CT and IF staining for CD31 to evaluate angiogenesis. To compare the number of capillaries, CD31‐stained blood vessels with a diameter smaller than 10 mm were counted in five randomly chosen high‐power fields (HPF) and expressed as capillaries per HPF.
Micro‐CT Analysis
The cranium was scanned using a micro‐CT system (SkyScan 1172, Bruker microCT, Kontich, Belgium) at a resolution of 9 μm with the following parameters: current, 112 μA; x‐ray energy, 80 kVp; and exposure time, 370 milliseconds. To evaluate bone regeneration in the defect area, the new bone volume/total volume (BV/TV) and BMD of the bone defect area were calculated. To evaluate angiogenesis, 3D reconstructions of blood vessels were prepared, and morphometric parameters, that is, the blood vessel area and blood vessel number, of the bone defect area were calculated.
Histological Analysis
After serial dehydration, the cranium was embedded in polymethylmethacrylate (PMMA). Then, the cranium was sectioned coronally through the central area of the bone defect at a thickness of 5 μm with a microtome (Leica). Next, the sections were subjected to van Gieson's (VG) picrofuchsin staining and Goldner's trichrome staining to evaluate new bone formation in accordance with previous studies 17, 21.
Statistical Analysis
Statistical analysis was performed using SPSS 22.0 software (IBM, Armonk, NY). Data are shown as the mean ± SD. in vitro data were compared using the Wilcoxon–Mann–Whitney test. in vivo data were compared using a two‐tailed Student's t test. p < .05 was considered statistically significant.
Results
Characterization of dBMSC‐Exos and nBMSC‐Exos
To comprehensively characterize the purified nanoparticles derived from nBMSCs and dBMSCs, TRPS analysis, transmission electron microscopy (TEM) and WB analysis were used. TRPS analysis revealed that the size of the majority of these particles was approximately 50–150 nm (Fig. 1A). TEM clearly showed that dBMSC‐exos and nBMSC‐exos exhibited a cup‐ or sphere‐shaped morphology and were 50–100 nm in size (Fig. 1B). WB analyses showed that the dBMSC‐exos and nBMSC‐exos expressed exosomal surface markers of CD9, CD63, and TSG101 proteins and were negative for a cytosolic contaminant marker GM130, which is present in Golgi and not contained in exosomes (Fig. 1C).
Figure 1.
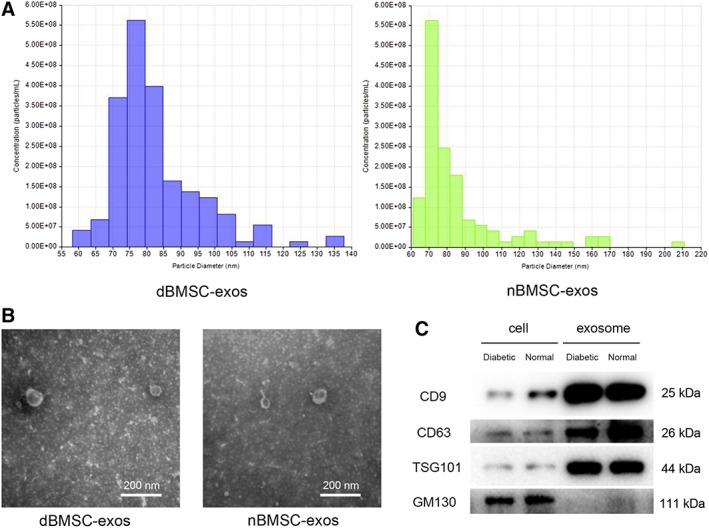
Characterization of dBMSC‐exos and nBMSC‐exos. (A): Tuneable resistive pulse sensing analysis of exosome size distribution. (B): Morphology of exosomes observed by transmission electron microscopy. (C): Western blot analysis of the exosomal surface markers CD9, CD63, and TSG101 and the cytosolic contaminant marker GM130. This experiment was repeated independently three times. Abbreviations: dBMSC‐exos, exosomes secreted by bone marrow mesenchymal stem cells derived from diabetic rats; nBMSC‐exos, exosomes secreted by bone marrow mesenchymal stem cells derived from normal rats.
Effects of dBMSC‐Exos and nBMSC‐Exos on BMSC Proliferation and Migration
The cell cycle status of BMSCs was evaluated by PI staining and flow cytometry. The data showed that although exosome treatment increased the cell number in the S+G2 phases and the S/G1 fraction (p < .05), nBMSC‐exos exerted a more potent effect than dBMSC‐exos at a dose of 1 × 10¹⁰ per milliliter (p < .05; Fig. 2A–2C). Similarly, the CCK‐8 assay demonstrated that at a concentration of 1 × 10¹⁰ per milliliter, BMSCs cultured with either dBMSC‐exos or nBMSC‐exos showed greater proliferation than those in the control group (p < .05) or cells treated with 1 × 10⁹ per milliliter exosomes (p < .05); moreover, at doses of 1 × 10⁹ per milliliter and 1 × 10¹⁰ per milliliter, nBMSC‐exos had a more potent effect than dBMSC‐exos (p < .05; Fig. 2D).
Figure 2.
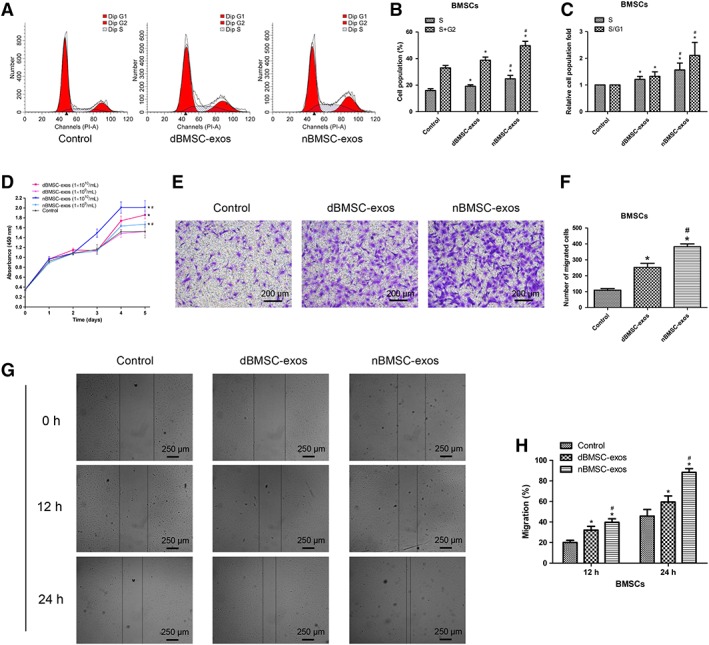
Effects of dBMSC‐exos and nBMSC‐exos on the proliferation and migration of bone marrow mesenchymal stem cells (BMSCs). (A–C): Cell cycle status of BMSCs after treatment with dBMSC‐exos and nBMSC‐exos. (D): Viability of BMSCs after treatment with dBMSC‐exos and nBMSC‐exos, as examined by CCK‐8 assay. (E–H): Comparison of dBMSC‐exos and nBMSC‐exos in terms of BMSC migration, as examined by the transwell assay (E and F) and the scratch wound assay (G and H). This experiment was repeated independently three times. Data are presented as the mean ± SD. *, p < .05 compared with the control group; #, p < .05 compared with the dBMSC‐exos treatment group at the same exosome concentration.
Cell migration was evaluated using the transwell and scratch wound assays. The data indicated that both dBMSC‐exos and nBMSC‐exos significantly enhanced the motility of BMSCs (p < .05) and that at the same concentration, nBMSC‐exos were more effective than dBMSC‐exos (p < .05; Fig. 2E–2H).
In addition, to simulate the diabetes state in vitro, the effect of dBMSC‐exos and nBMSC‐exos on BMSC proliferation and migration was compared under HG conditions. Similarly, nBMSC‐exos were more effective than dBMSC‐exos as indicated by the CCK‐8 and transwell assays (Supporting Information Fig. S1A–S1C).
Effects of dBMSC‐Exos and nBMSC‐Exos on HUVEC Proliferation and Migration
The cell cycle analysis of HUVECs demonstrated that treatment with both dBMSC‐exos and nBMSC‐exos increased the cell number in the S+G2 phases and the S/G1 fraction (p < .05), with no significant difference between the dBMSC‐exos and nBMSC‐exos groups (p > .05; Fig. 3A–3C). Similarly, the CCK‐8 assay demonstrated that at a concentration of either 1 × 10⁹ per milliliter or 1 × 10¹⁰ per milliliter, HUVECs cultured with dBMSC‐exos or nBMSC‐exos showed greater proliferation than the controls (p < .05); moreover, at doses of both 1 × 10⁹ per milliliter and 1 × 10¹⁰ per milliliter, there were no significant differences between the dBMSC‐exos and nBMSC‐exos groups (p > .05; Fig. 3D).
Figure 3.
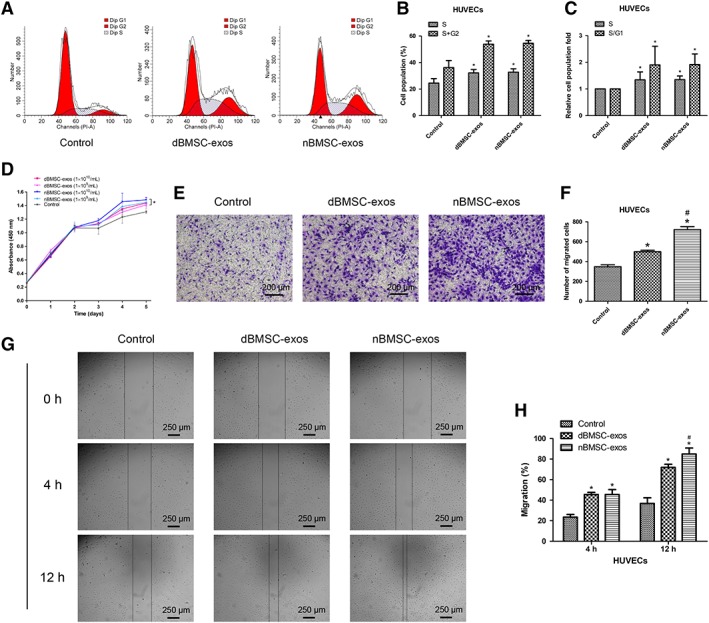
Effects of dBMSC‐exos and nBMSC‐exos on the proliferation and migration of HUVECs. (A–C): Cell cycle status of HUVECs after treatment with dBMSC‐exos and nBMSC‐exos. (D): Viability of HUVECs after treatment with dBMSC‐exos and nBMSC‐exos, as examined by CCK‐8 assay. (E–H): Comparison of dBMSC‐exos and nBMSC‐exos in terms of HUVEC migration, as examined by the transwell assay (E and F) and the scratch wound assay (G and H). This experiment was repeated independently three times. Data are presented as the mean ± SD. *, p < .05 compared with the control group; #, p < .05 compared with the dBMSC‐exos treatment group at the same exosome concentration.
The transwell and scratch wound assays revealed that both dBMSC‐exos and nBMSC‐exos significantly enhanced the motility of HUVECs (p < .05) and further showed that at the same concentration, nBMSC‐exos were more effective than dBMSC‐exos (p < .05; Fig. 3E–3H).
In addition, under HG conditions, nBMSC‐exos showed a more potent effect than dBMSC‐exos on HUVEC proliferation and migration as indicated by the CCK‐8 and transwell assays (Supporting Information Fig. S2A–S2C).
Effects of dBMSC‐Exos and nBMSC‐Exos on BMSC Osteogenic Differentiation
To compare the effect of dBMSC‐exos and nBMSC‐exos on the osteogenesis of BMSCs in vitro, we first investigated the expression of Col1 and Runx2, which are important osteo‐specific markers. The qRT‐PCR results demonstrated that the mRNA levels of Col1 and Runx2 were significantly increased after treatment with dBMSC‐exos or nBMSC‐exos (p < .05) and further showed that nBMSC‐exos were more effective than dBMSC‐exos at both 1 × 10⁹ per milliliter and 1 × 10¹⁰ per milliliter (p < .05; Fig. 4A). Next, WB analysis revealed a similar trend that cells treated with nBMSC‐exos showed higher protein levels of COL1 and RUNX2 than those treated with dBMSC‐exos (p < .05; Fig. 4B, 4C). IF was used to confirm this trend, and higher expression levels of COL1 and RUNX2 were detected in the nBMSC‐exos group than in the dBMSC‐exos group at a dose of 1 × 10¹⁰ per milliliter (Fig. 4D, 4E).
Figure 4.
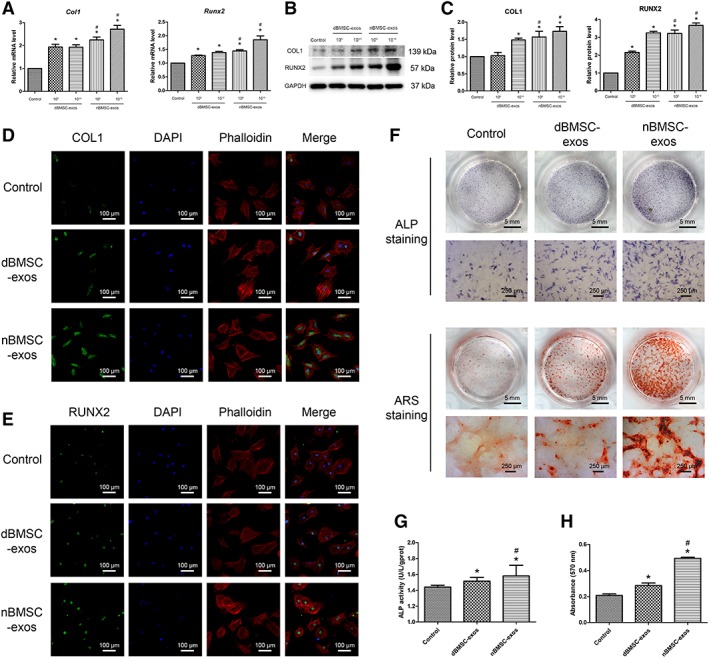
Effects of dBMSC‐exos and nBMSC‐exos on bone marrow mesenchymal stem cell (BMSC) osteogenesis. (A–C): On day 7 after osteogenic induction, the expression of osteogenic differentiation‐related genes and proteins (COL1 and RUNX2) was investigated by qRT‐PCR (A) and Western blot (B, C). (D, E): Expression of COL1 and RUNX2, as assessed by immunofluorescence. (F): Osteogenic differentiation of BMSCs, as examined by alkaline phosphatase (ALP) staining on day 3 and alizarin red S staining on day 14. (G): Assessment of ALP activity. (H): Calcium mineralization was quantified by the optical density. Abbreviation: ARS, alizarin red S. This experiment was repeated independently three times. Data are presented as the mean ± SD. *, p < .05 compared with the control group; #, p < .05 compared with the dBMSC‐exos treatment group at the same exosome concentration.
Then, we investigated the ALP activity and calcium deposition of cells treated with dBMSC‐exos or nBMSC‐exos at a dose of 1 × 10¹⁰ per milliliter. ALP is an early marker of osteogenesis. ALP staining and ALP activity analysis indicated that while both dBMSC‐exos and nBMSC‐exos significantly enhanced the ALP activity of BMSCs, nBMSC‐exos were more effective than dBMSC‐exos (p < .05; Fig. 4F, 4G). Calcium deposition was examined by alizarin red S staining. Similarly, mineralization was significantly enhanced after treatment with dBMSC‐exos or nBMSC‐exos, but nBMSC‐exos showed a more potent effect than dBMSC‐exos (p < .05; Fig. 4F, 4H).
Moreover, under HG conditions, nBMSC‐exos showed a more potent effect than dBMSC‐exos on the osteogenic differentiation of BMSCs as indicated by WB and alizarin red S staining (Supporting Information Fig. S1D–S1H).
Effects of dBMSC‐Exos and nBMSC‐Exos on the Angiogenic Activity of HUVECs
As vasculature is indispensable for bone regeneration 13, we next investigated the effects of dBMSC‐exos and nBMSC‐exos on angiogenesis. The VEGF pathway is critical for angiogenesis; VEGF protein, particularly VEGFA, is essential for the coupling of osteogenesis and angiogenesis 13, 23. Therefore, we first investigated the expression of VEGFA in HUVECs after the exosome treatment. The qRT‐PCR results demonstrated that the mRNA levels of VEGFA were significantly increased after treatment with dBMSC‐exos or nBMSC‐exos (p < .05) and further showed that nBMSC‐exos were more effective than dBMSC‐exos at both 1 × 10⁹ per milliliter and 1 × 10¹⁰ per milliliter (p < .05; Fig. 5A). Next, WB analysis revealed a similar trend that cells treated with nBMSC‐exos showed higher protein levels of VEGFA than cells treated with dBMSC‐exos (p < .05; Fig. 5B, 5C).
Figure 5.
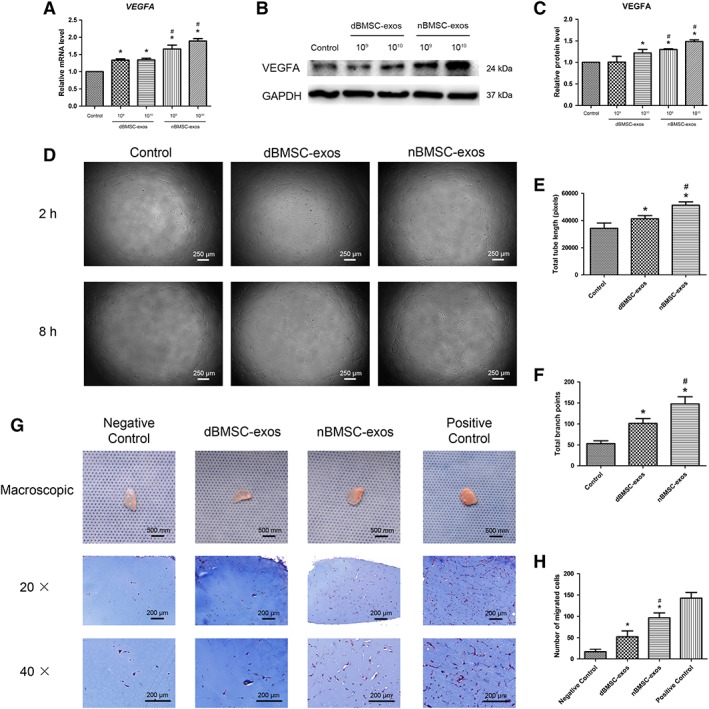
Effects of dBMSC‐exos and nBMSC‐exos on the angiogenic activity of HUVECs. (A–C): VEGFA expression, as examined by RT‐PCR (A) and WB (B, C). (D–F): HUVEC tube formation, as observed by light microscopy (D) and quantified by total tube length (E) and total branch points (F). (G, H): in vivo Matrigel plug assay. (G): Representative macroscopic images and Masson's trichrome staining images of gel plugs. (H): Histological analysis of Masson's trichrome staining. This experiment was repeated independently three times. Data are presented as the mean ± SD. *, p < .05 compared with the control group; #, p < .05 compared with the dBMSC‐exos treatment group at the same exosome concentration.
Then, an in vitro tube formation assay and an in vivo Matrigel plug assay were used to compare the proangiogenic effects of dBMSC‐exos and nBMSC‐exos. As shown in Figure 5D–5F, dBMSC‐exos and nBMSC‐exos significantly enhanced the total tube length and total branch points of HUVECs (p < .05), while nBMSC‐exos showed a stronger effect (p < .05). For the Matrigel plug assay, gross inspection of the Matrigel plugs showed more vessel formation in the nBMSC‐exos plugs than in the dBMSC‐exos plugs. Histological analysis demonstrated that both dBMSC‐exos and nBMSC‐exos enhanced cell migration into the Matrigel plugs (p < .05), but nBMSC‐exos showed a greater effect than dBMSC‐exos (p < .05; Fig. 5G, 5H).
Moreover, under HG conditions, nBMSC‐exos showed a more potent proangiogenic effect than dBMSC‐exos on HUVECs as indicated by the WB analysis and tube formation assay (Supporting Information Fig. S2D–S2H).
Effects of dBMSC‐Exos and nBMSC‐Exos on Bone Regeneration and Neovascularization in a Rat Calvarial Defect Model
Eight weeks after surgery, micro‐CT and undecalcified histological analysis were performed to evaluate the newly formed bone in the defect area. In the 3D reconstruction and coronal views (Fig. 6A), a larger amount of newly formed bone was observed in the exosome treatment groups than the control group, and the nBMSC‐exos group showed more extensive bone regeneration than the dBMSC‐exos group. This trend was confirmed by quantitative analysis of the BV/TV and bone BMD of the defect area (Fig. 6B, 6C). Next, undecalcified histological analysis of VG picrofuchsin and Goldner's trichrome staining was used to visualize cellular details and sites of mineralization. In Goldner's trichrome staining, newly formed mineralized bone in the defect area and the surrounding unmineralized bone are visualized as green and red, respectively. Consistent with the above findings, compared with the dBMSC‐exos group, the nBMSC‐exos group showed a larger amount of mineralized bone tissue, which almost occupied the whole defect area (Fig. 6D).
Figure 6.
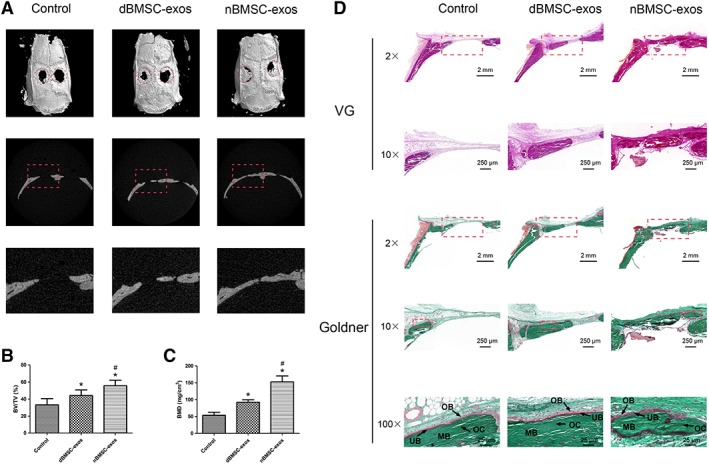
Effects of dBMSC‐exos and nBMSC‐exos on bone regeneration in rat calvarial defects. (A): Three‐dimensional reconstruction and coronal images obtained by micro‐CT. (B, C): Quantitative morphometric analysis of bone volume/total volume and bone mineral density of newly formed bone in the defects. (D): Representative histological images of van Gieson's (VGs) picrofuchsin staining and Goldner's trichrome staining. Goldner's trichrome staining visualizes newly formed mineralized bone (MB) in the defect area as green and the surrounding unmineralized bone (UB) as red. Osteoblasts lined the surface of the UB, and osteocytes were observed inside the MB. VG, van Gieson picrofuchsin staining; Goldner, Goldner's trichrome staining. Data are presented as the mean ± SD. *, p < .05 compared with the control group; #, p < .05 compared with the dBMSC‐exos treatment group at the same exosome concentration.
Neovascularization in the defect area was evaluated by micro‐CT and IF analysis. 3D micro‐CT reconstructions demonstrated that compared with the control group, the exosome treatment groups showed markedly enhanced angiogenesis, and the nBMSC‐exos group showed more blood vessel formation than the dBMSC‐exos group (Fig. 7A). Quantification of the vessel area verified this trend (Fig. 7C). IF staining for CD31 was performed to identify capillaries in the defect area. Consistent with the micro‐CT data, the IF results revealed greater new capillary formation in the nBMSC‐exos group than the dBMSC‐exos group (Fig. 7B, 7D).
Figure 7.
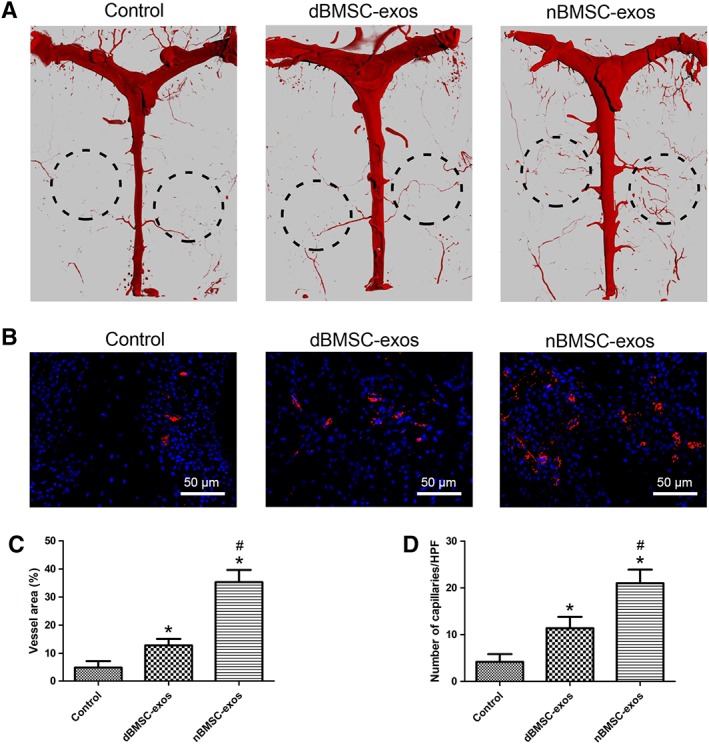
Effects of dBMSC‐exos and nBMSC‐exos on neovascularization in rat calvarial defects. (A): The blood supply of the rat cranium was examined by micro‐CT. (B): Immunofluorescence staining for CD31 (red) in the rat cranium. (C): Quantitative analysis of micro‐CT images showing the vessel area in the defect area. (D): Quantification of capillaries stained with CD31, which is expressed as the number of capillaries per high‐power fields. Data are presented as the mean ± SD. *, p < .05 compared with the control group; #, p < .05 compared with the dBMSC‐exos treatment group at the same exosome concentration.
In addition, to mimic the clinical condition, a calvarial defect model was constructed using T1DM rats. Consistent with the above findings, nBMSC‐exos showed a superior therapeutic effect than dBMSC‐exos in bone defect repair (Supporting Information Fig. S3).
Discussion
In the present study, we found for the first time that T1DM impairs the bone regenerative effect of exosomes derived from BMSCs. In vitro, although dBMSC‐exos and nBMSC‐exos both enhanced the osteogenic differentiation of BMSCs and promoted the angiogenic activity of HUVECs, nBMSC‐exos had a greater effect than dBMSC‐exos. In vivo, both dBMSC‐exos and nBMSC‐exos promoted bone regeneration and neovascularization in rat calvarial defects, but the therapeutic effect of nBMSC‐exos was superior to that of dBMSC‐exos.
Bone is a richly vascularized tissue. Vasculature is critical for appropriate bone development and regeneration because it not only supplies the bone with oxygen and nutrients and removes metabolites but it is also the main delivery route of hormones and growth factors to the skeletal system 13, 24. In addition, the vascular network is crucial for bone tissue engineering, which aims to accelerate the regeneration of bone defects. It has been reported that the major challenge after graft implantation is the maintenance of cell viability in the graft core, which depends on rapid angiogenesis within the tissue‐engineered implants 24. Researchers have demonstrated that exosomes can stimulate angiogenesis in bone, which is an important mechanism for stimulating bone regeneration 22, 25. Consistent with previous studies, we found that both dBMSC‐exos and nBMSC‐exos could enhance the angiogenic activity of HUVECs and promote neovascularization in rat calvarial defects. However, the proangiogenic effect of dBMSC‐exos was significantly impaired compared with that of nBMSC‐exos. This may be an important reason for the impairment in bone regeneration.
During the past few years, mounting evidence has demonstrated that exosomes derived from different stem cells could promote bone regeneration 26; thus, exosome therapies exhibit great potential for clinical translation 27. It is believed that the surface proteins and the cargo of exosomes are crucial to their function 25, 28. Because these exosomal characteristics are derived from the source cell, exploring different cell sources for therapeutic purposes is of great importance. However, few researchers have concentrated on this subject. For clinical purposes, the transplantation of autologous stem cells or their exosomes is theoretically preferable to allogeneic transplantation, considering the related ethical issues and immunoreactions. However, our results reveal that for patients with diabetes mellitus, the autologous transplantation of BMSC‐exos to promote bone regeneration may be inadequate because the bone regenerative potential of those BMSC‐exos is compromised. Considering that patients with diabetes mellitus themselves are more susceptible to impaired bone healing and osteonecrosis 13, 29, there is a compelling need to develop bone reparative strategies specifically targeting the population of patients with diabetes mellitus. Therefore, our findings are of great significance for the future clinical translation of BMSC‐exos‐based therapies.
Diabetes mellitus and metabolic syndrome lead to the formation of important microenvironments that may affect the function of various types of cells 30, 31. In particular, as a promising seed cell in tissue engineering, BMSCs are negatively affected by diabetes mellitus. Researchers have reported that the angiogenic activity and osteogenesis of BMSCs were impaired by diabetes mellitus 6, 32. Although the reason why diabetes deteriorates the function of BMSCs is not completely understood, two primary explanations are available. The first one is the effect of advanced glycation end products (AGEs), which are generated by a nonenzymatic reaction between sugar residues and proteins. Hyperglycemia generates higher levels of AGEs, which excessively accumulate in bone tissue and play a crucial part in the pathogenesis of diabetes‐related osteoporosis 33. Researchers demonstrated that AGEs influence the function of BMSCs by the receptor for AGEs (RAGE), and the AGE–RAGE interaction may prevent BMSC differentiation, inhibit BMSC proliferation and migration, and increase BMSC apoptosis via the involvement of the TGF‐β, p38 MAPK signaling and oxidative stress 34, 35, 36, 37. The other explanation is the direct effect of hyperglycemia. Zhang et al. reported that HG microenvironments inhibit the migration and proliferation of BMSCs by GSK3β‐mediated cyclin D1 and CXCR‐4 inhibition 38. Cao et al. reported that HG could inhibit BMSC osteogenesis via inhibition of CXCL13, which is mediated by lncRNA AK028326 39. Recently, Keats et al. demonstrated that hyperglycemia induced Wnt11 in BMSCs, which led to enhanced adipogenesis but suppressed osteogenesis 40.
Exosomes, originating from the endosomes of parental cells, are highly stable in terms of cargo storage and therefore faithfully reflect the genomic characteristics of their parent cell 31. Consistent with the findings in BMSCs 6, 32, in the present study, we demonstrate that the pro‐osteogenic and proangiogenic effects of BMSC‐exos are also impaired by T1DM. As mentioned above, it is widely acknowledged that exosomes promote tissue regeneration by transferring functional cargo consisting of genetic information (RNA and DNA), proteins and other molecules to target cells, thereby regulating the bioactivity of the recipient cells 27, 41, 42. Thus, the components present in BMSC‐exos may have changed in T1DM condition. In a previous study, Meng et al. indicated that metabolic syndrome altered the miRNA content of extracellular vesicles (EVs) secreted by adipose tissue‐derived MSCs 31. They found that metabolic syndrome‐ and lean‐EVs were enriched with 8 and 14 distinct miRNAs, respectively. The target genes of the miRNAs enriched in the metabolic syndrome‐EVs were mainly involved in the development of metabolic syndrome, such as diabetes‐related signaling pathways. In contrast, the miRNAs enriched in the lean‐EVs mainly targeted the Rho family of GTPases and ephrinA‐EphA. More recently, Wang et al. reported that compared with exosomes derived from normal BMSCs, exosomes derived from AGE‐BSA‐pretreated BMSCs showed increased expression of miR‐146a and exhibited a more potent inhibitory effect on vascular smooth muscle cell calcification 43. In the present study, we found that the expression levels of some downstream genes of target cells, including Col1, Runx2, and VEGFA, were different between the dBMSC‐exos and nBMSC‐exos treatment groups. Therefore, we speculate that one or more exosomal contents, such as microRNA or protein, may play a critical role in the impaired bone regenerative effect of dBMSC‐exos.
There are some limitations to this study. First, the detailed mechanisms of the impaired pro‐osteogenic and pro‐angiogenic effects of BMSC‐exos in T1DM have not been elucidated. Second, the BMSCs in the present study were isolated from normal and T1DM rats instead of humans. This STZ‐induced T1DM model has several features of human T1DM, such as pancreatic β cell destruction, insulin deficiency and hyperglycemia. However, compared with spontaneous T1DM, in which the pancreatic β cells are destroyed by an autoimmune reaction, the STZ‐induced T1DM model is absent autoimmune processes and develops without the intervention of T and B lymphocytes 44. Future work will need to compare the effect of BMSC‐exos from normal and T1DM humans and focus on the exosomal components to explore their detailed mechanisms of action.
Conclusion
The present study demonstrates for the first time that the bone regenerative effect of exosomes derived from BMSCs is impaired in T1DM. This finding indicates that for patients with T1DM, the autologous transplantation of BMSC‐exos to promote bone regeneration may be inadequate. Our findings may assist in the development of adequate bone regenerative strategies for use in those with T1DM.
Author Contributions
Y.Z.: conception and design, experiments, data analysis and interpretation; manuscript writing; Y.J.: experiments, data analysis and interpretation; Y.W.: animal experiments; J.X.: conception and design, manuscript writing; Y.C.: conception and design, financial support, final approval of manuscript.
Disclosure of Potential Conflicts of Interest
The authors indicated no potential conflicts of interest.
Data Availability Statement
The data that support the findings of this study are available from the corresponding author upon reasonable request.
Supporting information
Figure S1: Effects of dBMSC‐exos and nBMSC‐exos on the proliferation, migration and osteogenesis of BMSCs under the high glucose condition. For normal glucose (NG) group, BMSCs were cultured under 5.5 mM glucose condition without exosome treatment; for the high glucose (HG) treatment groups, BMSCs were cultured under 25 mM glucose condition treated with 1 × 10^10/mL dBMSC‐exos, 1 × 10^10/mL nBMSC‐exos, or without exosomes (Control). (a) Viability of BMSCs after treatment with dBMSC‐exos and nBMSC‐exos. CCK‐8 assay was performed at day 5 after treatment. (b‐c) Transwell assay. (d‐f) The expression of osteogenic differentiation‐related markers (COL1 and RUNX2) were investigated by WB. (g‐h) Osteogenic differentiation of BMSCs was examined by alizarin red S staining (g) and calcium mineralization was quantified by the OD (h). This experiment was repeated independently three times. Data are presented as the mean ± SD. *P < .05 compared with the control group, #P < .05 compared with the dBMSC‐exos treatment group at the same exosome concentration.
Figure S2: Effects of dBMSC‐exos and nBMSC‐exos on the proliferation, migration and angiogenic activity of HUVECs under the high glucose (HG) condition. For the normal glucose (NG) group, HUVECs were cultured under the 5.5 mM glucose condition without exosome treatment; for the HG treatment groups, BMSCs were cultured under 25 mM glucose condition treated with 1 × 10^10/mL dBMSC‐exos, 1 × 10^10/mL nBMSC‐exos, or without exosomes (Control). (a) Viability of HUVECs after treatment with dBMSC‐exos and nBMSC‐exos. CCK‐8 assay was performed at day 5 after treatment. (b‐c) Transwell assay. (d‐e) VEGFA expression as examined by WB. (f‐h) HUVEC tube formation, as observed by light microscopy (f) and quantified by total tube length (g) and total branch points (h). This experiment was repeated independently three times. Data are presented as the mean ± SD. *P < .05 compared with the control group, #P < .05 compared with the dBMSC‐exos treatment group at the same exosome concentration.
Figure S3: Effects of dBMSC‐exos and nBMSC‐exos on bone regeneration of calvarial defects in T1DM rats. T1DM was induced via intraperitoneal injection of streptozotocin. At day 7 after induction, rats showing blood glucose levels higher than 16.7 mmol/l were confirmed to have T1DM and thus were selected. Fifteen T1DM rats were randomized into three groups according to the following implants: (1) hydrogel mixed with BMSCs (control group) (n = 5); (2) hydrogel mixed with BMSCs treated with dBMSC‐exos (dBMSC‐exos group) (n = 5); and (3) hydrogel mixed with BMSCs treated with nBMSC‐exos (nBMSC‐exos group) (n = 5). At 4 weeks after surgery, an evaluation of bone regeneration was performed. (a) 3D reconstruction and coronal images obtained by micro‐CT. (b‐c) Quantitative morphometric analysis of BV/TV and BMD of newly formed bone in the defects. Data are presented as the mean ± SD. *P < .05 compared with the control group, #P < .05 compared with the dBMSC‐exos treatment group.
Acknowledgments
This work was supported by grants from the National Natural Science Foundation of China (81772338 and 81572122), the Interdisciplinary Program of Shanghai Jiao Tong University (YG2017ZD05), and the Shanghai Leading Talent Plan (043).
Contributor Information
Jia Xu, Email: xujia0117@126.com.
Yimin Chai, Email: ymchai@sjtu.edu.cn.
References
- 1. Luan X, Sansanaphongpricha K, Myers I et al. Engineering exosomes as refined biological nanoplatforms for drug delivery. Acta Pharmacol Sin 2017;38:754–763. [DOI] [PMC free article] [PubMed] [Google Scholar]
- 2. Kourembanas S. Exosomes: Vehicles of intercellular signaling, biomarkers, and vectors of cell therapy. Annu Rev Physiol 2015;77:13–27. [DOI] [PubMed] [Google Scholar]
- 3. Zhu Y, Wang Y, Zhao B et al. Comparison of exosomes secreted by induced pluripotent stem cell‐derived mesenchymal stem cells and synovial membrane‐derived mesenchymal stem cells for the treatment of osteoarthritis. Stem Cell Res Ther 2017;8:64. [DOI] [PMC free article] [PubMed] [Google Scholar]
- 4. Huang Z, Feng Y. Exosomes derived from hypoxic colorectal cancer cells promote angiogenesis through Wnt4‐induced beta‐catenin signaling in endothelial cells. Oncol Res 2017;25:651–661. [DOI] [PMC free article] [PubMed] [Google Scholar]
- 5. Jing H, He X, Zheng J. Exosomes and regenerative medicine: State of the art and perspectives. Transl Res 2018;196:1–16. [DOI] [PubMed] [Google Scholar]
- 6. Filion TM, Skelly JD, Huang H et al. Impaired osteogenesis of T1DM bone marrow‐derived stromal cells and periosteum‐derived cells and their differential in‐vitro responses to growth factor rescue. Stem Cell Res Ther 2017;8:65. [DOI] [PMC free article] [PubMed] [Google Scholar]
- 7. Chhabra P, Brayman KL. Stem cell therapy to cure type 1 diabetes: From hype to hope. Stem Cells Translational Medicine 2013;2:328–336. [DOI] [PMC free article] [PubMed] [Google Scholar]
- 8. Sellmeyer DE, Civitelli R, Hofbauer LC et al. Skeletal metabolism, fracture risk, and fracture outcomes in type 1 and type 2 diabetes. Diabetes 2016;65:1757–1766. [DOI] [PMC free article] [PubMed] [Google Scholar]
- 9. Garg P, Mazur MM, Buck AC et al. Prospective review of mesenchymal stem cells differentiation into osteoblasts. Orthop Surg 2017;9:13–19. [DOI] [PMC free article] [PubMed] [Google Scholar]
- 10. Oryan A, Kamali A, Moshiri A et al. Role of mesenchymal stem cells in bone regenerative medicine: What is the evidence? Cells Tissues Organs 2017;204:59–83. [DOI] [PubMed] [Google Scholar]
- 11. Hadjiargyrou M, O'Keefe RJ. The convergence of fracture repair and stem cells: Interplay of genes, aging, environmental factors and disease. J Bone Miner Res 2014;29:2307–2322. [DOI] [PMC free article] [PubMed] [Google Scholar]
- 12. Cramer C, Freisinger E, Jones RK et al. Persistent high glucose concentrations alter the regenerative potential of mesenchymal stem cells. Stem Cells Dev 2010;19:1875–1884. [DOI] [PubMed] [Google Scholar]
- 13. Filipowska J, Tomaszewski KA, Niedzwiedzki L et al. The role of vasculature in bone development, regeneration and proper systemic functioning. Angiogenesis 2017;20:291–302. [DOI] [PMC free article] [PubMed] [Google Scholar]
- 14. Jin P, Zhang X, Wu Y et al. Streptozotocin‐induced diabetic rat‐derived bone marrow mesenchymal stem cells have impaired abilities in proliferation, paracrine, antiapoptosis, and myogenic differentiation. Transplant Proc 2010;42:2745–2752. [DOI] [PubMed] [Google Scholar]
- 15. Zhao YF, Zeng DL, Xia LG et al. Osteogenic potential of bone marrow stromal cells derived from streptozotocin‐induced diabetic rats. Int J Mol Med 2013;31:614–620. [DOI] [PubMed] [Google Scholar]
- 16. Xu J, Wu T, Sun Y et al. Staphylococcal enterotoxin C2 expedites bone consolidation in distraction osteogenesis. J Orthop Res 2017;35:1215–1225. [DOI] [PubMed] [Google Scholar]
- 17. Zhang J, Liu X, Li H et al. Exosomes/tricalcium phosphate combination scaffolds can enhance bone regeneration by activating the PI3K/Akt signaling pathway. Stem Cell Res Ther 2016;7:136. [DOI] [PMC free article] [PubMed] [Google Scholar]
- 18. Hu Y, Rao SS, Wang ZX et al. Exosomes from human umbilical cord blood accelerate cutaneous wound healing through miR‐21‐3p‐mediated promotion of angiogenesis and fibroblast function. Theranostics 2018;8:169–184. [DOI] [PMC free article] [PubMed] [Google Scholar]
- 19. Xu J, Wang B, Sun Y et al. Human fetal mesenchymal stem cell secretome enhances bone consolidation in distraction osteogenesis. Stem Cell Res Ther 2016;7:134. [DOI] [PMC free article] [PubMed] [Google Scholar]
- 20. Malinda KM. In vivo matrigel migration and angiogenesis assay. Methods Mol Biol 2009;467:287–294. [DOI] [PubMed] [Google Scholar]
- 21. Ding H, Gao YS, Wang Y et al. Dimethyloxaloylglycine increases the bone healing capacity of adipose‐derived stem cells by promoting osteogenic differentiation and angiogenic potential. Stem Cells Dev 2014;23:990–1000. [DOI] [PMC free article] [PubMed] [Google Scholar]
- 22. Qi X, Zhang J, Yuan H et al. Exosomes secreted by human‐induced pluripotent stem cell‐derived mesenchymal stem cells repair critical‐sized bone defects through enhanced angiogenesis and osteogenesis in osteoporotic rats. Int J Biol Sci 2016;12:836–849. [DOI] [PMC free article] [PubMed] [Google Scholar]
- 23. Xue C, Shen Y, Li X et al. Exosomes derived from hypoxia‐treated human adipose mesenchymal stem cells enhance angiogenesis through the PKA signaling pathway. Stem Cells Dev 2018;27:456–465. [DOI] [PubMed] [Google Scholar]
- 24. Grosso A, Burger MG, Lunger A et al. It takes two to tango: Coupling of angiogenesis and osteogenesis for bone regeneration. Front Bioeng Biotechnol 2017;5:68. [DOI] [PMC free article] [PubMed] [Google Scholar]
- 25. Liu X, Li Q, Niu X et al. Exosomes secreted from human‐induced pluripotent stem cell‐derived mesenchymal stem cells prevent osteonecrosis of the femoral head by promoting angiogenesis. Int J Biol Sci 2017;13:232–244. [DOI] [PMC free article] [PubMed] [Google Scholar]
- 26. Chen B, Li Q, Zhao B et al. Stem cell‐derived extracellular vesicles as a novel potential therapeutic tool for tissue repair. Stem Cells Translational Medicine 2017;6:1753–1758. [DOI] [PMC free article] [PubMed] [Google Scholar]
- 27. Hao ZC, Lu J, Wang SZ et al. Stem cell‐derived exosomes: A promising strategy for fracture healing. Cell Prolif 2017;50:e12359. [DOI] [PMC free article] [PubMed] [Google Scholar]
- 28. Cui C, Ye X, Chopp M et al. miR‐145 regulates diabetes‐bone marrow stromal cell‐induced neurorestorative effects in diabetes stroke rats. Stem Cells Translational Medicine 2016;5:1656–1667. [DOI] [PMC free article] [PubMed] [Google Scholar]
- 29. Peer A, Khamaisi M. Diabetes as a risk factor for medication‐related osteonecrosis of the jaw. J Dent Res 2015;94:252–260. [DOI] [PMC free article] [PubMed] [Google Scholar]
- 30. Fadini GP, Sartore S, Schiavon M et al. Diabetes impairs progenitor cell mobilisation after hindlimb ischaemia‐reperfusion injury in rats. Diabetologia 2006;49:3075–3084. [DOI] [PubMed] [Google Scholar]
- 31. Meng Y, Eirin A, Zhu XY et al. The metabolic syndrome alters the miRNA signature of porcine adipose tissue‐derived mesenchymal stem cells. Cytometry A 2018;93:93–103. [DOI] [PMC free article] [PubMed] [Google Scholar]
- 32. Kim YS, Kang HJ, Hong MH et al. Angiopoietin‐like 4 is involved in the poor angiogenic potential of high glucose‐insulted bone marrow stem cells. Korean Circ J 2014;44:177–183. [DOI] [PMC free article] [PubMed] [Google Scholar]
- 33. Yaturu S. Diabetes and skeletal health. J Diabetes 2009;1:246–254. [DOI] [PubMed] [Google Scholar]
- 34. Notsu M, Yamaguchi T, Okazaki K et al. Advanced glycation end product 3 (AGE3) suppresses the mineralization of mouse stromal ST2 cells and human mesenchymal stem cells by increasing TGF‐beta expression and secretion. Endocrinology 2014;155:2402–2410. [DOI] [PubMed] [Google Scholar]
- 35. Yang K, Wang XQ, He YS et al. Advanced glycation end products induce chemokine/cytokine production via activation of p38 pathway and inhibit proliferation and migration of bone marrow mesenchymal stem cells. Cardiovasc Diabetol 2010;9:66. [DOI] [PMC free article] [PubMed] [Google Scholar]
- 36. Kume S, Kato S, Yamagishi S et al. Advanced glycation end‐products attenuate human mesenchymal stem cells and prevent cognate differentiation into adipose tissue, cartilage, and bone. J Bone Miner Res 2005;20:1647–1658. [DOI] [PubMed] [Google Scholar]
- 37. Weinberg E, Maymon T, Weinreb M. AGEs induce caspase‐mediated apoptosis of rat BMSCs via TNFalpha production and oxidative stress. J Mol Endocrinol 2014;52:67–76. [DOI] [PubMed] [Google Scholar]
- 38. Zhang B, Liu N, Shi H et al. High glucose microenvironments inhibit the proliferation and migration of bone mesenchymal stem cells by activating GSK3beta. J Bone Miner Metab 2016;34:140–150. [DOI] [PubMed] [Google Scholar]
- 39. Cao B, Liu N, Wang W. High glucose prevents osteogenic differentiation of mesenchymal stem cells via lncRNA AK028326/CXCL13 pathway. Biomed Pharmacother 2016;84:544–551. [DOI] [PubMed] [Google Scholar]
- 40. Keats EC, Dominguez JM 2nd, Grant MB et al. Switch from canonical to noncanonical Wnt signaling mediates high glucose‐induced adipogenesis. Stem Cells 2014;32:1649–1660. [DOI] [PMC free article] [PubMed] [Google Scholar]
- 41. Qin Y, Sun R, Wu C et al. Exosome: A novel approach to stimulate bone regeneration through regulation of osteogenesis and angiogenesis. Int J Mol Sci 2016;17:712. [DOI] [PMC free article] [PubMed] [Google Scholar]
- 42. Tao SC, Guo SC, Li M et al. Chitosan wound dressings incorporating exosomes derived from microRNA‐126‐overexpressing synovium mesenchymal stem cells provide sustained release of exosomes and heal full‐thickness skin defects in a diabetic rat model. Stem Cells Translational Medicine 2017;6:736–747. [DOI] [PMC free article] [PubMed] [Google Scholar]
- 43. Wang Y, Ma WQ, Zhu Y et al. Exosomes derived from mesenchymal stromal cells pretreated with advanced glycation end product‐bovine serum albumin inhibit calcification of vascular smooth muscle cells. Front Endocrinol 2018;9:524. [DOI] [PMC free article] [PubMed] [Google Scholar]
- 44. Brito‐Casillas Y, Melian C, Wagner AM. Study of the pathogenesis and treatment of diabetes mellitus through animal models. Endocrinol Nutr 2016;63:345–353. [DOI] [PubMed] [Google Scholar]
Associated Data
This section collects any data citations, data availability statements, or supplementary materials included in this article.
Supplementary Materials
Figure S1: Effects of dBMSC‐exos and nBMSC‐exos on the proliferation, migration and osteogenesis of BMSCs under the high glucose condition. For normal glucose (NG) group, BMSCs were cultured under 5.5 mM glucose condition without exosome treatment; for the high glucose (HG) treatment groups, BMSCs were cultured under 25 mM glucose condition treated with 1 × 10^10/mL dBMSC‐exos, 1 × 10^10/mL nBMSC‐exos, or without exosomes (Control). (a) Viability of BMSCs after treatment with dBMSC‐exos and nBMSC‐exos. CCK‐8 assay was performed at day 5 after treatment. (b‐c) Transwell assay. (d‐f) The expression of osteogenic differentiation‐related markers (COL1 and RUNX2) were investigated by WB. (g‐h) Osteogenic differentiation of BMSCs was examined by alizarin red S staining (g) and calcium mineralization was quantified by the OD (h). This experiment was repeated independently three times. Data are presented as the mean ± SD. *P < .05 compared with the control group, #P < .05 compared with the dBMSC‐exos treatment group at the same exosome concentration.
Figure S2: Effects of dBMSC‐exos and nBMSC‐exos on the proliferation, migration and angiogenic activity of HUVECs under the high glucose (HG) condition. For the normal glucose (NG) group, HUVECs were cultured under the 5.5 mM glucose condition without exosome treatment; for the HG treatment groups, BMSCs were cultured under 25 mM glucose condition treated with 1 × 10^10/mL dBMSC‐exos, 1 × 10^10/mL nBMSC‐exos, or without exosomes (Control). (a) Viability of HUVECs after treatment with dBMSC‐exos and nBMSC‐exos. CCK‐8 assay was performed at day 5 after treatment. (b‐c) Transwell assay. (d‐e) VEGFA expression as examined by WB. (f‐h) HUVEC tube formation, as observed by light microscopy (f) and quantified by total tube length (g) and total branch points (h). This experiment was repeated independently three times. Data are presented as the mean ± SD. *P < .05 compared with the control group, #P < .05 compared with the dBMSC‐exos treatment group at the same exosome concentration.
Figure S3: Effects of dBMSC‐exos and nBMSC‐exos on bone regeneration of calvarial defects in T1DM rats. T1DM was induced via intraperitoneal injection of streptozotocin. At day 7 after induction, rats showing blood glucose levels higher than 16.7 mmol/l were confirmed to have T1DM and thus were selected. Fifteen T1DM rats were randomized into three groups according to the following implants: (1) hydrogel mixed with BMSCs (control group) (n = 5); (2) hydrogel mixed with BMSCs treated with dBMSC‐exos (dBMSC‐exos group) (n = 5); and (3) hydrogel mixed with BMSCs treated with nBMSC‐exos (nBMSC‐exos group) (n = 5). At 4 weeks after surgery, an evaluation of bone regeneration was performed. (a) 3D reconstruction and coronal images obtained by micro‐CT. (b‐c) Quantitative morphometric analysis of BV/TV and BMD of newly formed bone in the defects. Data are presented as the mean ± SD. *P < .05 compared with the control group, #P < .05 compared with the dBMSC‐exos treatment group.
Data Availability Statement
The data that support the findings of this study are available from the corresponding author upon reasonable request.