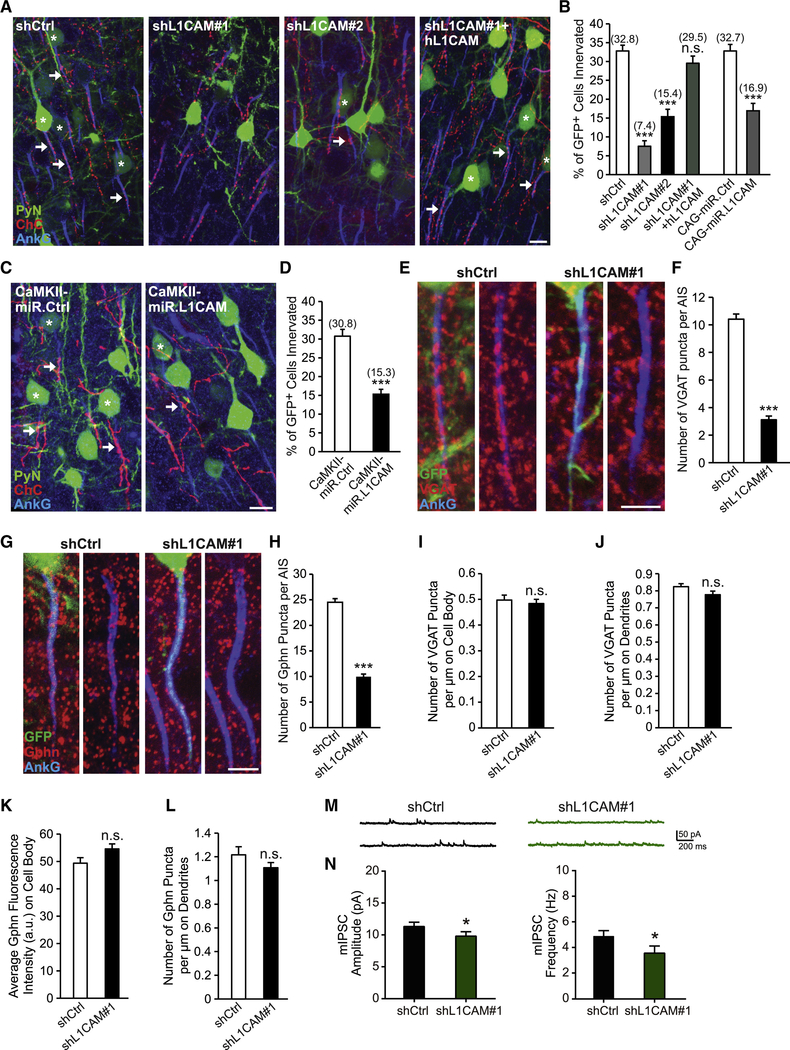
Figure 3. PyN L1CAM is Required for Neocortical PyN AIS Synaptic Innervation by ChC Cartridges.
(A) Representative images of PyNs innervated by ChC cartridges in LII of somatosensory cortex from Nkx2.1-CreER;Ai9 mice electroporated at E15.5 with plasmids expressing EGFP and shCtrl, shL1CAM#1, shL1CAM#2, or shL1CAM#1 + human L1CAM (hL1CAM) and sacrificed at P28. Scale bar, 10 μm.
(B) Quantification of the percentage of GFP+ PyNs innervated by single RFP+ ChCs at P28. Innervation percentages are indicated for each condition (in Fig. 3B and D). 9–16 ChCs and 17–126 GFP+ PyNs per ChC from 3 animals were analyzed for each condition; one-way ANOVA, post hoc Tukey-Kramer test (left) and Student’s t test (right).
(C) Representative images of PyNs innervated by ChC cartridges in LII of somatosensory cortex from Nkx2.1-CreER;Ai9 mice electroporated at E15.5 with plasmids expressing EGFP and CAMKII-miR.Ctrl or CAMKII-miR.L1CAM and sacrificed at P28. Scale bar, 10 μm.
(D) Quantification of the percentage of GFP+ PyNs innervated by single RFP+ ChCs at P28. 10–14 ChCs and 32–147 GFP+ PyNs per ChC from 3 animals were analyzed for each condition; Student’s t test.
(E, G) Representative images of GFP+ PyN AISs in LII of somatosensory cortex from CD1 mice electroporated at E15.5 with plasmids expressing EGFP and shCtrl or shL1CAM#1 and sacrificed at P28. Inhibitory synapses are visualized by immunostaining for the GABAergic presynaptic marker VGAT (red; E) or the GABAergic postsynaptic marker gephyrin (Gphn; red; G). Scale bars, 5 μm.
(F, H) Quantification of the average number of VGAT (F) or gephyrin (H) puncta per GFP+ PyN AIS at P28. 33–43 AISs from 3 animals were analyzed for each condition; Student’s t tests.
(I) Quantification of the average number of VGAT puncta per μm on GFP+ PyN cell bodies at P28. 30 cell bodies from 3 animals were analyzed for each condition; Student’s t test.
(J, L) Quantification of the average number of VGAT (J) or gephyrin (L) puncta per μm on the dendrites of GFP+ PyNs at P28. 24–51 dendrites from 3 animals were analyzed for each condition; Student’s t tests.
(K) Quantification of the average fluorescence intensity (AU) of gephyrin on the cell body of GFP+ PyNs at P28. 34 cell bodies from 3 animals were analyzed for each condition; Student’s t test.
(M) Representative traces of mIPSCs recorded from GFP+ PyNs in LII/III of somatosensory cortex from CD1 mice electroporated at E15.5 with plasmids expressing EGFP and shCtrl or shL1CAM#1 and sacrificed at P27-P30.
(N) Quantification of mIPSC amplitude (left) and frequency (right). 16 GFP+ PyNs from 4 animals were analyzed for each condition; Student’s t tests.
n.s. indicates p ≥ 0.05, *p < 0.05, ***p < 0.001. Data are mean ± SEM. See also Fig. S1, S2, and S3.

