Abstract
Tactile BCIs have gained recent popularity in the BCI community due to the advantages of using a stimulation medium which does not inhibit the users visual or auditory senses, is naturally inconspicuous, and can still be used by a person who may be visually or auditorily impaired. While many systems have been proposed which utilize the P300 response elicited through an oddball task, these systems struggle to classify user responses with accuracies comparable to many visual stimulus based systems. In this study, we model the tactile ERP generation as label noise and develop a novel BCI paradigm for binary communication designed to minimize label confusion. The classification model is based on a modified Gaussian mixture and trained using expectation maximization (EM). Finally, we show after testing on multiple subjects that this approach yields cross-validated accuracies for all users which are significantly above chance and suggests that such an approach is robust and reliable for a variety of binary communication-based applications.
Keywords: EEG, brain-computer interfaces, tactile BCI, uncertain labels
1. INTRODUCTION
Brain computer interfaces (BCIs) restore autonomous actions by allowing users to communicate and control devices through the measurement of electrical signals from their brain activity [1]. These systems work by employing a user to complete a task designed to elicit a signature EEG response termed an Event-Related Potential (ERP). Perhaps the most studied ERP utilized in BCIs is the P300, which corresponds to a sharp inflection in EEG activity in response to rare or surprising stimulus. The P300 can be elicited using many forms of stimulus, most commonly visual [2], but more recently, auditory [3] and tactile. Tactile based stimulation has enjoyed recent interest due to the ergonomic and conventional advantages it has shown over other stimulation modalities. For example, tactile stimulation leaves a user’s visual and auditory senses unencumbered by the BCI task which is an obvious advantage in navigation based BCIs [4]. The tactors used for stimulation are also small and unobtrusive, allowing them to remain hidden and used inconspicuously. Unfortunately, tactile P300 BCIs have faced significant obstacles in terms of online classification accuracy [5, 6] and decision speed compared to their visual based counterparts [7]. The experiments employed in this study were designed with the primary goal of gaining deeper understanding why this is the case. To this end, three distinct components that affect BCI performance were examined: stimulus presentation, BCI paradigm, and the inference model.
For the inference model to achieve the best possible classification accuracy, the elicited ERPs must be distinguishable from user’s latent EEG activity. In the case of the P300, this is achieved by maximizing the amplitude of the major inflection, called the P3 component. Extensive work as been done to investigate the ideal conditions in which P3 amplitude is maximized. Gonsalvez, et al. identified the target-to-target interval (ITI) to be one of the most critical parameters influencing P3 amplitude [8]. Additionally, many studies have examined the connection between performance and tactor placement. Van Erp, et al. tested the effect of using different numbers of tactors placed around the waist and reported the lowest performance for paradigms which use the most tactors [9].
The purpose of the BCI task is to provide the user with a way to give selective attention to a rare stimulus based on the user’s intent. The BCI paradigm consequently controls how the user traverses the task. A number of different task/paradigm pairs have been investigated in the search for a combination that yields high offline performance.
Being a relatively new BCI modality, tactile BCI systems have experienced minimal exploration in inference models. User intent is classified on a per trial basis, with a trial defined as the recorded EEG voltage for a given channel from a specified time after stimulation through the expected duration of the ERP. In many studies, LDA or SWLDA is used to build a classifier which finds the best separation between the reduced samples through a supervised learning process [6]. The learned decision boundary can then be used to classify unlabelled samples as target or non-target. Orhan et al. proposed the use of Regularized Discriminant Analysis (RDA) with kernel density estimation (KDE) as an alternative discriminant function and demonstrated its success in a visual BCI [2]. In this paper, we enhance the traditional ERP classififer by adding a user confusion component that can be modeled with a Gaussian mixture.
2. METHODS
2.1. Data Collection
EEG was sampled at 512 Hz using a g.USBamp biosignal amplifier and active g.Butterfly electrodes (G.tec, Austria). The electrodes were placed on a g.GAMMAcap at positions Fz, FC1, FC2, Cz, CP1, CP2, and Pz as determined by the International 10/20 System. The EEG signals were streamed to MATLAB (The Mathworks, Inc.) and digitally bandpass filtered (FIR, linear phase, passband [0.5, 45] Hz). For each stimulus, the corresponding EEG response was taken throughout the stimulus duration (≈500 ms), considering the group delay of the FIR filter appropriately.
2.2. Stimulus Presentation
Stimulation is delivered by vibrating tactors (HIHX 09C005–8 Miniature audio exciter, Tectonic Elements Ltd.) on the skin. The hardware and software to drive the tactors were designed in house. Tactors are driven at 200 Hz vibration to isolate noise introduced by the mechanical vibrations on the EEG frequency spectrum. Tactors are tested before the session on each subject to confirm that stimulus perception is relatively similar for each tactor. Tactors held in the subject’s hands are securely fastened to the index finger. A second pair tactors are secured to each leg near the anterior surface of the subject’s lower thigh to be used as distractors.
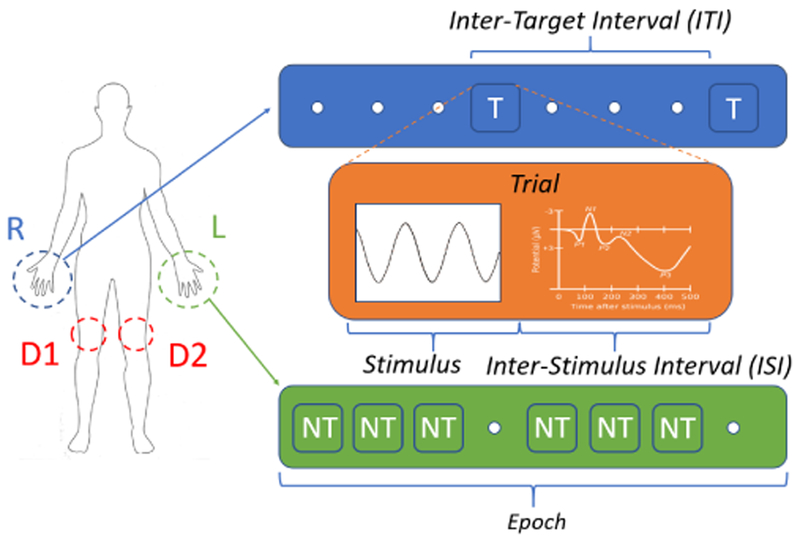
Stimulation and the corresponding hardware triggers are controlled using our novel, multi-sensory BCI system. The tactile stimulation framework was designed such that system actions are associated to each tactor; similar to how rapid serial visual presentation operates, the system delivers vibrations in quick succession. The ERP is evoked when the user concentrates on the target tactor corresponding to their decision. Figure 1 provides a visualization of the stimulus presentation and important design parameters for a typical tactile BCI task. Epochs are designed to be relatively short with breaks in between each one to mitigate mental fatigue. ITI is uniformly random between 8 and 14 trials (4.8 and 8.4 seconds). The duration of each vibrational pulse is 0.1 seconds. ISI is uniformly random between 0.1 and 0.5 seconds to maximize unpredictability.
Fig. 1:
Representation of typical tactile BCI experiment with target tactors (R and L) and distractors (D1 and D2).
For discrimination tasks where there are multiple “rare” tactors, the user receives 240 rare stimulations (120 Target, 120 Non-Target) over a variable number of epochs. The number of targets and/or non-targets presented during each epoch is uniformly random between 4 and 7.
2.3. BCI Task
Two distinct BCI tasks were used to evaluate how particular paradigm changes would affect subject ERPs and performance during discrimination tasks. All subjects adhered to the same experiment protocol designed to ensure they completely understood each task. Subjects were instructed to try to be still and minimize blinking during the task. Both tasks were performed in a quiet room where only the subject and proctor were present to minimize distractions. All subjects were asked to count the number of rare stimuli in each epoch and then report that number at the end of the epoch. If the user lost track and counted incorrectly, the data from that epoch was thrown away.
2.3.1. Task One - Four Tactor Simultaneous Oddball
This discrimination task replicates popular paradigms that use “distractors” to create multiple rare tactors. The Target response is the ERP evoked by a stimulus delivered by the odd-ball tactor that the user is attentive to, while the Non-Target response is the presumably flat ERP following an ignored stimulus delivered by the other oddball tactor. At the start of each epoch, the user is instructed to count the pulses delivered to one hand and to ignore all other stimuli. User intent is determined by classifying the set of ERPs corresponding to each oddball tactor as either the Target or Non-Target class. The tactor that the user counts is alternated every 2 epochs to generalize the training algorithm. The two distractors deliver stimuli in a random order but at equal rates so that neither are rare with respect to the other.
2.3.2. Task Two - Three Tactor Sequential Oddball
This task is designed to optimize the consistency of the user’s response to Target and Non-Target stimulus across trials by completely separating the objectives of responding and ignoring rare stimuli. For a given epoch, the user either: counts the pulses delivered to the right hand (Target) or performs a mental math exercise and ignores the stimuli delivered to the left hand (Non-Target). Only three tactors are utilized during a given epoch (R,D1,D2 or L,D1,D2). In the context of a “yes” or “no” question, the “yes” response is encoded in action of counting and being attentive, while the “no” response is encoded in the action of ignoring the stimulus. This is different from Task One where the action of counting and being attentive to either the right or left hand and the action of ignoring the other hand encodes the user’s response. Because each response is trained separately, there is no need to alternate the Target/Non-Target tactor assignment.
2.4. EEG Signal Model and Inference
Standard ERP based classifiers divide training data according to class labels in a supervised process. In previous BCI models, labelling training data is simple since the ERP is assumed to be a deterministic process. Under this assumption, the EEG features are directly inferred from the class label (Target/Non-Target). Clearly, the mechanics of the ERP are not purely deterministic and more closely resemble a stochastic process. This means that each class will be “contaminated” with trials that contain EEG features which correspond to an ERP response that should be associated with a different class. We propose a new model which takes the non-deterministic nature of the ERP into account and decouples the targetness of a trial from the possibility of finding an ERP in it.
EEG is modeled as a distribution conditioned on the presence of ERP: with class dependent mean and covariance and EEG s ∈ {0, 1}. This is in accordance to standard analysis that models the signals with a Gaussian distribution. Our approach differs from classical BCI models by allowing the ERP to be a random state related but not equivalent to whether a target was presented to the user. Decoupling both states allows the model to better characterize user distraction, character or stimulus confusion, among others. To perform inference, we compute the posterior probability given EEG evidence x:
| (1) |
where c ∈ {0, 1} corresponds to the whether a given stimulus is target or non-target and p(c) is the prior distribution derived from context evidence such as a language model. The conditional probability p(s|c) can be learned from calibration data and corresponds to the probability of observing an ERP given a target or non-target stimulus. This conditional distribution has two degrees of freedom and is parametrized as:
| (2) |
Learning the set of parameters {μs, Σs, γc} for c ∈ {0, 1} and s ∈ {0, 1} has not explicit closed form solution. We use expectation maximization to evaluate the complete likelihood and update the parameters iteratively. For a dataset comprised of EEG signals and label pairs , the Q-function for the E-step is defined as:
| (3) |
for all calibration trials corresponds to the parameter set at the k-th iteration. For the M-step, the update equation for each parameter is defined as follows:
| (4) |
| (5) |
| (6) |
| (7) |
| (8) |
with p(s|xn, cn) obtained by normalizing equation 3 appropriately. Although this model better captures the stochastic relationship between targetness and ERP generation, estimating Σs for high dimensional EEG from only a limited number of samples resulted in poor classification performance. We applied l1 regularization on the covariance estimate by replacing the equation above with the following update:
| (9) |
| (10) |
| (11) |
C corresponds to the regularized precision matrix while S corresponds to the weighted sample covariance. The l1 norm of a matrix is defined as . This convex problem can be solved iteratively via graphical lasso [10].
EEG data has very high dimensionality which must be reduced to minimize sparsity. The number of channels being processed are reduced to Fz, Cz, and Pz which typically contain the most prominent P300 features. Trials are then windowed to only keep samples between 0.2 and 0.4 seconds post-stimulation so that classification is focused exclusively on the P3 component of the ERP. The windowed trials are then downsampled by a factor of 4 to further reduce redundancy. The final step to apply principal component analysis (PCA), where the two most dominant components are used for reduction.
3. RESULTS
3.1. Discrimination Task Performance
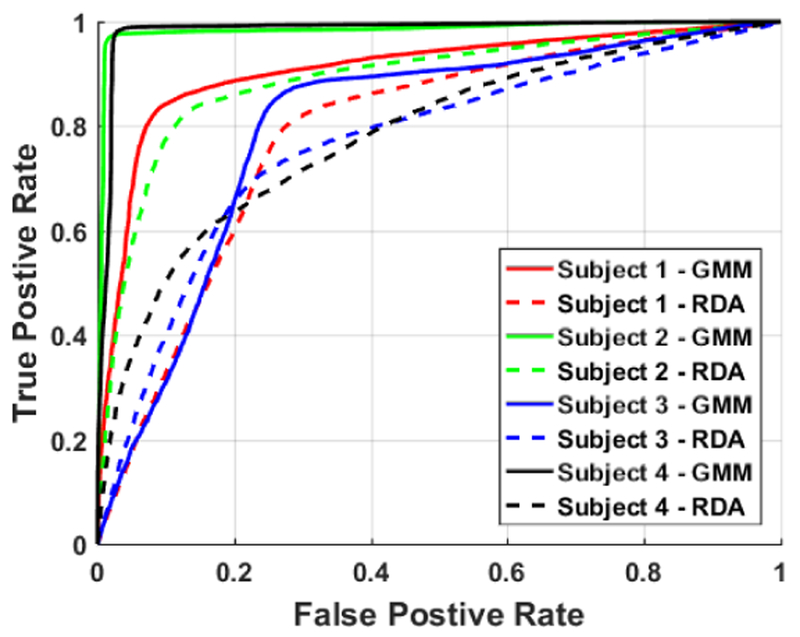
To quantify the classification performance for each BCI task, two different classification tools were used. The final accuracy of the subject for a given task was calculated as the Area Under Curve (AUC) (Table 1) of the subject’s corresponding ROC (Fig. 2). Classification accuracy varied widely across task and classification method for each subject. Almost every subject showed improvement in Task Two over Task One. Furthermore, GMM classification resulted in improved or equivalent accuracy over RDA classification for every subject.
Table 1:
AUC for all subjects in Tasks One and Two.
| T1-RDA | T1-GMM | T2-RDA | T2-GMM | |
|---|---|---|---|---|
| Subject 1 | 59.74 | 58.65 | 78.53 | 90.87 |
| Subject 2 | 72.23 | 91.37 | 88.96 | 98.50 |
| Subject 3 | 55.99 | 76.30 | 75.57 | 88.50 |
| Subject 4 | 67.30 | 64.71 | 78.36 | 98.42 |
Fig. 2:
Classifier performance across subjects.
Each subject participated in a brief discussion once all tasks were completed to hear about their experience during the tests. When asked to compare the difficulty of performing Tasks One and Two, subjects unanimously agreed that the Task Two paradigm provided an easier and more natural way to select target and non-target stimuli over the Task One paradigm.
3.2. Uncertainty in Labels
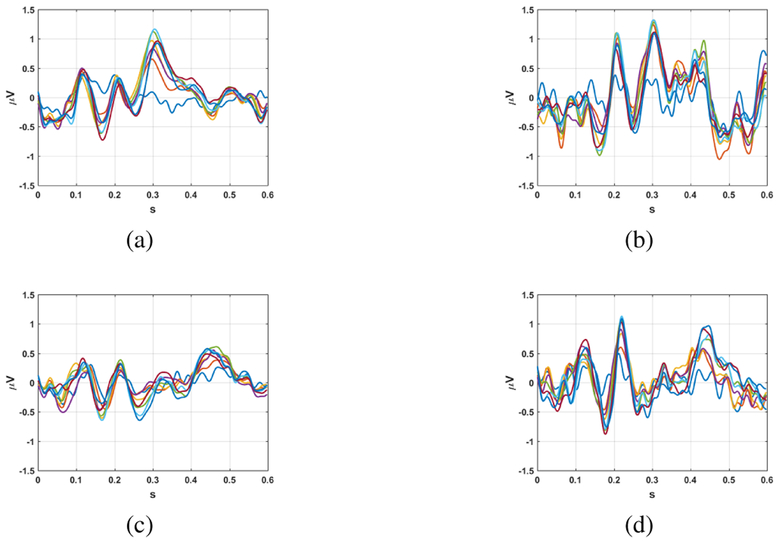
Label noise was assessed by processing the results of Tasks 1 and 2 using the RDA classification pipeline and comparing the class-specific, average ERPs of correctly and incorrectly classified trials. Examining these results for a single subject (Figure 3), a pattern is observed. Incorrectly classified Non-Target trials (Fig. 3b) on average exhibit a P3 that looks very similar to the correctly classified target trials (Fig. 3a). Conversely, the incorrectly classified Target trials (Fig. 3d) lack a visible P3 component just like the correctly classified non-target trials (Fig. 3c).
Fig. 3:
(a–d) Average EEG response of Subject 2 for Task Two separated into 4 different categories. (a) Average target trials (true positives). (b) Average non-target trials (false positives). (c) Average non-target trials (true negatives). (d) Average target trials (false negatives).
To obtain a rough estimate of label noise, the percentage of trials classified incorrectly using the RDA pipeline was calculated for each class, task, and subject (2. This is a rough estimate because it implies the assumption that all incorrectly classified trials are the result of label noise which we know from examination of individual trials is not the case. This assumptions is close to true for classification accuracies of at least 65%, but it breaks down for performances below that level which is why there are no estimates in Task 1 for Subjects 1 and 3. Despite this, the results demonstrate that label noise was reduced in Task 2 compared to Task 1 for all subjects.
4. DISCUSSION
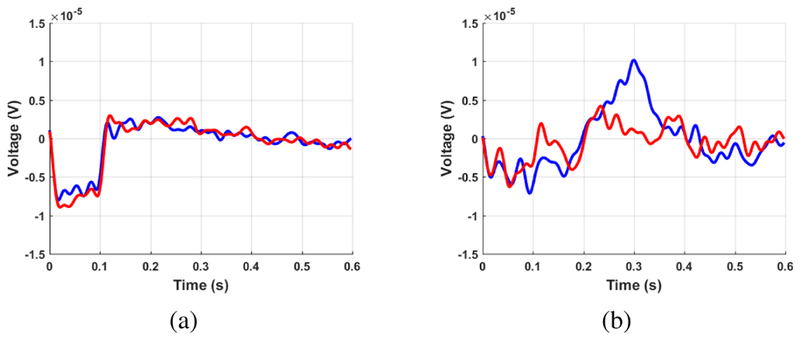
The results of Tasks One and Two suggest that, as hypothesized, label noise plays a significant role in tactile BCI performance. The results of our proposed method, which incorporates label noise into both the BCI paradigm and inference model, all subjects increased performance over traditional methods. Furthermore, a direct correlation between improved performance and a global decrease in label noise was observed. These trends are reflected the average ERP’s from Tasks One and Two, which are shown for a single subject in Figure 4.
Fig. 4:
Average target (blue) and non-target (red) EEG response for tasks 1 (a) and 2 (b)
From our results, experience, and discussion with the subjects, we believe the key component in the success of the Task Two paradigm was that when the user experienced a rare stimuli, they already knew beforehand whether they should be attentive or not. In some ways this feels counter-intuitive, since P300 relies on effectively “surprising” the user. What this study found, however, was that randomness in stimulus timing was perfectly sufficient for most users to elicit a distinguishable P3 and that randomness in Target/Non-Target appearance actually decreases the probability that the user elicited the EEG response associated with their intent. Without question, the presented results suggest that a label noise model must be incorporated into the paradigm for any tactile stimulation based BCI system to achieve relevant online classification performance.
5. CONCLUSIONS
This study investigated the consistency of the P300 response when elicited using tactile stimulation through three different BCI tasks. The first task used four tactors (two distractors, one Target, one Non-Target) and the users were tasked to try and be attentive to one tactor while ignoring another, which resulted in a very low classification accuracy for all users. By comparing average ERPs of correctly and incorrectly classified trials, it revealed that users were eliciting a P300 in response to the Target stimuli at a much lower rate than expected. We hypothesized that this phenomenon was a result of the randomness in Target and Non-Target stimuli appearance. A second task was tested that employed a novel paradigm and inference model designed to reduced false-positive and false-negative ERP rates and incorporate label noise into the decision making model. These changes enabled all users who participated in the study to use our system to answer binary questions at over 90% accuracy. To the best of our knowledge, this is the first study using a tactile BCI to demonstrate such performance rates using a paradigm that can be used for online classification. In future studies, we will extend this model toward subjects particularly those that could benefit from its use in a clinical setting.
Table 2:
Estimations of the label noise separated by class and task for all subjects. Values in percentage.
| T1 - T | T1 - NT | T2 - T | T2 - NT | |
|---|---|---|---|---|
| Subject 1 | - | - | 10.45 | 30.77 |
| Subject 2 | 38.24 | 24.53 | 23.53 | 11.32 |
| Subject 3 | - | - | 33.90 | 62.26 |
| Subject 4 | 44.54 | 34.40 | 44.44 | 23.81 |
Acknowledgments
Our work is supported by NSF (IIS-1149570, CNS-1544895), NIDLRR (90RE5017-02-01), and NIH (R01DC009834).
6. REFERENCES
- [1].Farwell LA and Donchin E, “Talking off the top of your head: toward a mental prosthesis utilizing event-related brain potentials.,” Electroencephalography and clinical neurophysiology, vol. 70, pp. 510–523, 1988. [DOI] [PubMed] [Google Scholar]
- [2].Orhan Umut RSVP Keyboard: An EEG Based BCI Typing System with Context Information Fusion, Ph.D. thesis, Northeastern University, 2013. [Google Scholar]
- [3].Hill NJ, Lal Thomas Navin, Bierig K, Birbaumer N, and Schölkopf Bernhard, “An Auditory Paradigm for Brain–Computer Interfaces,” Advances in Neural Information Processing Systems, 2004. [Google Scholar]
- [4].van Erp Jan B. F, “Guidelines for the Use of Vibro-Tactile Displays in Human Computer Interaction,” Proceedings of Eurohaptics, pp. 18–22, 2002. [Google Scholar]
- [5].Kaufmann Tobias, Holz Elisa M., and Kübler Andrea, “Comparison of tactile, auditory, and visual modality for brain-computer interface use: A case study with a patient in the locked-in state,” Frontiers in Neuroscience, vol. 7, no. 7 July, pp. 1–12, 2013. [DOI] [PMC free article] [PubMed] [Google Scholar]
- [6].Lugo Zulay R, Rodriguez Javi, Lechner Alexander, Ortner Rupert, Gantner Ithabi S, Laureys Steven, Noirhomme Quentin, and Guger Christoph, “A vibrotactile p300-based brain-computer interface for consciousness detection and communication.,” Clinical EEG and neuroscience, vol. 45, pp. 14–21, 2014. [DOI] [PubMed] [Google Scholar]
- [7].Kaufmann Tobias, Herweg Andreas, and Kübler Andrea, “Toward brain-computer interface based wheelchair control utilizing tactually-evoked event-related potentials,” Journal of NeuroEngineering and Rehabilitation, vol. 11, no. 1, pp. 7, 2014. [DOI] [PMC free article] [PubMed] [Google Scholar]
- [8].Gonsalvez Craig L and Polich John, “P300 amplitude is determined by target-to-target interval.,” Psychophysiology, vol. 39, no. 3, pp. 388–396, 2002. [DOI] [PubMed] [Google Scholar]
- [9].Brouwer a. M and Van Erp JBF, “A tactile P300 BCI and the optimal number of tactors: Effects of target probability and discriminability,” Proceedings of the 4th International Brain-Computer Interface Workshop and Training Course 2008, pp. 280–285, 2008. [Google Scholar]
- [10].Friedman Jerome, Hastie Trevor, and Tibshirani Robert, “Sparse inverse covariance estimation with the graphical lasso,” Biostatistics, vol. 9, no. 3, pp. 432–441, July 2008. [DOI] [PMC free article] [PubMed] [Google Scholar]


