

Abstract
Background:
While attention-deficit/hyperactivity disorder (ADHD) has been associated with higher body mass index (BMI), little research has focused on how this association differs by sex or race/ethnicity.
Objective:
To investigate the association between ADHD and BMI by sex and race/ethnicity (i.e., European [EA], African [AA] and Hispanic American [HA]).
Methods:
Data came from the National Longitudinal Survey of Adolescence to Adult Health waves II to IV (n= 13,332, age: 12 to 34 years). Based on self-reported childhood ADHD symptoms between the ages of 5 and 12 years, participants were categorized into: ADHD predominantly hyperactive/impulsive (ADHD-HI); ADHD predominantly inattentive (ADHD-I); ADHD combined (ADHD-C; a combination of ADHD-HI and ADHD-I symptoms); and non-ADHD.
Results:
The patterns of ADHD-BMI associations in the transition period between adolescent and young adulthood differed by sex and race/ethnicity. Compared to non-ADHD, ADHD-HI was associated with higher BMI among EA males and females while ADHD-I was associated with higher BMI among EA females. ADHD-C was associated with higher BMI for HA females. We found no evidence of an association among AA males and females and HA males.
Conclusion:
These study results suggest that the association between ADHD subtypes and BMI might differ across population subgroups in the U.S.
Keywords: Longitudinal Studies, United States, African Americans, Hispanic Americans, obesity
Introduction
Attention-deficit/hyperactivity disorder (ADHD) is a common childhood-onset neurodevelopmental disorder that persists into adulthood [1]. In the U.S., the prevalence of ADHD is 9.5% among individuals aged 4 to 17 years old [2] and 4.4% in the adult population [3]. A variety of negative behavioral and physical health outcomes, such as smoking, substance abuse, risky sexual behaviors, sleeping disorder, injuries, pain, hypertension, diabetes, physical multi-morbidity and early mortality, have all been linked to ADHD [4–6], which may be associated with its core features (i.e., inattention (IA), and hyperactivity/impulsivity (HI)).
Obesity is another negative health outcome that has been linked with ADHD. Cortese et al. [7–9] concluded that ADHD was positively associated with obesity in children and adults. For example, Cortese et al. [7], which used information collected in 42 studies, reported that ADHD was linked with a 55% increase in the risk of being obese among adult and a 20% increase among children. Nigg et al. [10] also reported that the magnitude of the effect was larger in adults over 18 years old than in children. Potential mechanisms linking ADHD and obesity may include genetic factors, poor executive function, dysregulated reward processing, psychosocial stress, physical activity, eating patterns and sleep pattern alterations [11–13].
Using information collected in the National Longitudinal Survey of Adolescence to Adult Health (Add Health), Fuemmeler et al. [14] also suggested a positive association between ADHD symptoms and obesity during adolescence and young adulthood. Our study builds on their study and will examine sex and race/ethnic differences in the association between ADHD and increased body mass index (BMI) trajectories. As of yet, there has been little focus on this topic even though evidence suggests that there are sex and racial/ethnic differences in BMI [15, 16] and the prevalence of ADHD in the U.S. [2]. A previous study in the U.S. sample reported a higher ADHD prevalence in boys (13.3%) than in girls (5.6%) and in European Americans (EA, 11.5%) than in African Americans (AA, 8.9%) and Hispanic Americans (HA, 6.3%) [2]. It is possible that these variations may be linked with different pattern in the association between ADHD and BMI by sex or race/ethnicity. If that is the case, statistical adjustment for sex or race/ethnicity, which is a common approach in previous studies, may mask potentially important differences in the association among race/ethnicity.
We also focus on the role of three ADHD subtypes, i.e., the predominantly hyperactive-impulsive type (ADHD-HI), inattentive type (ADHD-I) and combined type (a combination of the two types (ADHD-C)). Not only comparatively little has been studied in relation to the association between these subtypes and BMI or obesity, but also have there been mixed results. For example, Fuemmeler et al. [14] reported that ADHD-HI symptom subtype, but not ADHD-I symptom subtype or ADHD-C symptom subtype, was associated with higher odds of obesity in Add Health while Khalife et al. [17] reported among participants from the Northern Finland Birth Cohort followed up for 8 years from the age of 8 years old that all three types were associated with obesity. More research is needed to better understand how these subtypes, which are suggested to have distinct aberrations in brain network organization [18, 19], are associated with BMI trajectories.
The purpose of this study therefore, is to investigate if there are sex and racial/ethnic differences in the longitudinal association between childhood ADHD symptom subtypes and BMI in the transition period between adolescent and young adulthood, using information collected in the Add Health.
Methods
Participants
Add Health is a nationally representative, longitudinal study that was initiated in 1994/95. At that time, 20,745 participants at 132 middle and high schools were recruited into the study (i.e., in-home interview). More specifically, a probability sample of 80 high schools and its feeder middle schools were chosen. As some schools had more grades (e.g., Grade 7 to 12 secondary schools), the number of feeder middle school included in the study was 52. Approximately 17 students were randomly chosen from grade- and sex-strata to yield approximately 200 adolescents from each of the 80 school pairs. In addition to this, supplemental samples were drawn based on ethnicity, genetic relatedness to siblings, adoption status and disability. As a result, the core and supplemental samples in Wave I included 20,745 adolescents. The cohort was followed up in 1996 (Wave II), 2001/02 (Wave III), 2007/08 (Wave IV) and 2016 (Wave V).
We used information obtained in Waves II to IV when the participants were adolescents and young adults. After excluding those participants who were not EA, AA or HA (n = 1,876), those with missing information on BMI (n = 1,470), ADHD symptom subtype (n = 3,989) and geographic region of residence (n = 78), 13,332 participants were included in the analytic sample (EA: 3,707 men and 4,141 women; AA: 1,380 men and 1,744 women; HA: 1,181 men and 1,179 women) with 35,043 observations in total. Information on the study variables is summarized in Table S1.
The study protocol was approved by the Institutional Review Board, University of North Carolina Chapel Hill. Subjects gave written informed consent for participation in the study.
Body mass index
Height and weight were measured in Waves II, III and IV using a tape measure and a digital scale by trained non-medical field interviewers; height was measured to the nearest 0.5 cm and weight was measured to the nearest 0.1 kg [20]. Information on BMI was obtained by calculating weight (kg) divided by squared height (m2). To reduce skewness, BMI was log-transformed.
Childhood ADHD symptom subtypes
ADHD symptom subtypes was defined by using self-reported information collected at Wave III; participants were asked to retrospectively describe the presence of symptoms between the ages of 5 and 12. A total of 17 items from the Diagnostic and Statistical Manual-IV (DSM-IV) ADHD symptom list (9 questions on inattention (IA) symptoms and 8 questions on hyperactivity/impulsivity (HI) symptoms) were used to assess ADHD symptoms. Response options included ‘never’ or ‘rarely’, ‘sometimes’, ‘often’, ‘very often’ with participants categorized as having a symptom when they responded ‘often’ or ‘very often.’ Following the lead of Fuemmeler et al. [14], we categorized participants into the following four ADHD symptom subtypes (i.e., Non-ADHD: < 6 IA symptoms and < 6 HI symptoms; ADHD-I: ≥ 6 IA symptoms and < 6 HI symptoms; ADHD-HI: < 6 IA symptoms and ≥ 6 HI symptoms; and ADHD-C: ≥ 6 IA symptoms and ≥ 6 HI symptoms).
Covariates
Socio-demographic covariates include age (in years; based on information on age in months), age-squared and age-cubed terms, sex, household income (standardized by dividing the household income at Wave I by the squared root of the number of household members, which was then categorized into tertiles), study regions (West, Midwest, South, and Northeast) and whether BMI was imputed with self-reported measures. We also adjusted for the oversampling of highly educated AA participants (which was done to ensure that the sample size was sufficiently large for analyses to be broken down by race/ethnicity and socioeconomic status) and ancestry (i.e., Mexican, Cuban, Central/South American, Puerto Rican and other Hispanic) and foreign-born status (i.e., US-born/Foreign-born) for HA.
Information on current smoking (yes/no) and alcohol consumption (no/less than once a week/once a week or more frequently) was available at each wave, both of which previous research has linked with obesity [21–23]. Information on marijuana and other illicit drug use [23, 24] was obtained at each wave by asking participants whether they used drugs during the past 30 days. Other drugs included cocaine, inhalants, other (Lysergic acid diethylamide (LSD), phencyclidine (PCP), ecstasy, mushrooms, speed, ice, heroin, or pills) and illegal drug injection (Wave II); cocaine, crystal meth, other (LSD, PCP, ecstasy, mushrooms, inhalants, ice, heroin, prescription medicines not prescribed for the participants) and illegal drug injection (Wave III), and illegal drug injection and participant’s favorite drugs (MDMA/Ecstasy, Inhalants, LSD, Heroin, PCP, other illegal drugs) (Wave IV).
The weekly frequency (bouts) of leisure-time moderate-to-vigorous physical activity (MVPA) and weekly screen time (i.e., time spent watching TV, playing video games and being in front of a computer) were assessed. MVPA was categorized as either high (≥ 5 bouts) or low (< 5 bouts) following the recommendation of the Centers for Disease Control and Prevention and the American College of Sports Medicine [25] while screen time was split into high (14 ≥ hours) and low (< 14 hours) based on the American Academy of Pediatrics recommendation [26].
In addition, the models were adjusted for depressive symptoms and overeating with loss of control in the past seven days. Depressive symptoms were defined by asking participants how often the statement ‘You felt (were) depressed’ was true during the past seven days. Response options include: 0 = never or rarely; 1 = sometimes; 2 = a lot of the time; 3 = most of the time or all of the time; those who answered either ‘a lot of the time’ or ‘most of the time or all of the time’ were categorized as depressed. As for overeating, respondents were presented with 2 items, i.e., “In the past seven days, have you eaten so much in a short period that you would have been embarrassed if others had seen you do it?” and “In the past seven days, have you been afraid to start eating because you thought you wouldn’t be able to stop or control your eating” with at least one affirmative answer being categorized as a positive screen. Information on overeating is only available at Wave III.
Statistical analysis
After checking the three-way interaction among ADHD symptom subtypes, sex and race/ethnicity in addition to age interaction terms with them (Table S2), a sex and race/ethnicity-stratified multilevel linear regression model was used to investigate the association between ADHD symptom subtypes and log-transformed BMI. We incorporated interaction terms between ADHD symptom subtypes and age (as a cubic polynomial) in the analysis to account for different trends across time by ADHD symptom subtypes. In addition, we accounted for multiple measurements from each participant (Level 1), multiple participants in each school (Level 2) by incorporating random intercepts at these levels and a random slope at individual measurement. We also jointly tested the age-ADHD subtype interaction effects, assuming a null hypothesis that interaction terms in relation to age (i.e., age, age-squared and age-cubic terms) and ADHD subtypes were simultaneously equal to zero.
To interpret our model-based findings, we predicted BMI values at given combinations of ADHD symptom subtypes and ages (i.e., age ranges between 16 and 30, the age of 80% of our sample over time, at an interval of 1 year) while holding covariates at their mean values, which were then converted to non-log transformed values. To test the robustness of our study findings, we also conducted a set of analyses confining to those who participated in all the three waves.
The statistical analysis was conducted using Stata version 14.0 (Stata Corp, College Station, TX). Statistical significance was set at p < 0.05 for main effects and p < 0.10 for interaction effects (two-tailed).
Results
The basic characteristics of the study participants are presented in Table 1. At wave II, BMI was 22.8, 24.3, and 23.6 for EA, AA and HA, respectively and it increased to be 28.5, 30.9 and 29.7 at wave IV. The prevalence of ADHD was approximately 10% in EA, and 6 – 7% in AA and HA. Among EA and AA, the most prevalent symptom subtype was ADHD-HI while ADHD-I was most prevalent among HA.
Table 1.
Weighted basic characteristics of the study participants in the Add Health survey waves II – IV, stratified by race/ethnicity
| European American (EA) |
African American (AA) |
Hispanic American (HA) |
|||||||
|---|---|---|---|---|---|---|---|---|---|
| Wave II | Wave III | Wave IV | Wave II | Wave III | Wave IV | Wave II | Wave III | Wave IV | |
| Age, mean [SD] | 16.3 [0.1] | 22.1 [0.1] | 28.6 [0.1] | 16.6 [0.2] | 22.4 [0.2] | 28.9 [0.2] | 16.5 [0.2] | 22.4 [0.2] | 28.8 [0.2] |
| Sex (female), % | 51.4 | 51.0 | 52.3 | 53.7 | 53.7 | 56.7 | 49.2 | 49.1 | 49.7 |
| Household income, n (%) | |||||||||
| Low | 20.9 | 20.1 | 20.4 | 57.3 | 55.5 | 55.8 | 52.8 | 53.6 | 52.9 |
| Middle | 35.2 | 35.3 | 35.7 | 27.1 | 28.7 | 28.6 | 28.9 | 28.5 | 29.4 |
| High | 43.9 | 44.5 | 43.8 | 15.4 | 15.6 | 15.3 | 18.3 | 18.0 | 17.7 |
| Missing | 0.1 | 0.1 | 0.1 | 0.3 | 0.2 | 0.2 | 0.0 | 0.0 | 0.0 |
| High education sample | 11.7 | 13.5 | 13.7 | ||||||
| Country of origin, n (%) | |||||||||
| Mexico | 60.6 | 60.9 | 62.1 | ||||||
| Cuba | 11.7 | 11.2 | 10.5 | ||||||
| Central and South America | 06.1 | 06.3 | 06.3 | ||||||
| puerto Rico | 11.1 | 11.6 | 10.6 | ||||||
| Other Hispanic | 10.5 | 09.9 | 10.6 | ||||||
| Foreign born status, n (%) | 21.3 | 22.8 | 20.4 | ||||||
| Smoking | |||||||||
| No smoking | 59.9 | 58.7 | 61.3 | 81.6 | 78.1 | 72.5 | 68.8 | 75.3 | 76.0 |
| Smoking | 39.5 | 41.1 | 38.6 | 18.0 | 21.4 | 26.5 | 30.3 | 24.2 | 23.7 |
| Missing | 0.6 | 0.3 | 0.1 | 0.4 | 0.4 | 1.0 | 0.9 | 0.6 | 0.3 |
| Alcohol consumption | |||||||||
| Don’t drink | 51.2 | 19.3 | 21.6 | 66.9 | 44.2 | 41.4 | 50.5 | 29.2 | 30.7 |
| Less than once a week | 36.7 | 44.4 | 43.6 | 23.0 | 37.4 | 36.6 | 36.7 | 47.3 | 42.8 |
| Once a week or more | 11.7 | 35.0 | 34.4 | 08.8 | 17.0 | 20.6 | 11.8 | 21.7 | 26.3 |
| Missing | 0.5 | 1.3 | 0.4 | 1.3 | 1.4 | 1.4 | 1.0 | 1.8 | 0.1 |
| Marijuana use | 17.1 | 25.4 | 18.4 | 15.6 | 20.2 | 15.7 | 19.2 | 18.4 | 14.3 |
| Other drug use | 5.6 | 8.5 | 4.3 | 1.4 | 2.5 | 1.6 | 5.0 | 5.9 | 2.9 |
| Moderate-to-vigorous PA | 67.7 | 19.5 | 20.7 | 61.6 | 17.5 | 18 | 63.6 | 22.7 | 21.3 |
| Screen time (> 14 h) | 51.9 | 63.0 | 61.2 | 65.3 | 66.1 | 60.1 | 58.4 | 60.2 | 59 |
| Overeating | 6.8 | 6.8 | 6.7 | 7.8 | 7.1 | 7.5 | 8.1 | 8.4 | 8.5 |
| Depressive feelings, n (%) | 7.5 | 5.0 | 6.4 | 11.6 | 6.7 | 10.1 | 11.4 | 8.8 | 6.2 |
| ADHD subtype, n (%) | |||||||||
| Non-ADHD | 90.6 | 90.7 | 90.7 | 94.1 | 94.2 | 94.4 | 93.2 | 92.9 | 93.4 |
| ADHD-HI | 3.7 | 3.5 | 3.3 | 2.3 | 2.3 | 0.5 | 0.9 | 0.0 | 0.8 |
| ADHD-I | 2.9 | 2.8 | 2.9 | 2.0 | 2.1 | 1.7 | 3.1 | 3.1 | 3.3 |
| ADHD-C | 2.8 | 3.0 | 3.0 | 1.6 | 1.4 | 1.5 | 1.7 | 2.0 | 1.5 |
| Body mass index, mean [SD] | 22.8 [0.2] | 26.0 [0.1] | 28.5 [0.2] | 24.3 [0.2] | 27.4 [0.2] | 30.9 [0.3] | 23.6 [0.2] | 27.0 [0.2] | 29.7 [0.3] |
| Non-ADHD, mean [SD] | 22.7 [0.2] | 25.9 [0.1] | 28.4 [0.2] | 24.3 [0.2] | 27.4 [0.2] | 30.8 [0.3] | 23.4 [0.2] | 26.8 [0.2] | 29.6 [0.3] |
| ADHD-HI, mean [SD] | 23.1 [0.4] | 26.4 [0.5] | 29.5 [0.8] | 23.4 [0.8] | 27.1 [0.9] | 31.5 [1.0] | 25.0 [1.5] | 28.0 [1.2] | 32.8 [1.5] |
| ADHD-I, mean [SD] | 23.8 [0.5] | 26.9 [0.5] | 30.1 [0.7] | 25.8 [1.5] | 28.5 [1.5] | 29.7 [1.9] | 25.6 [1.0] | 27.3 [1.2] | 30.9 [1.4] |
| ADHD-C, mean [SD] | 23.1 [0.5] | 26.5 [0.6] | 29.1 [0.7] | 22.8 [0.7] | 26.6 [1.1] | 32.1 [1.8] | 26.9 [1.3] | 30.5 [1.9] | 30.4 [1.7] |
ADHD: attention-deficit/hyperactivity disorder; ADHD-HI: the ADHD predominantly hyperactive/impulsive subtype; ADHD-I: the ADHD predominantly inattentive subtype; ADHD-C: ADHD combined, a combination of ADHD-HI and ADHD-I symptoms; PA: physical activity
The results of a multilevel regression model investigating the association between ADHD subtypes and log-transformed BMI are presented in Table 2. Among EA males, there was a significant interaction between ADHD subtypes and age among EA males (p = 0.096); as illustrated in Figure 1, the BMI of EA males with ADHD-HI, which did not statistically differ from that of non-ADHD EA participants at younger ages, became significantly higher at older ages (e.g., by 1.24 at the age of 30). Among EA females, while there was no statistically significant interaction between age and ADHD symptom subtypes (p = 0.126), participants with ADHD-HI and ADHD-I symptom subtypes had higher BMI than non-ADHD participants across the age range examined in this study.
Table 2.
Results of a sex and race/ethnicity-stratified multilevel regression model investigating the association between ADHD subtypes and log-transformed BMI in Add Health survey participants.
| European American (EA) |
African American (AA) |
Hispanic American (HA) |
||||
|---|---|---|---|---|---|---|
| Male |
Female |
Male |
Female |
Male |
Female |
|
| coef. (95%CI) | coef. (95%CI) | coef. (95%CI) | coef. (95%CI) | coef. (95%CI) | coef. (95%CI) | |
| Age (in 10 years) | 0.292*** (0.263, 0.320) |
0.258*** (0.234, 0.282) |
0.239*** (0.199, 0.280) |
0.260*** (0.219, 0.302) |
0.290*** (0.240, 0.339) |
0.284*** (0.248, 0.320) |
| Age2 | −0.140*** (−0.186, −0.094) |
−0.089*** (−0.131, −0.047) |
−0.068* (−0.136, −0.001) |
−0.037 (−0.106, 0.033) |
−0.080* (−0.149, −0.011) |
−0.124** (−0.204, −0.045) |
| Age3 | 0.034** (0.014, 0.055) |
0.011 (−0.009, 0.031) |
0.006 (−0.024, 0.037) |
−0.009 (−0.044, 0.025) |
0.007 (−0.023, 0.036) |
0.032 (−0.012, 0.076) |
| ADHD (ref. Non-ADHD) | ||||||
| ADHD-HI | 0.006 (−0.018, 0.031) |
0.069** (0.026, 0.113) |
−0.020 (−0.080, 0.041) |
−0.047 (−0.109, 0.015) |
0.012 (−0.074, 0.099) |
−0.002 (−0.067, 0.064) |
| ADHD-I | 0.004 (−0.028, 0.037) |
0.065* (0.013, 0.117) |
0.054 (−0.015, 0.123) |
−0.020 (−0.119, 0.080) |
0.033 (−0.019, 0.086) |
0.083 (−0.021, 0.187) |
| ADHD-C | 0.032 (−0.009, 0.074) |
0.040* (0.002, 0.078) |
0.014 (−0.057, 0.085) |
−0.044 (−0.128, 0.040) |
0.039 (−0.092, 0.170) |
0.110* (0.017, 0.203) |
| ADHD × Age | ||||||
| ADHD-HI | −0.012 (−0.100, 0.076) |
0.001 (−0.115, 0.118) |
0.081 (−0.050, 0.211) |
0.151 (−0.048, 0.351) |
0.091 (−0.241, 0.423) |
−0.010 (−0.347, 0.326) |
| ADHD-I | 0.009 (−0.098, 0.116) |
−0.196* (−0.345, −0.048) |
0.005 (−0.160, 0.169) |
0.482*** (0.253, 0.711) |
0.110 (−0.152, 0.373) |
−0.166 (−0.423, 0.091) |
| ADHD-C | −0.008 (−0.097, 0.081) |
0.044 (−0.092, 0.180) |
−0.015 (−0.279, 0.248) |
0.136 (−0.096, 0.367) |
0.004 (−0.593, 0.602) |
0.327** (0.128, 0.525) |
| ADHD × Age2 | ||||||
| ADHD-HI | 0.066 (−0.088, 0.219) |
−0.014 (−0.255, 0.228) |
−0.096 (−0.318, 0.127) |
−0.295 (−0.778, 0.188) |
−0.080 (−0.605, 0.445) |
0.046 (−0.528, 0.621) |
| ADHD-I | 0.015 (−0.158, 0.188) |
0.372* (0.084, 0.660) |
−0.041 (−0.368, 0.286) |
−0.779*** (−1.210, −0.347) |
−0.227 (−0.643, 0.190) |
0.312 (−0.125, 0.750) |
| ADHD-C | 0.005 (−0.140, 0.150) |
−0.138 (−0.358, 0.082) |
0.094 (−0.417, 0.606) |
−0.238 (−0.662, 0.187) |
−0.016 (−1.008, 0.976) |
−0.659** (−1.095, −0.224) |
| ADHD × Age3 | ||||||
| ADHD-HI | −0.026 (−0.096, 0.045) |
0.019 (−0.104, 0.143) |
0.030 (−0.071, 0.131) |
0.143 (−0.123, 0.409) |
0.008 (−0.221, 0.237) |
−0.036 (−0.290, 0.217) |
| ADHD-I | −0.007 (−0.083, 0.069) |
−0.165* (−0.305, −0.025) |
0.001 (−0.169, 0.170) |
0.318** (0.108, 0.528) |
0.110 (−0.072, 0.292) |
−0.149 (−0.356, 0.057) |
| ADHD-C | −0.001 (−0.070, 0.068) |
0.076 (−0.025, 0.176) |
−0.031 (−0.319, 0.257) |
0.113 (−0.083, 0.309) |
−0.005 (−0.477, 0.468) |
0.279* (0.065, 0.494) |
| Chunk tests | ||||||
| Interaction effects | p = 0.096 | p = 0.126 | p = 0.292 | p = 0.131 | p = 0.832 | p = 0.040 |
ADHD: attention-deficit/hyperactivity disorder; ADHD-HI: the ADHD predominantly hyperactive/impulsive subtype; ADHD-I: the ADHD predominantly inattentive subtype; ADHD-C: ADHD combined, a combination of ADHD-HI and ADHD-I symptoms; PA: physical activity.
Models were adjusted for parental household income (low/middle/high), study region, smoking status, alcohol consumption, marijuana use, other drug use, moderate-to-vigorous physical activity, screen time, overeating and depressive feelings, high education sample for AA, and ancestry and foreign-born status for HA.
p < 0.01;
p < 0.01;
p < 0.05;
p < 0.10
Figure 1.
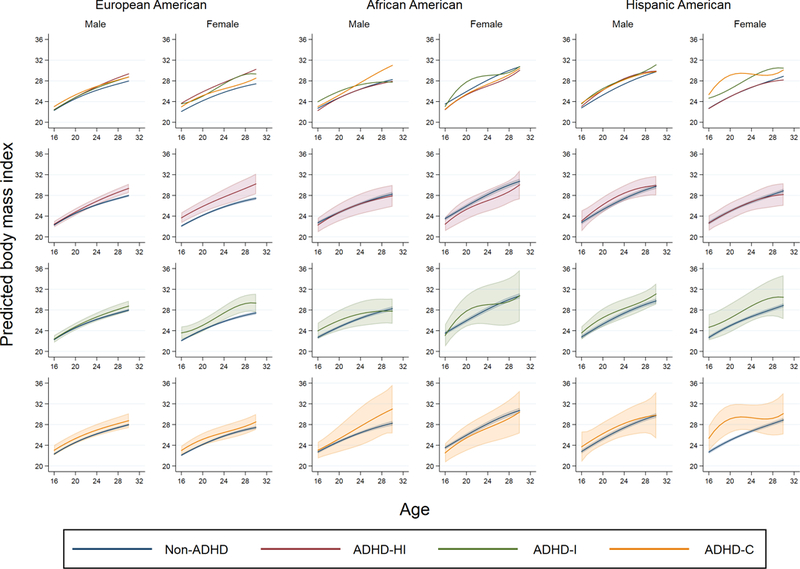
Predicted BMI values by ADHD subtypes, stratified by sex and race/ethnicity among participants in the National Longitudinal Survey of Adolescence to Adult Health (waves II to IV). The first row shows predicted BMI values by ADHD subtypes and non-ADHD while the second, third and fourth rows show predicted BMI values with 95% confidence interval, comparing between ADHD-HI and non-ADHD (the second row), ADHD-I and non-ADHD (the third row) and ADHD-C and non-ADHD (the fourth row), respectively. ADHD: attention-deficit/hyperactivity disorder; ADHD-HI: Hyperactive type; ADHD-I: Inattentive type; ADHD-C: ADHD combined (i.e., a combination of ADHD-HI and ADHD-I symptoms). Models were adjusted for age, age-squared and age-cubed terms, parental household income (low/middle/high), study region, high education sample for AA, and ancestry and foreign-born status for HA.
For AA males, AA females and HA males, we did not find an evidence of interaction between age and ADHD symptom subtypes. Neither did we find evidence of a statistical difference in BMI between non-ADHD and any of the ADHD subtype across the age range examined in this study. As for HA females, there was a statistically significant interaction between age terms and ADHD symptoms subtypes (p =0.040). At younger ages, HA females with ADHD-C had a significantly higher BMI than non-ADHD participants but this difference disappeared at older ages.
A set of analyses in which we confined to those who participated in all the three waves revealed that the associations observed in the main analyses among EA males and females in relation to ADHD-HI, the association in relation to ADHD-I among EA females did not substantially change (Figure S1). We did not find an evidence of the association in relation to ADHD-C among HA females.
Discussion
Using a nationally representative, racially/ethnically diverse U.S. sample, our study revealed that the association between ADHD symptom subtype and BMI across the transition period from adolescence to adulthood varied by demographic subgroup. More specifically, the hyperactivity (ADHD-HI) symptom subtype was associated with higher BMI relative to non-ADHD in EA (across the age range examined in our study in females and at the older ages in males) but it was not associated with BMI relative to non-ADHD among AA and HA participants. BMI values were higher in the inattention (ADHD-I) symptom subtype relative to non-ADHD in EA females across all waves, which was not observed in the other groups (i.e., EA male, AA males and females, and HA males and females). The combined symptom subtype (ADHD-C) was associated with a higher BMI relative to non-ADHD in HA females at adolescence to earlier adulthood, while this association was attenuated when the analysis was confined to those who participated in all the three waves.
The positive associations between the childhood ADHD symptom subtypes and BMI observed in this study are in line with previous studies which showed higher prevalence of obesity among individuals with ADHD without distinction of ADHD subtypes [8–10]. In addition, our study findings are also in line with several studies that investigated the association between childhood ADHD and adolescent/adulthood BMI. For example, Cortese et al. [27] reported in the U.S. that white boys with ADHD (mean age: 8.3 years old) had higher BMI at the age of 41 relative to the control. Khalife et al. [17] reported among participants in Finland that ADHD at the age of 8 was associated with obesity at the age of 16. These study findings, as well as our findings, suggest that the association between ADHD symptom and BMI persists into adolescent and adulthood even after adjusting for covariates potentially associated with BMI (i.e., smoking, alcohol consumption, drug use, screen time, overeating with loss of control and depressive feeling).
Although it is still uncertain how each of the ADHD symptom subtypes (i.e., inattention, hyperactivity/impulsivity) are linked with body weight, Cortese et al. [13] suggested in their review that HI symptoms (i.e., impulsivity, in particular) and IA symptoms are linked with increased body weight through different mechanisms; impulsivity may be associated with deficient inhibitory control (i.e., poor control over one’s behavior) and delay aversion (e.g., tendency to consume readily available fast food, which are, at the same time, usually high in energy) while the association between IA symptoms and obesity might have resulted from difficulties in adhering to regular eating pattern and/or initiating activities (contributing to decreased energy expenditure).
We found sex and racial/ethnic differences in the association between the ADHD subtypes and higher BMI. The findings reported by Fuemmeler et al. in the Add Health study [14] that ADHD symptom (ADHD-HI, in particular) was associated with higher BMI was only replicated in EA in this study and such an association (between ADHD-HI and BMI) was not found in the other groups. This has an important public health implication as this finding suggests that risk of obesity associated with ADHD might not be present in some population subgroups. It is possible that effective treatment of ADHD-obesity comorbidity might be different in each subgroup. While our current dataset does not allow us to further elucidate sex and racial/ethnic differences, topics which future research should focus on include, but should not be limited to, (1) whether the association between ADHD subtypes and potential mediators (e.g., energy balance) differs by sex and race/ethnicity and (2) whether the associations between potential mediators and BMI differ by sex and race/ethnicity; these differences can result from genetic differences, socio-cultural differences and/or the combination of them. While very few previous studies have stratified by race/ethnicity instead of adjusting for race/ethnicity (e.g., Lee et al. [28] that used the Add Health data to investigate the association between ADHD symptoms and smoking trajectories by sex and race/ethnicity), such an approach seems to be important in order to avoid masking potentially important differences among population subgroups.
This study has several limitations that need to be addressed. First, we did not have detailed estimates of diet intake, which limits our capacity to investigate the association between diet intake and BMI in relation to ADHD. In addition, information on overeating with loss of control was only available at Wave III in this study. Second, information on ADHD symptom subtypes was not clinically determined and was obtained through a participant retrospective self-report at wave III, which might be subject to recall bias or sex or racial/ethnic differences in responding. In addition, since ADHD symptoms can change across the life course [29, 30], retrospectively reported ADHD symptomatology between ages 5 and 12 years old might not have accurately represented ADHD symptomatology during later stages of the life course. Third, it is possible that ADHD medications may have weight-gain related side effects, which we do not consider in this study. Lastly, information on health behaviors was self-reported which might have resulted in the underreporting of socially undesirable health-related behaviors [31].
In conclusion, this study showed that there were sex and race/ethnicity differences in the association between ADHD symptom subtypes and BMI in a nationally representative sample of US middle-high school students followed into adulthood. The ADHD predominantly-hyperactive/impulsive symptom subtype and the ADHD predominantly-inattention symptom subtype were associated with BMI in European Americans (particularly in female participants). Hispanic females with the ADHD combined symptom subtype had a higher BMI than non-ADHD at younger ages. These study results suggest heterogeneity in the association between ADHD subtypes and BMI across population subgroups in the U.S.
Supplementary Material
Acknowledgements:
This work was funded by National Institutes of Health grant R01HD057194. This research uses data from Add Health, a program project directed by Kathleen Mullan Harris and designed by J. Richard Udry, Peter S. Bearman, and Kathleen Mullan Harris at the University of North Carolina at Chapel Hill and funded by grant P01-HD31921 from the Eunice Kennedy Shriver National Institute of Child Health and Human Development, with cooperative funding from 23 other federal agencies and foundations. Special acknowledgment is due Ronald R. Rindfuss and Barbara Entwisle for assistance in the original design. Information on how to obtain the Add Health data files is available on the Add Health website (http://www.cpc.unc.edu/addhealth). No direct support was received from grant P01-HD31921 for this analysis. Y.I. is supported by the Nippon Foundation International Fellowship program (http://intl-fellow.jp/en/). We are grateful to the Carolina Population Center for general support P2C HD050924 and CPC NICHD-NRSA Population Research Training (the T32 Training grant from NIH): T32 HD007168.
Footnotes
Conflicts of interest:
None declared.
References
- 1.Asherson P, Buitelaar J, Faraone SV, Rohde LA. Adult attention-deficit hyperactivity disorder: key conceptual issues. Lancet Psychiatry 2016; 3: 568–578. [DOI] [PubMed] [Google Scholar]
- 2.Pastor PN, Reuben CA, Duran CR, Hawkins LD. Association between Diagnosed ADHD and Selected Characteristics among Children Aged 4–17 Years: United States, 2011–2013 NCHS Data Brief. Number 201. Centers for Disease Control and Prevention; 2015. [PubMed] [Google Scholar]
- 3.Kessler RC, Adler L, Barkley R, et al. The prevalence and correlates of adult ADHD in the United States: Results from the National Comorbidity Survey Replication. Am J Psychiat 2006; 163: 716–723. [DOI] [PMC free article] [PubMed] [Google Scholar]
- 4.Nigg JT. Attention-deficit/hyperactivity disorder and adverse health outcomes. Clin Psychol Rev 2013; 33: 215–228. [DOI] [PMC free article] [PubMed] [Google Scholar]
- 5.Stickley A, Koyanagi A, Takahashi H, Kamio Y. ADHD symptoms and pain among adults in England. Psychiat Res 2016; 246: 326–331. [DOI] [PubMed] [Google Scholar]
- 6.Stickley A, Koyanagi A, Takahashi H, Ruchkin V, Inoue Y, Kamio Y. Attention-deficit/hyperactivity disorder and physical multimorbidity: A population-based study. Eur Psychiat 2017. [DOI] [PubMed] [Google Scholar]
- 7.Cortese S, Moreira-Maia CR, Fleur D, Morcillo-Peñalver C, Rohde LA, Faraone SV. Association between ADHD and obesity: a systematic review and meta-analysis. Am J Psychiat 2015; 173: 34–43. [DOI] [PubMed] [Google Scholar]
- 8.Cortese S, Angriman M, Maffeis C, et al. Attention-Deficit/Hyperactivity Disorder (ADHD) and obesity: A systematic review of the literature. Crit Rev Food Sci 2008; 48: 524–537. [DOI] [PubMed] [Google Scholar]
- 9.Cortese S, Tessari L. Attention-Deficit/Hyperactivity Disorder (ADHD) and Obesity: Update 2016. Curr Psychiatry Rep 2017; 19. [DOI] [PMC free article] [PubMed] [Google Scholar]
- 10.Nigg JT, Johnstone JM, Musser ED, Long HG, Willoughby MT, Shannon J. Attention-deficit/hyperactivity disorder (ADHD) and being overweight/obesity: new data and meta-analysis. Clin Psychol Rev 2016; 43: 67–79. [DOI] [PMC free article] [PubMed] [Google Scholar]
- 11.Hanć T, Cortese SJN, Reviews B. Attention deficit/hyperactivity-disorder and obesity: A review and model of current hypotheses explaining their comorbidity. Neurosci Biobehav Rev 2018; 92: 16–28. [DOI] [PubMed] [Google Scholar]
- 12.Seymour KE, Reinblatt SP, Benson L, Carnell S. Overlapping neurobehavioral circuits in ADHD, obesity, and binge eating: evidence from neuroimaging research. CNS Spectr 2015; 20: 401–411. [DOI] [PMC free article] [PubMed] [Google Scholar]
- 13.Cortese S, Vincenzi B. Obesity and ADHD: clinical and neurobiological implications. Curr Top Behav Neurosci 2012; 9: 199–218. [DOI] [PubMed] [Google Scholar]
- 14.Fuemmeler BF, Ostbye T, Yang C, McClernon FJ, Kollins SH. Association between attention-deficit/hyperactivity disorder symptoms and obesity and hypertension in early adulthood: a population-based study. Int J Obesity 2011; 35: 852–862. [DOI] [PMC free article] [PubMed] [Google Scholar]
- 15.Ogden CL, Carroll MD, Kit BK, Flegal KM. Prevalence of childhood and adult obesity in the United States, 2011–2012. JAMA 2014; 311: 806–814. [DOI] [PMC free article] [PubMed] [Google Scholar]
- 16.Krueger PM, Coleman-Minahan K, Rooks RN. Race/ethnicity, nativity and trends in BMI among US adults. Obesity 2014; 22: 1739–1746. [DOI] [PMC free article] [PubMed] [Google Scholar]
- 17.Khalife N, Kantomaa M, Glover V, et al. Childhood attention-deficit/hyperactivity disorder symptoms are risk factors for obesity and physical inactivity in adolescence. J Am Acad Child Adolesc Psychiatry 2014; 53: 425–436. [DOI] [PubMed] [Google Scholar]
- 18.Saad JF, Griffiths KR, Kohn MR, Clarke S, Williams LM, Korgaonkar MS. Regional brain network organization distinguishes the combined and inattentive subtypes of Attention Deficit Hyperactivity Disorder. Neuroimage Clin 2017; 15:383–390. [DOI] [PMC free article] [PubMed] [Google Scholar]
- 19.Purper-Ouakil D, Ramoz N, Lepagnol-Bestel AM, Gorwood P, Simonneau M. Neurobiology of Attention Deficit/Hyperactivity Disorder. Pediatr Res 2011; 69: 69r-76r. [DOI] [PubMed] [Google Scholar]
- 20.Hussey JM, Nguyen QC, Whitsel EA, et al. The reliability of in-home measures of height and weight in large cohort studies: Evidence from add health. Demogr Res 2015; 32: 1081. [DOI] [PMC free article] [PubMed] [Google Scholar]
- 21.Chiolero A, Faeh D, Paccaud F, Cornuz J. Consequences of smoking for body weight, body fat distribution, and insulin resistance. Am J Clin Nutr 2008; 87: 801–809. [DOI] [PubMed] [Google Scholar]
- 22.Lourenco S, Oliveira A, Lopes C. The effect of current and lifetime alcohol consumption on overall and central obesity. Eur J Clin Nutr 2012; 66: 813. [DOI] [PubMed] [Google Scholar]
- 23.Barry D, Petry NM. Associations between body mass index and substance use disorders differ by gender: results from the National Epidemiologic Survey on Alcohol and Related Conditions. Addict Behav 2009; 34: 51–60. [DOI] [PMC free article] [PubMed] [Google Scholar]
- 24.Le Strat Y, Le Foll B. Obesity and cannabis use: results from 2 representative national surveys. Am J Epidemiol 2011; 174: 929–933. [DOI] [PubMed] [Google Scholar]
- 25.Pate RR, Pratt M, Blair SN, et al. Physical activity and public health: a recommendation from the Centers for Disease Control and Prevention and the American College of Sports Medicine. JAMA 1995; 273: 402–407. [DOI] [PubMed] [Google Scholar]
- 26.Bar-On ME, Broughton DD, Buttross S, et al. Children, adolescents, and television. Pediatrics 2001; 107: 423–426. [DOI] [PubMed] [Google Scholar]
- 27.Cortese S, Ramos Olazagasti MA, Klein RG, Castellanos FX, Proal E, Mannuzza S. Obesity in men with childhood ADHD: a 33-year controlled, prospective, follow-up study. Pediatrics. 2013; 131: e1731–1738. [DOI] [PMC free article] [PubMed] [Google Scholar]
- 28.Lee C-T, Clark TT, Kollins SH, McClernon FJ, Fuemmeler BF. Attention Deficit Hyperactivity Disorder symptoms and smoking trajectories: Race and gender differences. Drug Alcohol Depen 2015; 148: 180–187. [DOI] [PMC free article] [PubMed] [Google Scholar]
- 29.Larsson H, Dilshad R, Lichtenstein P, Barker ED. Developmental trajectories of DSM-IV symptoms of attention‐deficit/hyperactivity disorder: Genetic effects, family risk and associated psychopathology. J Child Psychol Psychiatry 2011; 52: 954–963. [DOI] [PubMed] [Google Scholar]
- 30.Pagoto SL, Curtin C, Lemon SC, et al. Association Between Adult Attention Deficit/Hyperactivity Disorder and Obesity in the US Population. Obesity 2009; 17: 539–544. [DOI] [PMC free article] [PubMed] [Google Scholar]
- 31.Klesges LM, Baranowski T, Beech B, et al. Social desirability bias in self-reported dietary, physical activity and weight concerns measures in 8-to 10-year-old African-American girls: results from the Girls Health Enrichment Multisite Studies (GEMS). Prev Med 2004; 38: 78–87. [DOI] [PubMed] [Google Scholar]
Associated Data
This section collects any data citations, data availability statements, or supplementary materials included in this article.