

Abstract
Synthetic phenolic antioxidants (SPAs) such as 2,6-di-tert-butyl-4-hydroxytoluene (butylated hydroxytoluene, BHT), are used in a wide variety of consumer products, including certain foodstuffs (e.g. fats and oils) and cosmetics. Although BHT is considered generally safe as a food preservative when used at approved concentrations, there is debate whether BHT exposure is linked to cancer, asthma, and behavioral issues in children. Little is known with regard to human exposure to SPAs and the methods to measure these chemicals in urine. In this study, six SPAs and the metabolites were analyzed in 145 urine samples collected from four Asian countries (China, India, Japan, and Saudi Arabia) and the United States. BHT was found in 88% of the urine samples at median and maximum concentrations of 1.26 and 15 ng/mL, respectively. BHT metabolites and butylated hydroxyanisole (BHA) were found in 39% to 89% of the urine samples at a concentration range of <LOQ-46 ng/mL. 3,5-Di-tert-butyl-4-hydroxybenzoic acid (BHT-COOH), the major metabolite of BHT, is suggested as a potential urinary biomarker of exposure to BHT. The estimated median daily intake (EDI) of BHT, calculated from urinary concentrations, in children and adults were 0.38–56.6 and 0.21–31.3 μg/kg bw/day, respectively. BHT levels were high in urine samples from Japan, India, and the United States.
Keywords: Synthetic phenolic antioxidant, BHT, Exposure, Biomonitoring, Biomarker, Urine
Graphical Abstract
1. Introduction
Synthetic phenolic antioxidants (SPAs), such as 2,6-di-tert-butyl-4-hydroxytoluene (butylated hydroxytoluene, BHT) and butylated hydroxyanisole (BHA), have been widely used as antioxidants in certain foodstuffs, cosmetics, and plastics since the late 1940s (Wang et al., 2016). As antioxidants, BHT and BHA maintain freshness or prevent spoilage of foods and other products that are incorporated with these compounds. BHT and BHA are generally recognized as safe by the U.S. Food and Drug Administration (USFDA, 1984) when the total content does not exceed 0.02% wet weight (w/w) of the total fat or oil content of the food. Although generally recognized as safe, the widespread occurrence and existence of multiple sources of human exposure are of concern (Nieva-Echevarria et al., 2014). It has been postulated that, owing to their antioxidant and effective radical scavenging properties, BHT and BHA could modify the effects of carcinogens that act by oxidizing biomolecules or producing reactive radicals (Chung, 1999). Studies on the modulating effects of BHT and BHA on known carcinogens have yielded mixed results, depending on the timing of exposure to these antioxidants (WHO, 1986). Toxic effects, including carcinogenicity and reproductive toxicity, of BHT have been reported in animal studies (Clapp et al., 1973; Grogan, 1986; Lindenschmidt et al., 1986; Olsen et al., 1986; Shlian and Goldstone, 1986; Inai et al., 1988; Takahashi, 1992; Rao et al., 2000; Al-Akid et al., 2001). Similarly, BHA was reported as a tumor promoter, estrogenic disruptor, and carcinogen (Grice et al., 1998; Kahl and Kappus, 1993). The metabolites of BHT have been shown to elicit cellular DNA damage, genotoxicity, and carcinogenicity in animal models (Oikawa et al., 1998). Some BHT metabolites, such as 3,5-di-tert-butyl-4-hydroxy-benzaldehyde (BHT-CHO) and 2,6- di-tert-butylcyclohexa-2,5-diene-1,4-dione (BHT-Q), were reported to be more toxic than BHT itself (Nagai et al., 1993). Timing and doses of exposure are some important factors that modulate toxicities of these chemicals (WHO, 1986), and the carcinogenic potentials of BHT and BHA are controversial and subject to debate (Hirose et al., 1981; Shirai et al., 1982; William et al., 1990; Bomhard et al., 1992; Iverson, 1995; Whysner et al., 1996; Williams et al., 1999; Botterweck et al., 2000).
Despite the widespread use of SPAs in various consumer products, including dietary products, very little is known about human exposure levels of these chemicals. Sources other than foodstuffs can contribute to BHT exposures, and, therefore, such sources should be taken into account in the assessment of cumulative risks of BHT to humans (Wang et al., 2016). SPAs are metabolized in the human body, and the biological half-lives of parent compounds of SPAs are on the order of several hours to a few days (Verhagen et al., 1989). Two studies have reported the occurrence of SPAs in human specimens (Liu and Mabury, 2018; Li et al., 2019). Prevalence of SPAs in human sera and fingernails has been documented (Liu and Mabury, 2018; Li et al., 2019). Nevertheless, it has been reported that BHT and BHA were excreted predominantly in urine (WHO, 1986). It is prudent to measure SPAs in urine to enable the estimation of total daily exposure doses. To our knowledge, no earlier studies have measured SPAs in urine. This is the first study to determine the occurrence and profiles of BHA, BHT, and four of its metabolites in urine samples collected from the general population in China, India, Japan, Saudi Arabia, and the United States, to delineate baseline exposure levels in Asian countries and the United States. The aims of this study were to describe the occurrence of SPAs in human urine, investigate the geographic distribution in concentrations and profiles of BHT, and estimate exposure doses of SPAs in humans.
2. Materials and Methods
2.1. Sample Collection
Urine samples were collected during the period of 2010–2012 from China (n = 53), India (n = 36), Japan (n = 24), Saudi Arabia (n = 9), and the United States (n = 23). These were spot urine samples collected in polypropylene (PP) tubes for the analysis of other environmental contaminants, as reported elsewhere (Asimakopoulos et al., 2013; Guo et al., 2011; Honda et al., 2018; Liao et al., 2012). The age of the donors from the five countries ranged from 2 to 87 years. Details with regard to sampling locations, age, sex, and collection years have been reported earlier (Table S1, supplementary information) (Asimakopoulos et al., 2013; Guo et al., 2011; Honda et al., 2018; Liao et al., 2012). All samples were stored in PP tubes at −20 °C until analysis. The New York State Department of Health Institutional Review Board approved the study for the analysis of environmental chemicals in urine.
2.2. Chemicals and Reagents
The target chemicals and their structures are shown in Table S2. BHT, BHT-d21, 2,6-di-tert- butyl-4-(hydroxyethyl)phenol (BHT-OH), BHT-Q, BHT-CHO, and 3,5-di-tert-butyl-4- hydroxybenzoic acid (BHT-COOH) were obtained from Sigma-Aldrich (St. Louis, MO, USA). Isotopically-labeled 13C12-methyl paraben (13C12MeP;- RING-13C12, 99%) was obtained from Cambridge Isotope Laboratories (Andover, MA, USA). HPLC-grade methanol was supplied by J.T. Baker (Phillipsburg, NJ, USA). Ultra-pure water (18.2Ω) was generated using a Milli-Q system (Millipore, Billerica, MA, USA). β-glucuronidase (from Helix pomatia, containing 145,700 U/mL β-glucuronidase and 887 U/mL sulfatase) was purchased from Sigma-Aldrich (St. Louis, MO, USA).
2.3. Sample Preparation
BHT and four of its metabolites as well as BHA were analyzed in urine samples (2 mL) after enzymatic deconjugation, followed by liquid-liquid extraction. Briefly, two mL of urine sample were transferred into a glass tube, spiked with BHT-d21 (40 ng) and 13C12-MeP (40 ng) as internal standards (IS), buffered with 300 μL of 1 M ammonium acetate that contained 22 U of β-glucuronidase (prepared by the spiking of 50 μL of β-glucuronidase into 100 mL of 1 M ammonium acetate solution) and incubated at 37 °C for 12 h. After deconjugation, target analytes were extracted with 4 mL of ethyl acetate twice. The mixture was shaken in an oscillator shaker for 60 min (Eberbach Corp., Ann Arbor, MI, USA) and then centrifuged at 2000 × g for 5 min (Eppendorf Centrifuge 5804, Hamburg, Germany). The combined extract was evaporated to 1 mL under nitrogen, 500 μL was taken for the analysis of BHT by gas chromatography-mass spectrometry (GC-MS), and the remaining 500 μL was solvent transferred to methanol for high performance liquid chromatography-tandem mass spectrometry (HPLC-MS/MS) analysis of the total (i.e., free plus conjugated) forms of the remaining analytes.
2.4. Instrumental Analysis
BHT was analyzed, using an Agilent 6890 GC (Agilent Technologies, Inc., Santa Clara, CA, USA) coupled to an Agilent 5975 MS (Agilent Technologies, Inc.) in the selected ion monitoring (SIM) mode. A fused-silica capillary column (DB-5; 15 m × 0.25 mm i.d. × 0.25 μm film thickness) was used for chromatographic separation. The GC oven temperature program was as follows: initial temperature of 70 °C held for 4 min, first ramp at 10 °C min−1 to 270 °C and second ramp at 25 °C min−1 to 290 °C (held for 10 min). Helium was used as the carrier gas at a flow of 1 mL min−1. Transfer line, MS quadrupole and MS source temperatures were maintained at 290, 150 and 280 °C, respectively. Detection of BHT was carried out by electron ionization (70 eV) in selected ion monitoring (SIM) mode at m/z 220, 205 and 177. Other five SPAs were determined, using an Agilent 1260 HPLC (Agilent Technologies, Inc.) interfaced with an Applied Biosystems QTRAP 4500 mass spectrometer (ESI-MS/MS; Applied Biosystems, Foster City, CA, USA). A Betasil® C18 column (100 × 2.1 mm, particle size 5 μm; Thermo Electron Corporation, Waltham, MA, USA) connected to a Javelin Betasil® C18 guard column (20 × 2.1 mm, particle size 5 μm) was used for chromatographic separation of the five compounds. The mobile phase comprised of Milli-Q water (A) and methanol (B), used at a flow rate of 0.2 mL/min with a gradient as follows: 0−1.5 min, 1% methanol; 1.5−3 min, 1−75% methanol; 3−5 min, 75–99% methanol; 5–14 min, 99% methanol; 14−16 min, 99−1% methanol, 16–23 min, 1% methanol. The sample injection volume was 10 μL. The negative ion multiple reaction monitoring (MRM) mode was used in the detection of target chemicals. Nitrogen was used as both a curtain and a collision gas. The MS/MS parameters were optimized by infusion of individual compounds into the MS through a flow injection system (Table S3). The MRM transitions of the target chemicals are listed in Table S4.
2.5. Quality Assurance and Quality Control (QA/QC)
With every set of 20 samples analyzed, a procedural blank, a pair of pre-extraction matrix spikes (standards fortified in samples prior to extraction), a pair of post-extraction matrix spikes (standards fortified in sample extracts after extraction), and duplicate samples were analyzed. Trace levels of BHT-OH (median: 0.01 ng/mL), BHT-CHO (median: 0.03 ng/mL) and BHT- COOH (0.02 ng/mL) were found in procedural blanks. For procedural blanks, 2 mL of water, instead of urine, were used and passed through the entire analytical procedure. A background subtraction was performed when reporting concentrations of these compounds in samples. The procedural blanks also were prepared in PP tubes to assess contamination that could arise from the use of such tubes for sample collection. Recoveries of SPAs in spiked urine matrices ranged from 97 ± 8.4% for BHT-COOH to 108 ± 7.1% for BHA (Table S3). Duplicate analysis of randomly selected samples (n = 3) yielded a coefficient of variation of <20% between results. Quantification of SPAs was performed by an isotope-dilution method, based on the response of BHT-d21 (for BHT) and 13C12-MeP (for BHT-Q, BHA, BHT-OH, BHT-CHO, and BHT-COOH). The limits of quantification (LOQs), calculated at a signal-to-noise ratio of 10, were 0.1 ng/mL for BHA, BHT-Q, BHT-CHO, BHT-COOH, and BHT-OH and 0.2 ng/mL for BHT (Table S3). A midpoint calibration standard (in methanol) was injected to check for instrumental drift in sensitivity after every 20 samples, and a pure solvent (methanol) was injected as a check for carry-over of target chemicals between samples. Instrumental calibration was verified by the injection of 10-point calibration standards at concentrations that ranged from 0.1 to 100 ng/mL for BHA, BHT-OH, BHT-Q, BHT-CHO, BHT-COOH, and BHT in methanol. The linear regression coefficient (using a 1/x weighing factor) of the calibration curve (r2) was >0.99 for each of the target analytes. In this study, the sum concentrations of six targeted SPAs and the sum of the four metabolites of BHT (BHT-OH, BHT-Q, BHT-CHO, and BHT-COOH) were referred to as Σ6SPAs and Σ4metabolites, respectively. Concentrations below the LOQ were assigned a value of zero for data analysis.
2.6. Data Analysis
Statistical analyses (correlation analysis, test for normality, and ANOVA) were performed with SPSS Version 16.0. Normality of the data was checked by a Shapiro-Wilk test. Differences between groups were compared, using a one-way ANOVA. Urinary concentrations of SPAs were not normally distributed, and therefore log-transformation was performed to meet the normality assumptions. A probability value of p ≤ 0.05 was set for statistical significance.
3. Results and Discussion
3.1. BHA, BHT, and BHT Metabolites in Urine
BHT was the most frequently detected SPA in urine samples (detection frequency [DF%]: 88.3%; Table 1) at concentrations that ranged from <LOQ to 15 ng/mL (mean: 1.7 ng/mL, median: 1.26 ng/mL). The highest median concentrations of Σ6SPAs were found in urine samples from India (7.95 ng/mL), Japan (6.47 ng/mL), and the United States (4.24 ng/mL). BHA was present in 39% of the urine samples analyzed at concentrations that ranged from <LOQ to 4.31 ng/mL. Although studies have reported the occurrence of BHT and BHA in certain foods, indoor dust, wastewater, and consumer products (Wang et al., 2016a,b; Wang and Kannan, 2017), to the best of our knowledge, this is the first study to report urinary concentrations of SPAs. BHT concentrations in urine samples from the five countries were significantly lower than those reported in fingernail samples at a concentration range of 309–11400 ng/g (mean: 4280, median: 3540 ng/g) (Li et al., 2019), but similar to those reported for sera samples from the United States (range: <LOQ-22.6, geometric mean [GM]: 3.37 ng/mL) (Liu and Mabury, 2018). Higher concentrations of BHT found in fingernails than in serum and urine suggests accumulation of BHT in keratinized tissues (log Kow = 5.10). A slow slow clearance from fingernails has also been suggested (Alves et al., 2016; Sukumar, 2005; Li et al., 2019).
Table 1.
Concentrations of synthetic phenolic antioxidants (SPAs) and their metabolites in human urine samples from five countries (unit: ng/mL).
| BHT-OH | BHT-Q | BHT-CHO | BHA | BHT-COOH | BHT | ∑4metabolites | ∑6SPAs | ||
|---|---|---|---|---|---|---|---|---|---|
| Japan n=24 |
Min | n.d. | n.d. | n.d. | n.d. | n.d. | n.d. | n.d. | 1.31 |
| Max | 0.25 | 1.54 | 2.15 | 0.66 | 24.4 | 4.29 | 25.5 | 28.6 | |
| DF% | 12.5 | 8.3 | 91.7 | 4.2 | 91.7 | 75.0 | 91.7 | 100.0 | |
| Mean | n.d. | n.d. | 0.94 | n.d. | 5.49 | 1.47 | 6.55 | 8.06 | |
| Median | n.d. | n.d. | 0.84 | n.d. | 3.86 | 1.40 | 4.70 | 6.47 | |
| India n=36 |
Min | n.d. | n.d. | n.d. | n.d. | n.d. | 0.03 | n.d. | n.d. |
| Max | 3.92 | 2.94 | 1.48 | 3.43 | 24.0 | 15.0 | 27.4 | 36.8 | |
| DF% | 73.5 | 75.8 | 5.7 | 34.3 | 94.3 | 91.4 | 68.6 | 88.6 | |
| Mean | 0.63 | 0.66 | n.d. | 0.35 | 5.15 | 3.82 | 5.05 | 9.22 | |
| Median | 0.49 | 0.59 | n.d. | n.d. | 2.24 | 2.14 | 2.94 | 7.95 | |
| China n=53 |
Min | n.d. | n.d. | n.d. | n.d. | n.d. | n.d. | n.d. | n.d. |
| Max | 1.31 | 1.85 | 2.51 | 4.31 | 4.98 | 8.42 | 8.17 | 8.15 | |
| DF% | 49.0 | 63.3 | 70.6 | 44.0 | 80.4 | 86.8 | 66.0 | 96.2 | |
| Mean | 0.18 | 0.45 | 0.66 | 0.33 | 0.56 | 1.48 | 1.69 | 3.55 | |
| Median | n.d. | 0.40 | 0.61 | n.d. | 0.26 | 1.26 | 1.82 | 3.73 | |
| Saudi Arabia n=9 |
Min | n.d. | n.d. | 0.05 | n.d. | 0.11 | 0.01 | 0.47 | 0.98 |
| Max | 1.39 | 1.43 | 1.21 | 0.29 | 5.64 | 1.21 | 5.79 | 6.09 | |
| DF% | 55.6 | 66.7 | 88.9 | 66.7 | 100.0 | 44.4 | 100.0 | 100.0 | |
| Mean | 0.26 | 0.30 | 0.39 | 0.14 | 1.46 | 0.40 | 2.42 | 2.95 | |
| Median | 0.11 | 0.16 | 0.29 | 0.15 | 0.44 | 0.20 | 1.98 | 2.67 | |
| the U.S. n=23 |
Min | n.d. | n.d. | n.d. | n.d. | n.d. | n.d. | n.d. | 1.21 |
| Max | 0.50 | 1.20 | 0.69 | 2.41 | 46.0 | 4.29 | 46.4 | 47.3 | |
| DF% | 39.1 | 82.6 | 73.9 | 59.1 | 95.7 | 95.8 | 95.8 | 100.0 | |
| Mean | n.d. | 0.39 | 0.24 | 0.47 | 7.44 | 1.33 | 7.77 | 9.53 | |
| Median | n.d. | 0.37 | 0.19 | 0.15 | 1.78 | 1.09 | 2.45 | 4.24 | |
| Total n=145 |
Min | n.d. | n.d. | n.d. | n.d. | n.d. | n.d. | n.d. | n.d. |
| Max | 3.92 | 2.94 | 2.51 | 4.31 | 46.0 | 15.0 | 46.4 | 47.3 | |
| DF% | 47.5 | 60.1 | 59.9 | 38.6 | 89.4 | 88.3 | 77.9 | 95.9 | |
| Mean | 0.23 | 0.38 | 0.56 | 0.26 | 4.02 | 1.70 | 4.70 | 6.66 | |
| Median | n.d. | 0.37 | 0.45 | 0.10 | 1.78 | 1.26 | 2.45 | 4.24 |
n.d.: not detected or below LOQ.
The metabolites of BHT, namely BHT-OH, BHT-Q, BHT-CHO, and BHT-COOH, were detected in 48%, 60%, 60%, and 89%, respectively, of the samples analyzed. BHT-COOH was found at the highest concentrations, with a median value of 1.78 ng/mL, followed by BHT-CHO (0.45 ng/mL), BHT-Q (0.37 ng/mL), and BHT-OH (n.d.). Overall, the concentrations of ∑4metabolites (median 2.45 ng/mL, mean 4.70 ng/mL) were higher than those of BHT (median 1.26 ng/mL, mean 1.70 ng/mL), suggesting that BHT is transformed quickly in the human body (Wang et al., 2016a,b). BHT-COOH (DF%: 80–100%) was the predominant compound found in urine samples from the five countries. Urinary BHT-COOH can be a suitable biomarker of BHT exposure due to its high detection frequency and high measurable concentrations. Further, background contamination of BHT-COOH in sample containers and the analytical procedure is minimal. Nevertheless, it should be noted that the correlation between BHT and BHT-COOH concentrations in urine was weak (Table S5). A significant correlation (p < 0.05) existed between BHT and its metabolites BHT-Q and BHT-OH (Table S5), although these two metabolites were found at low concentrations with low detection frequencies. The use of BHT-COOH as a biomarker of BHT exposure has an advantage in that it is a biological metabolite and unlikely to pose an issue of background contamination during collection and analysis of urine. The predominant metabolic pathway of BHT involves oxidation of the 4-methyl group yielding BHT- COOH, which is excreted as free and glucuronidated forms (WHO, 1986).
Oral exposure to BHT yielded BHT-COOH as the major metabolite in urine samples (Lanigan and Yamarik, 2002; WHO, 1986; Holder et al., 1970), and free and glucuronidated BHT-COOH were the major metabolites identified in adult human urine (Holder et al., 1970). Oxidative metabolism (Phase 1 reactions) mediated by microsomal monooxygenase system is the major route of BHT biotransformation, with oxidation as occurring in the tert-butyl group (Conning and Philips, 1986). Tissue accumulation is also suggested for BHT (Conning and Philips, 1986). Because the concentrations of BHT metabolites were similar to those of the parent compound, for the assessment of exposure doses, it is important to measure the concentrations of both parent compounds and metabolites. Overall, BHT-COOH is an important biomarker of BHT exposure, and inclusion of this metabolite in biomonitoring studies will enable better understanding of BHT exposure.
3.2. Daily Exposure Dose
The concentrations of BHT metabolites measured in urine were converted into an exposure dose of the parent compound, using a simple first-order pharmacokinetic model, based on the fraction of the dose excreted as the metabolite (BHT-COOH) in relation to the ingested amount of BHT. The measured median and maximum concentrations of BHT-COOH were applied to estimate median and high BHT exposure doses (Table 2). The European Food Safety Authority (EFSA) recommended an acceptable daily intake (ADI) of 0.25 mg/kg bw/d for BHT. This ADI value was based on hepatic enzyme induction in two independent two-generation studies in rats (Olsen et al., 1986; Price, 1994; EFSA, 2012). The body weight-normalized exposure doses of BHT were estimated based on an average body weight (BW) of 70 kg for adults and 15 kg for children (US EPA, 2011). Based on the urinary concentrations of BHT-COOH and a simple steady-state exposure model, as shown in Eq. 1, human exposure doses of BHT were estimated for the five countries studied.
| (Eq. 1) |
where EDI is the estimated total daily intake of BHT (μg/kg bw/day), C is the urinary BHT- COOH concentration (μg/L), V is the human daily excretion volume of urine (L/day), and p is the fraction of the dose excreted as BHT-COOH in relation to the ingested amount of BHT. For V, we used an average urine excretion volume of 0.66 and 1.7 L/d for children and adults, respectively (Remer et al., 2002; Perucca et al., 2007); for p, the values of 3% (model 1) and 0.3% (model 2) were used based on two human exposure studies (Daniel et al., 1968; Wiebe et al., 1978). Studies of the metabolism and excretion of BHT in humans showed that the percentage of the dose excreted as BHT-COOH was 3% (in MODEL 1) (Daniel et al., 1968) or 0.3% (in MODEL 2) (Wiebe et al., 1978). The EDIs of BHT for the five countries studied here were in the range of 0.38–613 μg/kg bw/day for children and 0.21–372 μg/kg bw/day for adults (Table 2). Using a p value of 3% (MODEL 1), the respective median EDI values of BHT (μg/kg bw/day) for Japan, India, China, Saudi Arabia, and the United States were 5.66, 3.29, 0.38, 0.65, and 2.61 for children and 3.12, 1.81, 0.21, 0.36, and 1.44 for adults. The highest respective EDI values of BHT (μg/kg bw/day) for Japan, India, China, Saudi Arabia, and the United States were 35.8, 35.2, 7.30, 8.27, and 67.5 for children and 19.8, 19.4, 4.03, 4.57, and 37.2 for adults. Using a p value of 0.3% (Model 2), the median EDI values of BHT for adults (2.07–31.3 μg/kg bw/day) and children (3.75–56.6 μg/kg bw/day) were below the ADI values recommended by the EFSA, whereas the highest EDI values for children in Japan (325 μg/kg bw/day), India (320 μg/kg bw/day), and the United States (613 μg/kg bw/day) were above the ADI values. The EDIs of BHT for populations in Japan (56.6 and 31.3 μg/kg bw/day for children and adults) were the highest among the five countries, possibly due to high exposure from dietary sources and/or cosmetics. Although there are uncertainties associated with these estimates, our preliminary results suggest the need for identifying sources of exposure to BHT in Japan, India, and the United States.
Table 2.
Estimated total daily exposure dose to BHT measured from urinary concentrations in five countries (μg/kgbw/day); compared with exposure doses from dietary and dust ingestion; median and high exposure scenarios were employed.
| Reference Dosea | unit | Japan | India | China | Saudi Arabia | the U.S. | |||||||
|---|---|---|---|---|---|---|---|---|---|---|---|---|---|
| Mediand | Highe | Median | High | Median | High | Median | High | Median | High | ||||
| MODEL 1 | Children | 250 μg/kg/day | μg/kg/day | 5.66 | 35.8 | 3.29 | 35.2 | 0.38 | 7.30 | 0.65 | 8.27 | 2.61 | 67.5 |
| MODEL 1 | Adults | 250 μg/kg/day | μg/kg/day | 3.12 | 19.8 | 1.81 | 19.4 | 0.21 | 4.03 | 0.36 | 4.57 | 1.44 | 37.2 |
| MODEL 2 | Children | 250 μg/kg/day | μg/kg/day | 56.6 | 325 | 32.9 | 320 | 3.75 | 66.4 | 6.48 | 75.2 | 26.1 | 613 |
| MODEL 2 | Adults | 250 μg/kg/day | μg/kg/day | 31.3 | 198 | 18.1 | 194 | 2.07 | 40.3 | 3.58 | 45.7 | 14.4 | 372 |
| Dustb | Children | ng/kg/day | 31.3 | 3.6 | 10.9 | 5.6 | 7.4 | ||||||
| Dustb | Adults | ng/kg/day | 13.9 | 1.6 | 4.9 | 2.5 | 2.6 | ||||||
| Dietaryc | Adults | μg/kg/day | 60 | 60 | 60 | 60 | 390 | ||||||
Reference doses of EFSA (EFSA, 2012)
Daily intake dose data at 95UCL (95% Upper Confidence Limits) were applied (Wang et al., 2016a)
A dietary intake value of 0.06 mg/kg/day of BHT was estimated based on the dietary intake estimates reported for several countries (0.02–0.1 mg/kg/day) (JECFA, 2000), except for the dietary intake value for population in the U.S. (390 μg/kg/day) (Nieva-Echevarria et al., 2015; JECFA, 2000).
Median exposure levels were estimated based on the median concentrations of BHT in the urine samples of targeted population.
High exposure levels were estimated based on the maximum concentrations of BHT in the urine samples of targeted population.
3.3. Sources of BHT Exposure
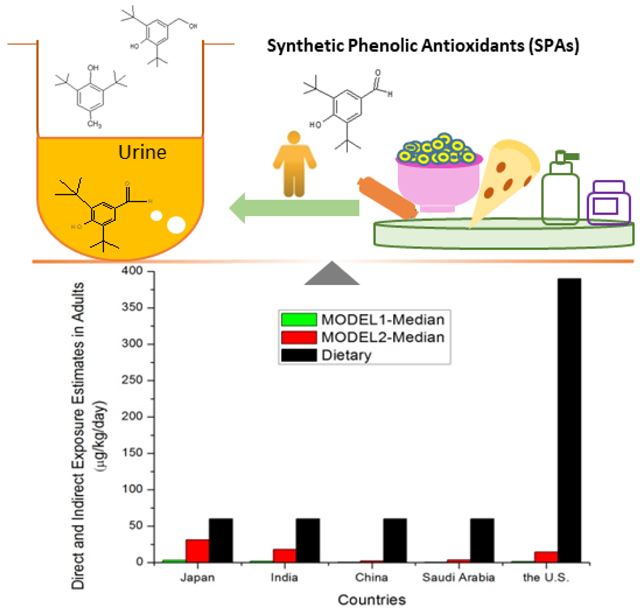
A few studies have reported that dietary intake and indoor dust ingestion are important sources of BHT exposure. The mean dietary intakes of BHT for the general population in South Korea and the United States were 40 and 390 μg/kg bw/day, respectively (Nieva-Echevarria et al., 2015; JECFA, 2000). A general dietary dose of BHT was calculated based on the intake estimates reported for several countries (0.02–0.1 mg/kg bw/day for Australia, Brazil, China, Finland, France, Japan, New Zealand, Spain, the United Kingdom, and the United States), and a value of 0.06 mg/kg bw/day was derived (JECFA, 2000). Wang et al. (2016a) reported that exposure dose of BHT through indoor dust ingestion was in the range of 0.4–222 ng/kg bw/day for populations in 12 countries. The total BHT exposure dose calculated from urinary concentrations was much higher (~103-104 times) than those calculated from indoor dust ingestion but comparable to the values estimated from dietary intake (Figure 1). For countries such as India and Japan, diet and dust accounted for only half of the total exposures, suggesting the existence of other sources of BHT. Dietary exposure, however, appears to be the predominant route of BHT exposure in China, Saudi Arabia, and the United States. The cumulative exposure doses calculated from dietary sources were higher than those estimated from urinary concentrations, which suggests potential accumulation of BHT in human tissues.
Figure 1.

Comparison of BHT exposure sources in five countries. Direct total exposure dose estimated from urinary concentrations were compared with diet (indirect) and dust (indirect) ingestion doses.
It should be noted that uncertainties exist in our calculations on exposure doses, as several pharmacokinetic models and assumptions were employed in these calculations. Further, the sample size from each country studied is limited, and, therefore, measured concentrations may not represent the population in the entire country. The spot urine samples analyzed in this study may not represent cumulative exposure over time due to temporal fluctuations in BHT exposures. Potential degradation of SPAs during prolonged storage of urine may underestimate the actual exposure levels. Significance of internal standard selection, β-glucuronidase and arylsulfatase activity in the analysis of total urinary concentrations of SPAs requires further validation. Nevertheless, our study presents novel and baseline information on a class of chemicals for which no exposure information existed.
4. Conclusions
This study demonstrates universal exposure to BHT by populations across several countries. Although diet is thought to be the main contributor to BHT exposure, other pathways, such as indoor air inhalation, dust ingestion, and dermal exposure from personal care products, cannot be ruled out. BHT-COOH was the major metabolite found in 80–100% of the urine samples. Elevated exposures to BHT were noted in countries such as Japan, India, and the United States. Estimated daily intake of BHT was in the range of 0.21–372 μg/kg bw/day for adults and 0.38–613 μg/kg bw/day for children, with some of the exposure doses exceeding the ADI.
Supplementary Material
Highlights.
Synthetic phenolic antioxidants were measured in human urine for the first time.
3,5-di-tert-butyl-4-hydroxybenzoic acid is a biomarker of BHT in urine.
The highest BHT exposure was found in samples from Japan, India and the U.S.
Besides diet, several other sources contribute to BHT exposure.
Acknowledgements
Research reported in this manuscript was supported in part by the National Institute of Environmental Health Sciences of the National Institutes of Health under Award Number U2CES026542–01. The content is solely the responsibility of the authors and does not necessarily represent the official views of the National Institutes of Health. Authors thank all volunteers for providing urine samples.
Footnotes
Publisher's Disclaimer: This is a PDF file of an unedited manuscript that has been accepted for publication. As a service to our customers we are providing this early version of the manuscript. The manuscript will undergo copyediting, typesetting, and review of the resulting proof before it is published in its final citable form. Please note that during the production process errors may be discovered which could affect the content, and all legal disclaimers that apply to the journal pertain.
Competing interests
All authors declare that they have no competing interests.
References
- Al-Akid YF, El-Rahman AEA, Hussein HA, Wassif GA, 2001. Nephro- and pneumotoxic response to chronic administration of butylated hydroxytoluene (BHT) in adult albino rats. Al-Azhar J. Pharm. Sci 28:171–95. [Google Scholar]
- Alves A, Koppen G, Vanermen G, Covaci A, Voorspoles S, 2016. Long-term exposure assessment to phthalates: how do nail analyses compare to commonly used measurements in urine. J. Chromatogr. B 1036–1037, 124–135. [DOI] [PubMed] [Google Scholar]
- Asimakopoulos AG, Wang L, Thomaidis NS, Kannan K, 2013. Benzotriazoles and benzothiazoles in human urine from several countries: a perspective on occurrence, biotransformation and human exposure. Environ. Int 59, 274–281. [DOI] [PubMed] [Google Scholar]
- Bomhard EM, Bremmer JN, Herbold BA, 1992. Review of the mutagenicity/genotoxicity of butylated hydroxytoluene. Mutat. Res 277, 187–200. DOI: 10.1016/0165-1110(92)90043-9. [DOI] [PubMed] [Google Scholar]
- Botterweck AA, Verhagen H, Goldbohm RA, Kleinjans J, van den Brandt PA, 2000. Intake of butylated hydroxyanisole and butylated hydroxytoluene and stomach cancer risk: results from analyses in the Netherlands Cohort Study. Food Chem. Toxicol 38(7), 599–605. [DOI] [PubMed] [Google Scholar]
- Chung JG, 1999. Effects of Butylated Hydroxyanisole (BHA) and Butylated Hydroxytoluene (BHT) on the Acetylation of 2-Aminofluorene and DNA-2-Aminofluorene Adducts in the Rat. Toxicological Sciences 51, 202–210. [DOI] [PubMed] [Google Scholar]
- Clapp NK, Tyndall RL, Cumming RB, 1973. Hyperplasia of hepatic bile ducts in mice following long-term administration of butylated hydroxytoluene. Food Cosmet. Toxicol 11, 847–9. DOI: 10.1016/0015-6264(73)90143-0. [DOI] [PubMed] [Google Scholar]
- Conning DM, Philips JC, 1986. Comparative metabolism of BHA, BHT and other phenolic antioxidants and its toxicological relevance. Food and Chemical Toxicology, Volume 24, Issues 10–11, October–November 1986, Pages 1145–1148. [DOI] [PubMed] [Google Scholar]
- Daniel JW, Gage JC, and Jones DI. 1968. The metabolism of 3,5-di-tertbutyl- 4-hydroxytoluen e in the rat and in man. Biochem. J 106:783–790. [DOI] [PMC free article] [PubMed] [Google Scholar]
- Dwivedi P, Zhou X, Powell TG, Calafat AM, Ye X, 2018. Impact of enzymatic hydrolysis on the quantification of total urinary concentrations of chemical biomarkers. Chemosphere 199, 256–262. [DOI] [PMC free article] [PubMed] [Google Scholar]
- EFSA-European Food Safety Authority. Panel on Food Additives and Nutrient Sources added to Food (ANS), 2012. Scientific opinion on the re-evaluation of butylated hydroxytoluene BHT (E 321) as a food additive. EFSA J. 10(3):2588, 1–43. DOI: 10.2903/j.efsa.2012.2588. [DOI] [Google Scholar]
- Grice HC, 1998. Safety evaluation of butylated hydroxyanisole from the perspective of effects on forestomach and esophageal squamous epithelium, Food Chem. Toxicol 26, 717–723. [DOI] [PubMed] [Google Scholar]
- Grogan MW, 1986. Toxicity from BHT ingestion. Western J. Med 145, 245–6. [PMC free article] [PubMed] [Google Scholar]
- Guo Y, Alomirah H, Cho HS, Minh TB, Mohd MA, Nakata H, Kannan K, 2011. Occurrence of phthalate metabolites in human urine from several Asian countries. Environ. Sci. Technol 45, 3138–3144. [DOI] [PubMed] [Google Scholar]
- Hirose M, Shibata M, Hagiwara A, Imaida K, Ito N, 1981. Chronic toxicity of butylated hydroxytoluene in Wistar rats. Food Cosmet. Toxicol 19, 147–51. DOI: 10.1016/0015-6264(81)90350-3. [DOI] [PubMed] [Google Scholar]
- Holder GM, Ryan AJ, Watson TR, and Wiebe LI. 1970. The metabolism of butylated hydroxytoluen e (3,5-di-t-butyl-hydroxytoluene) in man. J. Pharm. Pharmacol 22:375–376. [DOI] [PubMed] [Google Scholar]
- Honda M, Kannan K, 2018. Biomonitoring of chlorophenols in human urine from several Asian countries, Greece and the United States. Environ. Pollut 232, 487–493. [DOI] [PubMed] [Google Scholar]
- Inai K, Kobuke T, Nambu S, Takemoto T, Kou E, Nishina H, Fujihara M, Yonehara S, Suehiro S, Tsuya T, 1988. Hepatocellular tumorigenicity of butylated hydroxytoluene administered orally to B6C3F1 mice. Jpn. J. Cancer Res 79, 49–58. [DOI] [PMC free article] [PubMed] [Google Scholar]
- Iverson F, 1995. Phenolic antioxidants – health protection branch studies on butylated hydroxyanisole, Cancer Lett. 93, 49–54. [DOI] [PubMed] [Google Scholar]
- Kahl R, Kappus H, 1993. Toxicology of the synthetic antioxidants BHA and BHT in comparison with the natural antioxidant vitamin E. Z. Lebensm Unters Forsch. 196, 329–38. [DOI] [PubMed] [Google Scholar]
- Li C, Cui X, Chen Y, Liao C, Ma LQ, 2019. Synthetic phenolic antioxidants and their major metabolites in human fingernail. Environmental Research 169, 308–314. [DOI] [PubMed] [Google Scholar]
- Liao C, Liu F, Alomirah H, Loi VD, Mohd MA, Moon HB, Nakata H, Kannan K, 2012. Bisphenol S in urine from the United States and seven Asian countries: occurrence and human exposures. Environ. Sci. Technol 46, 6860–6866. [DOI] [PubMed] [Google Scholar]
- Lindenschmidt RC, Tryka AF, Goad ME, Witschi HP, 1986. The effects of dietary butylated hydroxytoluene on liver and colon tumor development in mice. Toxicology 38, 151–60. DOI: 10.1016/0300-483X(86)90116-2. [DOI] [PubMed] [Google Scholar]
- Liu R, Mabury SA, 2018. Synthetic Phenolic Antioxidants and Transformation Products in Human Sera from United States Donors. Environ. Sci. Technol. Lett 5 (7), 419–423. [Google Scholar]
- Nagai F, Ushiyama K, Kano I, 1993. DNA cleavage by metabolites of butylated hydroxytoluene. Arch. Toxicol 67(8), 552–7. DOI: 10.1007/BF01969268. [DOI] [PubMed] [Google Scholar]
- Nieva-Echevarria B, Manzanos MJ, Goicoechea E and Guillen MD, 2015. 2,6-Di-Tert-Butyl-Hydroxytoluene and Its Metabolites in Foods. Compr. Rev. Food Sci. Food Saf. 14, 67–80. [DOI] [PubMed] [Google Scholar]
- Oikawa S, Nishino K, Oikawa S, Inoue S, Mizutani T, Kawanishi S, 1998. Oxidative DNA damage and apoptosis induced by metabolites of butylated hydroxytoluene. Biochem. Pharmacol 56, 361–70. DOI: 10.1016/S0006-2952(98)00037-9. [DOI] [PubMed] [Google Scholar]
- Olsen P, Meyer O, Bille N, Würtzen G, 1986. Carcinogenicity study on butylated hydroxytoluene (BHT) in Wistar rats exposed in utero. Food Chem. Toxicol 24, 1–12. DOI: 10.1016/0278-6915(86)90256-5. [DOI] [PubMed] [Google Scholar]
- Perucca J, Bouby N, Valeix P, Bankri L, 2007. Sex difference in urine cncentration across differing age, sodium intake, and level of kidney disease. Am. J. Physiol. Regul. Integr. Comp. Physiol 292, R700–R705. [DOI] [PubMed] [Google Scholar]
- Price SC 1994. The role of hepatocellular injury in the chronic toxicity of BHT: two-generation Wistar albino rat study. Robens Inst., Univ. of Surrey, Guilford, Surrey, U.K: Study Nr: 1/91/Tx. Final Report Nr: R193/TOX/0020. Vol. 1–8. Submitted to WHO by Robens Inst. Unpublished. [Google Scholar]
- Rao GVS, Parthasarathy KR, Sundararaj A, 2000. Haemorrhagic syndrome in butylated hydroxy toluene (BHT) toxicity in broiler chicken. Indian Vet. J 77, 117–9. [Google Scholar]
- Rebecca SL, Yamarik TA, 2002. Final Report on the Safety Assessment of BHT. International Journal of Toxicology, 21(Suppl. 2):19–94, 2002 [DOI] [PubMed] [Google Scholar]
- Remer T, Meubert A, Maser-Gluth C, 2002. Anthropometrybased reference values for 24-h urinary creatinine excretion during growth and their use in endocrine and nutritional research. Am. J. Clin. Nutr 75, 561–569. [DOI] [PubMed] [Google Scholar]
- Shirai T, Hagiwara A, Kurata Y, Shibata M, Fukushima S, Ito N, 1982. Lack of carcinogenicity of butylated hydroxytoluene on long-term administration to B6C3F1 mice. Food Chem. Toxicol 20, 861–5. DOI: 10.1016/S0015-6264(82)80219-8. [DOI] [PubMed] [Google Scholar]
- Shlian DM, Goldstone J, 1986. More on BHT toxicity. Western J. Med 145 (5), 699. [PMC free article] [PubMed] [Google Scholar]
- Sukumar A, 2005. Human nails as a biomarker of element exposure. Rev. Environ. Contam. Toxicol 185, 141–177. [Google Scholar]
- Takahashi O, 1992. Haemorrhages due to defective blood coagulation do not occur in mice and guinea pigs fed butylated hydroxytoluene, but nephrotoxicity is found in mice. Food Chem. Toxicol 30, 89–97. DOI: 10.1016/0278-6915(92)90143-9. [DOI] [PubMed] [Google Scholar]
- U.S. Environmental Protection Agency, 2011. U.S. EPA Exposure Factors Handbook 2011 Edition (Final Report); EPA/600/R-09/052F; National Center for Environmental Assessments, Office of Research and Development (NCEA):Washington, DC, USA. [Google Scholar]
- US Food and Drug Administration, 1984. Food and drugs. US Codefed. Regul., Title 21, Part 182.3169, p. 380. [Google Scholar]
- Verhagen H, Beckers HH, Comuth PA, Maas LM, ten Hoor F, Henderson PT, Kleinjans LC, 1989. Disposition of single oral doses of butylated hydroxytoluene in man and rat. Food and Chemical Toxicology 27 (12), 765–772. [DOI] [PubMed] [Google Scholar]
- Wang W, Kannan K, 2017. Inventory, loading and discharge of synthetic phenolic antioxidants and their metabolites in wastewater treatment plants. Water Research 15 (129), 413–318. [DOI] [PubMed] [Google Scholar]
- Wang W, Abualnaja KO, Asimakopoulos AG, Covaci A, Gevao B, Johnson-Restrepo B, Kumosani TA, Malarvannan G, Minh TB, Moon HB, Nakata H, Sinha RK, Kannan K, 2016a. Synthetic phenolic antioxidants and their metabolites in indoor dust from homes and microenvironments. Environ. Sci. Tech 50, 428–434. [DOI] [PubMed] [Google Scholar]
- Wang W, Kannan P, Xue JC, Kannan K, 2016b. Synthetic phenolic antioxidants (SPAs) in resin based dental sealants. Environmental Research 151, 339–343. [DOI] [PubMed] [Google Scholar]
- WHO, 1983. Evaluation of Certain Food Additives and Food Contaminants (Tech. Rep. Ser. No. 696), Geneva, pp. 13–14. [Google Scholar]
- WHO, 1986. World Health Organization (WHO): International Agency For Research On Cancer. pp. 161–206. Archived (PDF) from the original on 2015-09-05.
- Whysner J, Williams GM, 1996. Butylated hydroxyanisole mechanistic data and risk assessment: conditional species-specific cytotoxicity, enhanced cell proliferation, and tumor promotion, Pharmacol. Ther 71, 137–151. [DOI] [PubMed] [Google Scholar]
- Wiebe LI, Mercer JR, Ryan AJ, 1978. Urinary metabolites of 3,5-di- (1-[13C]methyl-1-methylethyl)-4-hydroxytoluene (BHT-13C) in man. Drug Metab. Dispos 6:296–302. [PubMed] [Google Scholar]
- Williams GM, Iatropoulos MJ, Whysner J, 1999. Safety assessment of butylated hydroxyanisole and butylated hydroxytoluene as antioxidant food additives. Food Chem. Toxicol 37 (9–10), 1027–38. DOI: 10.1016/S0278-6915(99)00085-X. [DOI] [PubMed] [Google Scholar]
- Williams GM, Wang CX, Iatropoulos MJ, 1990. Toxicity studies of butylated hydroxyanisole and butylated hydroxytoluene. II. Chronic feeding studies. Food Chem. Toxicol 28, 799–806. DOI: 10.1016/0278-6915(90)90052-O. [DOI] [PubMed] [Google Scholar]
- Zhou X, Kramer JP, Calafat AM, Ye X, 2014. Automated on-line column-switching high performance liquid chromatography isotope dilution tandem mass spectrometry method for the quantification of bisphenol A, bisphenol F, bisphenol S, and 11 other phenols in urine. J Chromatogr B Anal Technol Biomed Life Sci. 944, 152–156. [DOI] [PubMed] [Google Scholar]
Associated Data
This section collects any data citations, data availability statements, or supplementary materials included in this article.