Abstract
Magic angle spinning (MAS) solid-state NMR (ssNMR) spectroscopy is a major technique for the characterization of the structural dynamics of biopolymers at atomic resolution. However, the intrinsic low sensitivity of this technique poses significant limitations to its routine application in structural biology. Here we achieve substantial savings in experimental time using a new subclass of Polarization Optimized Experiments (POEs) that concatenate TEDOR and SPECIFIC-CP transfers into a single pulse sequence. Specifically, we designed new 2D and 3D experiments (2D TEDOR-NCX, 3D TEDOR-NCOCX, and 3D TEDOR-NCACX) to obtain distance measurements and heteronuclear chemical shift correlations for resonance assignments using only one experiment. We successfully tested these experiments on N-Acetyl-Val-Leu dipeptide, microcrystalline U-13C,15N ubiquitin, and single- and multi-span membrane proteins reconstituted in lipid membranes. These pulse sequences can be implemented on any ssNMR spectrometer equipped with standard solid-state hardware using only one receiver. Since these new POEs speed up data acquisition considerably, we anticipate their broad application to fibrillar, microcrystalline, and membrane-bound proteins.
Keywords: Solid-state NMR, Magic Angle Spinning, Polarization Optimized Experiments, TEDOR, SPECIFIC-CP, NCA, NCO, DARR, Microcrystalline Proteins, Membrane Proteins, Sarcolipin, Succinate-Acetate permease Protein
INTRODUCTION
Magic angle spinning (MAS) solid-state NMR (ssNMR) spectroscopy plays a central role in the characterization of structures, motions, and interactions of biological macromolecules such as fibrillar, microcrystalline, and membrane proteins 1–6. Sensitivity and resolution, however, still limit its routine application to membrane proteins, where motion and sample heterogeneity complicate the interpretation of NMR spectra. In addition to this, the high lipid-to-protein ratios essential to maintain the functional integrity of membrane proteins also dilute the protein content of MAS samples and substantially increase the experimental time necessary to obtain high-quality spectra. As a result, NMR of membrane proteins requires longer acquisition times compared to fibrils or microcrystalline protein preparations.
To overcome these challenges and reduce experimental time, we developed Polarization Optimized Experiments (POEs), a class of pulse sequences that make the best out of nuclear polarization 7–10. POEs are ideal for MAS experiments on U-13C,15N labeled biomolecules at low-to-moderate spinning rates, which are often crucial to preserve enzymatic function 3. POEs enable the acquisition of multiple 2D and 3D NMR spectra simultaneously in a single experiment, resulting in a substantial saving of experimental time. A key element of POEs is the simultaneous cross-polarization (SIM-CP) scheme that matches Hartmann-Hahn conditions for 1H, 13C, and 15N contemporarily to generate an additional 15N polarization (Nz) that remains stored along the z-axis for several milliseconds due to its relatively long longitudinal relaxation time (T1) 7. Therefore, after the main experiment is recorded (first acquisition), the Nz polarization is utilized to generate one or more nD spectra within the same pulse program 8,10. Analogously, 13C polarization generated by SIM-CP can be stored along the z-axis (Cz) and utilized for multiple experiments as previously demonstrated 7,11. The FIDs originating from POEs are usually saved in different memory allocations and processed into separate spectra 7,9. The straightforward implementation on commercial NMR spectrometers equipped with only one receiver and probes for bio-solids (Low-E or E-free) made POEs appealing to the broader NMR community 12–14. In fact, other groups extended POE to 1H detected experiments to obtain a considerable gain in sensitivity and time efficiency 15–17.
Our original POEs were designed to record a 13C-13C homonuclear correlation spectrum as the main experiment, followed by single or multiple 13C-15N correlation spectra in subsequent acquisitions. Here, we expanded the POE toolkit 18 by hybridizing transferred echo double resonance (TEDOR) 19–22 and spectrally induced filtering in combination with cross-polarization (SPECIFIC-CP) 23 transfer elements to record 13C-15N correlation experiments in the first and subsequence multiple acquisitions. With these hybridized pulse sequences, we were able to combine distance measurements and heteronuclear chemical shift correlation experiments. We successfully performed these experiments on U-13C,15N microcrystalline ubiquitin as well as two U-13C,15N labeled membrane proteins: sarcolipin (SLN), a single-pass transmembrane protein 24, and succinate-acetate permease (SatP), with six transmembrane helices 25–27.
MATERIALS AND METHODS
The expression, purification, and microcrystalline preparation of recombinant U-13C,15N ubiquitin were carried out as reported by Igumenova et al. 28. Recombinant SLN was expressed in E. coli bacteria using minimal M9 media enriched with 13C glucose (Sigma) and 15N ammonium chloride (Sigma) as reported previously 29. Succinate-acetate permease (SatP) was expressed and purified from E. coli bacteria as a SUMO fusion protein. Briefly, E. coli SatP was cloned into a pE-SUMOpro-Amp (LifeSensors) vector and expressed in E. coli BL21(DE3) cells. Cells were grown to an optical density (OD) at 600 nm of 1.0 at 37 °C in M9 media with 50 mg/L ampicillin then induced with 1 mM isopropyl-D-thiogalactoside (IPTG). All purifications were carried out on ice. Cells from 2 L of culture were harvested and lysed by sonication in 50 mM Tris buffer (pH 7.4), 500 mM NaCl, and 0.5 mM phenylmethylsulforyl fluoride (PMSF). SatP was solubilized from whole lysed cells in 50 mM Tris buffer (pH 7.4), 500 mM NaCl, 10% glycerol, and 200 mM Octyl Glucoside (OG, Anatrace) or 10 mM Octyl Glucose Neopentyl Glycol (OGNG, Anatrace) for 2 h at 4 °C. After centrifugation at 60,000 x g, solubilized SatP protein in the supernatant was batch-bound to Ni-NTA resin (Qiagen) for 1 h, washed with 25 bed volumes of 50 mM Tris buffer (pH 7.4), 300 mM NaCl, 10% glycerol, 40 mM OG, and 40 mM imidazole, then eluted with 250 mM Tris buffer (pH 7.4), 300 mM NaCl, 10% glycerol, 40 mM OG, and 300 mM imidazole. Imidazole was removed using a BioRad Econo-Pac 10DG desalting column and the histidine-tagged SUMO was removed by digestion with histidine-tagged SUMO protease for 12 h at 4 °C. The protein sample was batch bound to Ni-NTA resin and the flow through containing SatP was concentrated and further purified on a GE Superdex 200 gel filtration column with a mobile phase of 50 mM Tris buffer (pH 7.4), 100 mM NaCl, 10% glycerol, and 40 mM OG.
For NMR experiments, approximately 0.6 mg of SLN or 8 mg SatP were reconstituted into 12 mg of 1,2-dimyristoyl-sn-glycero-3-phosphocholine (DMPC, Avanti Polar Lipids) at lipid-to-protein ratios of 100 and 40, respectively 3. All the experiments were implemented on Agilent and Bruker spectrometers operating at a 1H Larmor frequency of 600 MHz. Experiments on U-13C,15N SLN, U-13C,15N ubiquitin, and U-13C,15N NAVL dipeptide were acquired using a 3.2 mm scroll coil MAS probe with 25 μL sample volume. Spectra of U-13C,15N SatP were acquired using a 1.3 mm Bruker MAS probe with 4 μL sample volume. All data were acquired with a recycle delay of 3 s and MAS rate (νr) set to 12.5 kHz, which corresponds to an 80 μs rotor period (τr). The maximum RF amplitude on the 1H channel was set to 100 kHz, which corresponds to a 90° pulse of 2.5 μs; whereas the RF amplitude for the 13C and 15N channels was set to 41.6 kHz and corresponds to a 90° pulse of 6 μs. During the REDOR period 30,31, 180° pulses of 12 μs were applied on both 13C and 15N channels. The 180° pulses on the 15N channel were phase cycled using the XY-4 scheme 32. CP and SIM-CP contact times were set to 500 μs, during which the RF amplitudes of 13C and 15N were set to 35 kHz, and the 1H RF amplitude was ramped from 90 to 100%, with the center of the ramp set to 60 kHz. During TEDOR mixing, t1 evolution, and t2 acquisition periods, a SPINAL-64 1H decoupling sequence was used on the 1H channel with 100 kHz RF amplitude 33. The t2 acquisition times for 13C detection were set to 15 ms with 10 μs dwell time; whereas the 15N signal was evolved during t1 with 320 μs (equal to 4 × τr) dwell time for 32 increments, corresponding to a maximum t1 evolution time of 10.24 ms. For the U-13C,15N NAVL sample, 16 increments of t1 were acquired with a dwell time of 640 μs. The SPECIFIC-CP transfer between 15N and 13Cα or 13CO was achieved using a tangent-shaped ramp pulse on 13C and a constant amplitude pulse applied on 15N, with CW (continuous wave) decoupling applied on 1H nuclei using 100 kHz RF amplitude. The offset for 13C was set to 50 and 175 ppm for NCA and NCO transfer periods, respectively. The RF amplitudes of 13C were set to 18.75 kHz (1.5*νr) and 43.75 kHz (3.5*νr) for NCA and NCO transfers, respectively, whereas the 15N RF amplitude was arrayed around 31.25 kHz (2.5*νr) to obtain the maximum intensity of signals 34. All elements in the TEDOR sequence were synchronized with the rotor frequency νr = 1/τr. For 1D and 2D TEDOR experiments, the tmix was set to 1.28 ms (16×τr), which gave the maximum 13Cα signal. The 15N dwell time (t1) was set to 4 × τr (320 μs) during which a 1H decoupling with 100 kHz RF amplitude was applied. The two Δ periods (z-filters) were set to 240 μs (3×τr) with 1H RF set to 12.5 kHz to facilitate rapid dephasing of 13C transverse magnetization 19. Before and after t1 evolution, a pair of 90° pulses with a total length of 24 μs were applied. To avoid desynchronization, an additional τ delay after t1 evolution was set to 216 μs (3 × τr - 24 μs) 19,21. The pseudo-3D TEDOR-NCACX-NCOCX experiment was performed on U-13C,15N crystalline NAVL using 16 t1 increments and a dwell time of 640 μs. The parameters for the 3D TEDOR experiments were similar to the 2D TEDOR with the tmix period arrayed from 1.28 to 17.92 ms 19. The 2D spectra of U-13C,15N SLN, U-13C,15N SatP, and U-13C,15N ubiquitin were acquired with 512, 400, and 128 scans, respectively. The pseudo-3D TEDOR-NCACX-NCOCX experiment on U-13C,15N NAVL was acquired using 64 scans. A 1H RF amplitude of 12.5 kHz (νr) 35 was used for 13C,13C-DARR mixing periods.
RESULTS
Simultaneous acquisition of TEDOR and NCX experiments.
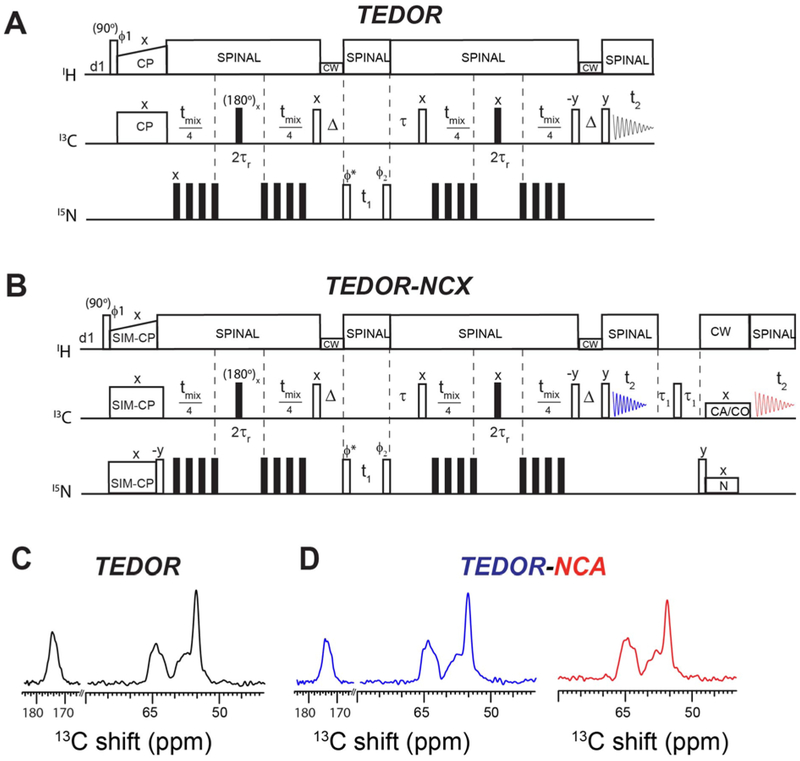
The original pulse sequence for the z-filtered (ZF) TEDOR experiment uses 1H-13C CP as a preparation period (Figure 1A) 19. In contrast, the new hybrid pulse sequence, TEDOR-NCX (Figure 1B), starts with the SIM-CP sequence that creates both 13C and 15N polarization from the 1H spin bath, which are utilized to record TEDOR and NCA (or NCO) experiments in the 1st and 2nd acquisition, respectively. The coherence transfer pathways for the hybrid TEDOR-NCX experiment can be described using the product operator formalism as follows:
| (1) |
Figure 1:
A. Pulse sequences for the conventional 2D Z-filtered TEDOR experiment. B. Hybrid pulse sequence (TEDOR-NCX) that combines TEDOR and NCA (or NCO) experiments. C. 1D spectrum of U-13C,15N SLN recorded using conventional TEDOR experiment (black). D. 1D TEDOR and NCA spectra of U-13C,15N SLN acquired simultaneously with the TEDOR-NCA pulse sequence (blue and red). The phase cycles were ϕ1=y, −y, y, −y. ϕ2=y, y, −y, −y, and ϕreceiver=y, −y, −y, y. XY-4 phase cycling scheme was applied for 15N π pulses during TEDOR mixing periods. States mode detection of t1 dimension was obtained by switching the ϕ* phase between y and −x.
The 13C and 15N chemical shifts are represented by ωC and ωN, whereas ω represents the effective 13C-15N dipolar coupling. After SIM-CP, the 15N polarization is stored along the z-axis (Nz) by applying a 90° pulse, whereas the 13C transverse polarization is evolved through REDOR mixing (tmix/2) to create an antiphase 13C single quantum coherence (2CyNz). Note that the 15N polarization remains along the z-axis after the 180° pulses are applied on the 15N channel during the REDOR mixing period. The coherence transfer from 13C to 15N (2CzNx) is obtained by a pair of 90° pulses applied on both 13C and 15N channels, with the latter flipping Nz into the transverse spin operator NX. Both in-phase and antiphase 15N single-quantum operators (Nx and 2CzNx) evolved simultaneously according to their chemical shifts during t1 and under 1H decoupling. The States quadrature detection in the t1 dimension is achieved by switching the phase ϕ∗ of the 15N pulse between y and -x prior to t1 evolution. After t1 evolution, a pair of 90° pulses is applied on 13C and 15N, which converts the antiphase operator 2CzNx into 2CyNz and the Nx operator into Nz. A τ period is used to compensate for rotor desynchronization caused by the duration of the 90° pulses. An identical REDOR mixing period (tmix/2) converts the antiphase spin operator 2CyNz into the in-phase Cx operator, which gives rise to the TEDOR signal detected during the 1st t2 acquisition period. Note that in equation 1, the spin coherences such as [Cx·cos(ω·tmix/2)], [2CyNz·sin (ω·tmix/2) ·cos(ω·tmix/2)], and other multiple quantum terms (not shown) created by homonuclear 13C-13C J-couplings are eliminated by 15N phase cycling (ϕ2) and Δ periods as shown in Figures 1A and 1B 19. The TEDOR mixing period tmix (equation 1, and Figure 1) can be adjusted to optimize the 15N-13C transfer. For example, one bond 15N-13C transfer requires up to 1.2 ms mixing period. After this first acquisition, a τ1-90°-τ1 sequence (τ1 = 3 ms) is applied on the 13C channel to remove any residual 13C magnetization 7. The Nz is then tilted into the transverse plane by a 90° pulse followed by a SPECIFIC-CP transfer from 15N to 13Cα or 15N to 13CO, which is detected in the second acquisition period (t2).
Figures 1C and 1D show 1D TEDOR and NCA spectra of U-13C,15N SLN obtained from TEDOR and the hybrid TEDOR-NCA pulse sequences. These spectra were obtained by setting the t1 evolution period to zero and using a mixing time (tmix) of 1.28 ms. The integrated intensities were normalized to the corresponding intensities of the TEDOR spectrum to determine possible signal losses. For the 13Cα region (50–70 ppm), we obtained integrated signal intensities of 1.00 and 0.99 using conventional TEDOR and TEDOR-NCA sequences, respectively, whereas the corresponding values for the 13CO region (165–180 ppm) were 1.00 and 0.94. The marginal loss of 13CO signal intensity detected for the TEDOR-NCA pulse sequence is due to the SIM-CP transfer implemented in the preparation period, which usually reduces the intensity of the 13CO signals by 5–10% 7,10. Figure 1D also shows the 1D NCA spectrum from the 2nd acquisition of the TEDOR-NCA experiment. In this case, the normalized integrated intensities of 13Cα region from TEDOR (1st acquisition) and NCA (2nd acquisition) were 1.00 and 0.95, respectively. Note that these two spectra can be added to increase the S/N ratio by 38%.
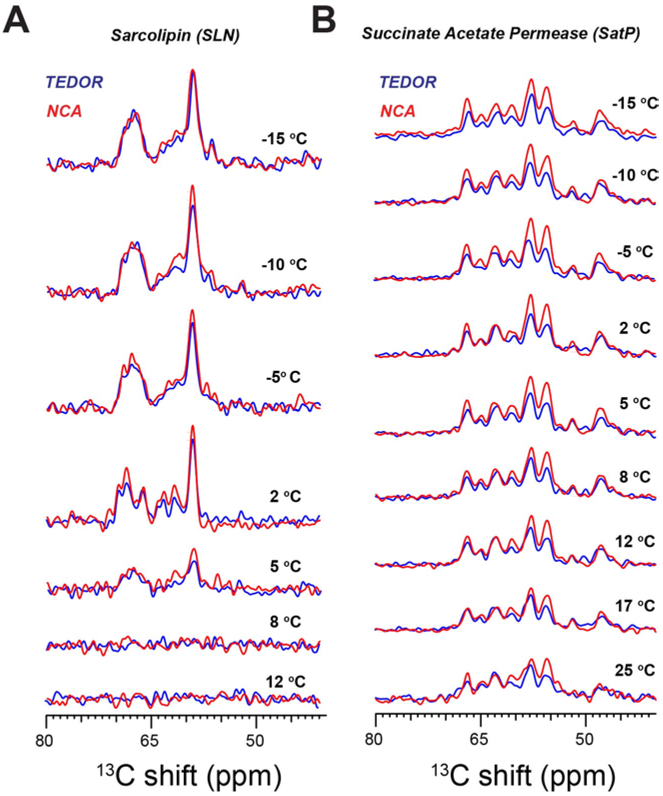
To understand the effects of temperature on 13C signal intensities, we acquired a series of 1D TEDOR and NCA spectra of U-13C,15N SLN and U-13C,15N SatP at temperatures above and below the phase transition of the DMPC lipid bilayer (Figure 2). For U-13C,15N SatP, the integrated intensities of 1D NCA spectra (red) are about 10–30% higher than the corresponding TEDOR spectra (blue). In contrast, the intensities of the TEDOR and NCA spectra performed on U-13C,15N SLN are virtually identical. The highest peak intensities and resolution for both proteins were obtained at 2°C, where DMPC is in the gel phase. The signal intensities for both samples gradually decrease upon reaching DMPC’s liquid crystalline phase (i.e., 20–30°C), with signal intensities of both TEDOR and NCA spectra following similar trends.
Figure 2:
Temperature dependence of the 13Cα signal intensities of 1D TEDOR and NCA spectra of A. single transmembrane protein U-13C,15N SLN, and B. six transmembrane U-13C,15N SatP. All spectra were acquired using TEDOR-NCA pulse sequence reported in Figure 1B.
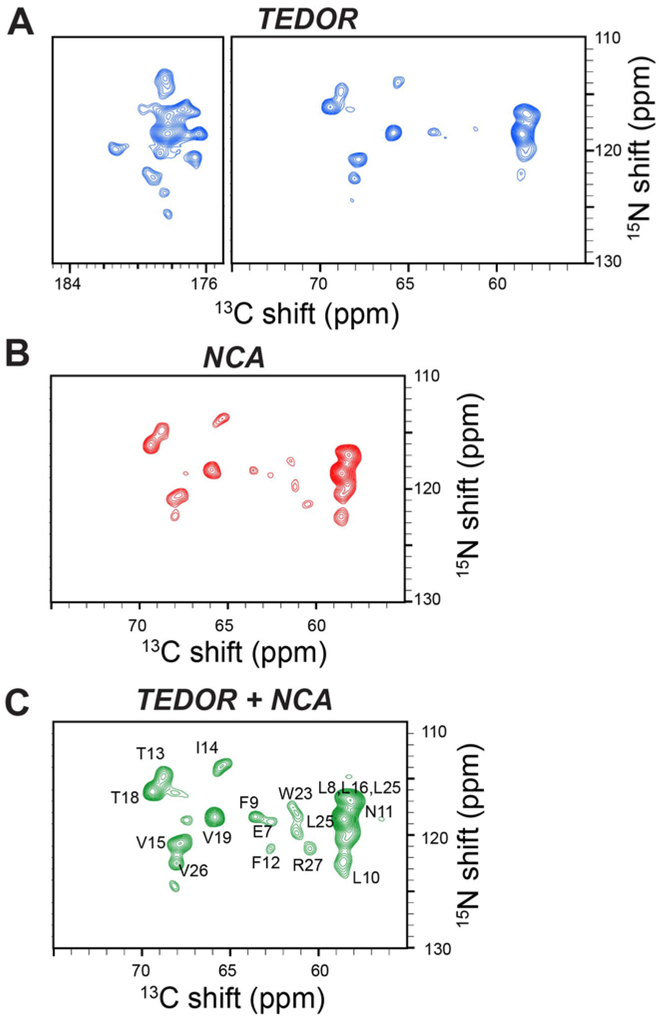
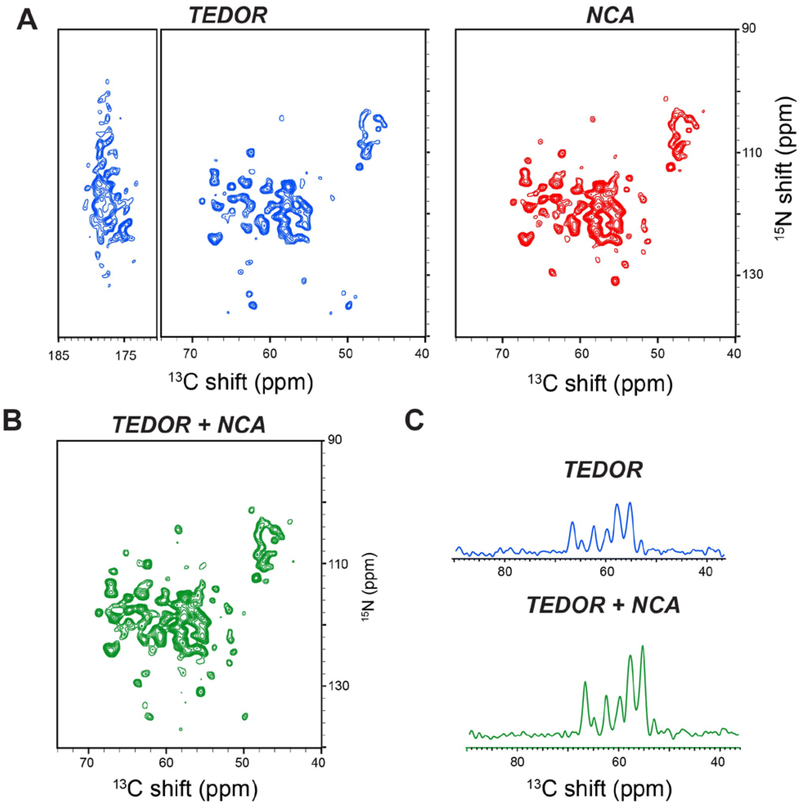
A comparison of the 2D TEDOR-NCA experiments on U-13C,15N SLN and U-13C,15N SatP are reported in Figures 3 and 4. Specifically, Figure 3A and 3B show 2D TEDOR-NCA spectra of U-13C,15N SLN. After summing the TEDOR and NCA data sets, we obtained an average net increase in signal intensity of 32% (Figure 3C). Note that the sum of the two spectra also increases the noise level by , therefore intensities were scaled down by a factor of 0.707 () when quantifying signal in the spectrum of Figure 3C. The peak positions of U-13C,15N SLN match our previous resonance assignments obtained with the 3D-DUMAS-NCACX-CANCO experiment 10,36. The total time for acquiring 2D TEDOR-NCA spectra was 27.8 hours and the additional 2nd acquisition increased the experimental time by only 16 minutes. In contrast, to record only a single spectrum with the conventional 2D TEDOR experiment would have taken 27.5 hours. We repeated the 2D TEDOR-NCA experiment for U-13C,15N SatP (Figure 4A). SatP is a significantly larger membrane protein, with six transmembrane domains arranged in ordered hexamers in the lipid membrane. The relative intensity of the 2D NCA for the 13C (40–70 ppm) and 15N (100–140 ppm) spectral regions is ~30% higher than the TEDOR spectrum. The sum of TEDOR and NCA spectra obtained has a signal intensity gain of 60% with respect to the TEDOR spectrum alone (Figure 4A). This intensity gain is apparent in Figure 4C, where 1D cross sections taken at 119 ppm of the 15N dimension are reported for TEDOR and TEDOR+NCA spectra.
Figure 3:
A. 2D TEDOR spectrum of SLN (blue); B. 2D NCA spectrum of SLN (red). Both A and B were acquired simultaneously using the TEDOR-NCA pulse sequence. C. Sum of the TEDOR and NCA spectra. The resonances in the spectrum have an average sensitivity enhancement of 32% for 13Cα region. All the spectra were plotted at same noise level.
Figure 4:
A. 2D TEDOR and NCA spectra of SatP acquired simultaneously using the TEDOR-NCA pulse sequence. B. Sum of the 2D TEDOR and NCA spectra showing an average sensitivity enhancement of 60% for 13Cα region with respect to the conventional TEDOR experiment. All the 2D spectra were plotted at same noise level. C. 1D cross sections of TEDOR and TEDOR+NCA spectra along 15N dimension at 119 ppm, showing the signal enhancement.
Simultaneous acquisition of TEDOR, NCA, and NCO correlation experiments.
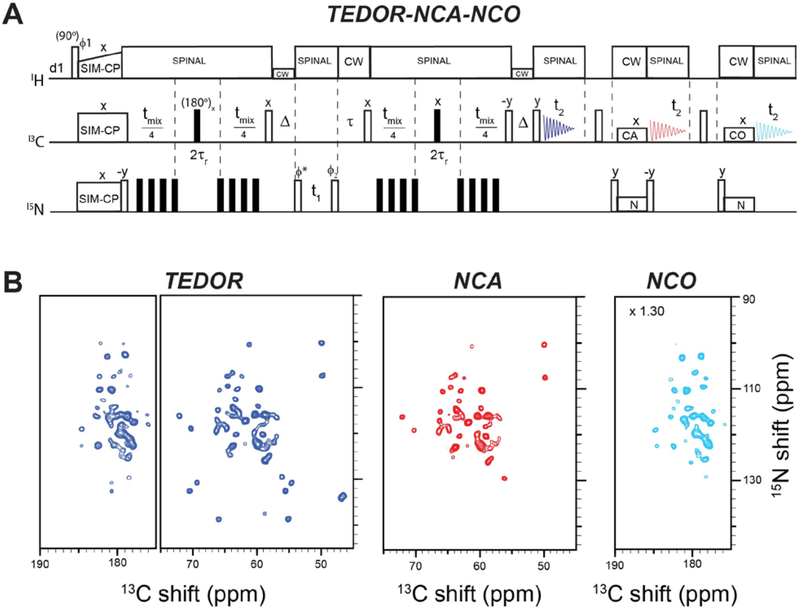
The hybridization of TEDOR and SPECIFIC-CP enables the concatenation of TEDOR, NCA, and NCO experiments for their simultaneous detection (Figure 5A). The pulse sequence is an extension of 2D TEDOR-NCA and utilizes the residual 15N polarization stored on the z-axis by a 90° pulse after NCA transfer. The first and second acquisitions enable the recording of TEDOR and NCA spectra, respectively. After the second acquisition, the residual 15N polarization (‘orphan’ or ‘afterglow’ polarization)8,37 is transferred to 13CO by a 90° pulse and the NCO transfer using SPECIFIC-CP, which creates an NCO correlation experiment recorded in the third acquisition period. As shown previously, 30–35% of signal intensity is retained by the residual 15N polarization after the NCA transfer 8,37, hence the third spectrum is typically 30–35 % less intense than the second spectrum. To demonstrate the performance of the hybridized TEDOR-NCA-NCO pulse sequence, we used a U-13C,15N microcrystalline ubiquitin sample (Figure 5B). The integrated intensities of 2D NCA and NCO spectra (red and green, respectively) are 1.2 and 0.7 times, respectively, that of the TEDOR spectrum (blue). As shown in Figures 4 and 5 for both U-13C,15N SatP and U-13C,15N ubiquitin, TEDOR-NCA, TEDOR-NCO or TEDOR-NCA-NCO experiments offer an efficient way to assign Pro resonances. In fact, Pro resonances, which are typically located between 128 to 135 ppm in the15N dimension, display substantially higher signals in the TEDOR spectra compared to NCA spectra. This is due to inefficient 15N CP caused by the absence of directly bound protons to the imino groups of Pro residues. In contrast, TEDOR detects Pro residues more efficiently by using 13C CP followed by a CANCA or CONCO pathway.
Figure 5:
A. TEDOR-NCA-NCO pulse sequence for simultaneous acquisition of TEDOR, NCA and NCO experiments. B. Spectra of U-13C-15N ubiquitin microcrystalline sample recorded with the pulse sequence in A. The 2D spectra of TEDOR and NCA were drawn at same noise level, whereas NCO spectrum was multiplied by 1.30 to show all the resonances.
Simultaneous acquisition of 3D-TEDOR, NCACX, and NCOCX experiments.
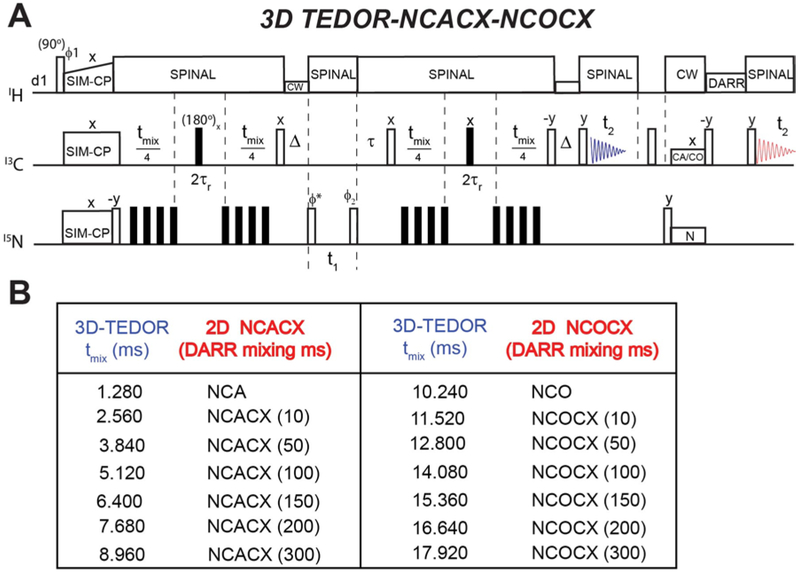
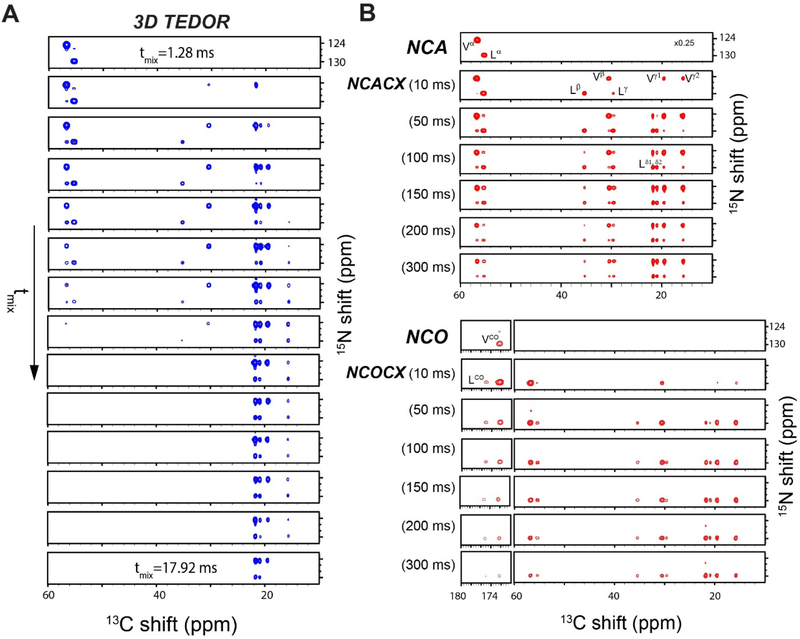
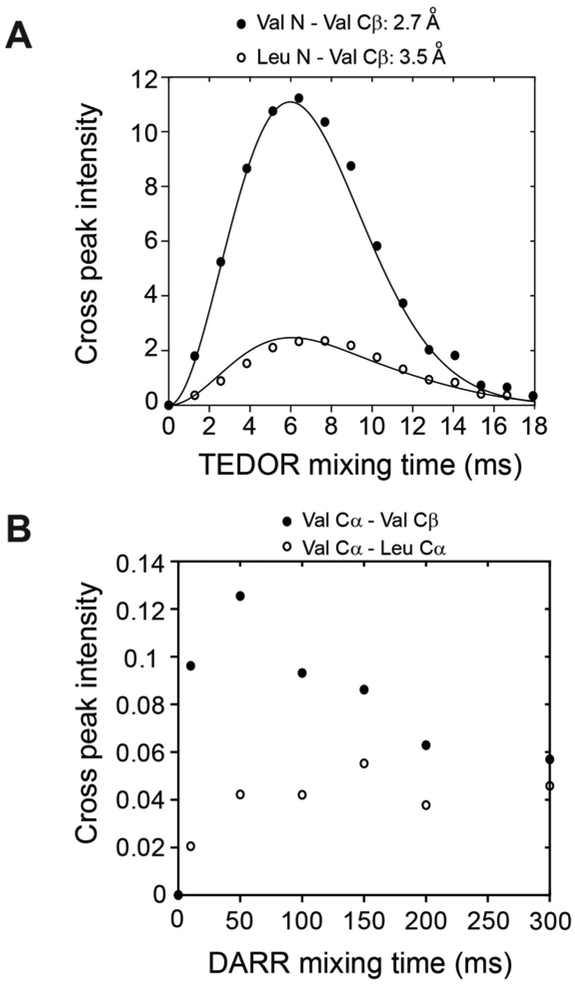
Using a similar strategy, we hybridized 3D TEDOR, NCACX, and NCOCX experiments (Figure 6). In this pulse sequence, a 3D TEDOR spectrum is acquired during the first acquisition, whereas NCACX and NCOCX are recorded in the second acquisition. Typically, 3D TEDOR requires 12 to 18 mixing periods, which can be synchronized with NCACX and NCOCX experiments having different DARR mixing times. Figure 6B, shows a table with fourteen mixing times for the 3D TEDOR experiment in the first acquisition. For the second acquisition, the 3D TEDOR experiment is synchronized with seven NCACX and seven NCOCX experiments, with DARR mixing times set to 0, 10, 50, 100, 150, 200, and 300 ms. As a benchmark, we used U-13C,15N N-acetyl-Valine-Leucine (NAVL) dipeptide with an unlabeled acetyl group. Figure 7A and 7B show the strip plots extracted from the 3D-TEDOR, NCACX and NCOCX spectra of NAVL. The corresponding intensities of the TEDOR cross peaks observed between Val N to Val Cβ, and Leu N to Val Cβ as a function of the mixing time are reported in Figure 8A. Even at short mixing times, the signal-to-noise ratio for the cross-peaks is greater than 15 and the resulting experimental error bars are contained within the symbols. The peak intensities were fit to simulated curves using the equations reported in reference 19, where the intra-residue distance between Val N to Val Cβ was set to 2.7 Å, and the inter-residue distance between Leu N to Val Cβ was set to 3.5 Å. These distances are in close agreement with those reported in the literature 19. Note that the NAVL crystal used in this work contains 100% U-13C,15N labeled molecules, which may cause slight deviations from the theoretical TEDOR curves due to inter-molecular dipolar couplings. Figure 8B shows the plot of the intensities of 13C-13C cross-peaks between Val Cα to Val Cβ and Val Cα to Leu Cα obtained from the NCACX spectra at various DARR mixing times (Figure 7B). The peak intensities were normalized with the Val Cα peak of the NCA spectrum (Figure 7B). As expected, the Val Cα-Cβ cross peak has the highest intensity at shorter DARR mixing time (50 ms). On the other hand, the inter-residue cross peak between Val Cα to Leu Cα requires 150 ms DARR mixing time to build up completely and reaches a plateau due to spin diffusion. Note that in general the DARR peak intensities are less quantitative than TEDOR experiments; therefore, it is advisable to acquire multiple DARR spectra at different mixing times and classify peak intensities as short-, medium-, and long-range distances of up to 10 Å 38,39. Note that in the 3D experiment, the initial polarization of NCACX and NCOCX experiments can be slightly different due to the effect of 180° pulses on 15N z-magnetization during the TEDOR mixing. Figure 9 shows the intensity variation of 1D NCA spectra of NAVL sample acquired in the second acquisition at different TEDOR mixing times. Even at longer mixing times (10–15 ms), the loss of intensity is less than 10% with respect to the initial mixing period of 1.28 ms.
Figure 6:
A. Hybrid pulse sequence for simultaneous acquisition of 3D TEDOR, NCACX, and NCOCX experiments. B. Table reporting the different mixing times for TEDOR and DARR used for the experiments on the NAVL peptide (see also Figure 7).
Figure 7:
3D spectra of NAVL dipeptide acquired simultaneously with the TEDOR-NCACX-NCOCX pulse sequence. A. TEDOR spectra at different mixing times. B. NCACX, and NCOCX spectra at different DARR mixing times.
Figure 8:
Simultaneous measurement of 15N-13C and 13C-13C distance restraints on NAVL dipeptide from 3D-TEDOR-NCACX-NCOCX spectra of Figure 7. A. 3D TEDOR cross peak intensities as a function of the mixing time. The Val N to Val Cβ cross peaks are indicated as filled circles. The cross peaks for Leu N to Val Cβ are indicated with open circles. The cross peak intensities were fit with simulated curves using 2.7 and 3.5 Å, respectively. B. NCACX cross peak intensities between Val Cα-Cβ and Val Cα–Leu Cα plotted at different DARR mixing times.
Figure 9:
Effects of the TEDOR 180° pulses on the 15N z-magnetization of the NAVL dipeptide as monitored by 1D NCA spectra. The spectra refer to the second acquisition of the pulse sequence reported in Figure 6A.
DISCUSSION
In ssNMR, the efficiency of CP transfer periods is often compromised by 1H-1H spin diffusion. As a result, only a portion of nuclear polarization generated in the preparation periods is converted into observable coherences. Pines and Waugh were the first to exploit the residual polarization of the rich 1H spin bath to acquire multiple 1H-enhanced CP spectra and increase the signal-to-noise ratio of solid samples 40. More recently, Tang and Nevzorov proposed a comparable scheme to enhance the sensitivity of oriented membrane protein samples 41. In spite of that, most pulse sequences are inefficient and many spin operators remain essentially undetectable (orphan spin operators) 18,42,43.
During the past decade, our group has developed POEs to recover orphan spin operators for signal enhancements or acquire multiple spectra from single pulse sequences in both oriented and MAS ssNMR 7,10,18,8,11,42,43. POE experiments in MAS are based on the SIM-CP preparation period, where the rich 1H spin bath enables the simultaneous generation of 13C and 15N polarization pathways, which are then utilized for acquiring 2D multidimensional experiments using DUMAS pulse sequences 7,10,18. In addition, POE utilizes 13C and 15N residual polarization pathways resulting from N-C CP periods and generates four to eight multi-dimensional spectra (MEIOSIS and MAESTOSO-8) 8,11. Other groups have paralleled our efforts. For instance, the use of 15N residual polarization pathways have also been utilized by Ramachandran and co-workers for acquiring multiple experiments under fast MAS conditions 15. Similarly, the ‘afterglow’ pulse sequences developed by the Traaseth lab exploits the residual 15N polarization and simultaneously records NCA and NCO spectra 37. The afterglow phenomenon has been used in concert with SIM-CP for the MEOSIS scheme to record four 2D spectra simultaneously [DARR, NCACX, NCO and CA(N)CO] 8.
Our previously published POEs were able to generate a 13C-13C homonuclear correlated spectrum in the first acquisition and exploit the additional 15N or 13C polarization for single or multiple 13C-13C and 13C-15N correlation experiments 7,10,11,44. By hybridizing TEDOR and NCX experiments in this work, we introduced a novel way to obtain multiple 15N-13C experiments for both resonance assignments and distance measurements. This new sub-class of POEs takes advantage of the small dipolar couplings (~ 1 kHz) associated with NCA or NCO spin pairs that enable the 15N-13C polarization transfer. In the original TEDOR pulse sequence, the 15N-13C dipolar recoupling is achieved by using a pair of REDOR mixing periods 19,30; whereas the NCX (NCA or NCO) transfer uses a selective 15N-13C recoupling via Hartmann-Hahn matching using SPECIFIC-CP 23,45. A key difference between TEDOR and NCX experiments is the initial preparation period. While TEDOR uses the 13C polarization originating from 1H-13C CP, the NCX experiment uses the 15N polarization from 1H-15N CP. The hybridized 2D and 3D TEDOR-NCX pulse sequences combine these two pathways for generating multiple 15N-13C correlation spectra.
The optimal performance of TEDOR and SPECIFIC-CP depends on the sample characteristics as well as quality of the NMR hardware (RF homogeneity and probes). For instance, longer transfer periods for SPECIFIC-CP (3–6 ms) may cause inefficient polarization transfer due to fast T1ρ relaxation and/or RF inhomogeneity 46,47. In the most favorable cases, the latter problem can be overcome by using shaped pulses to suppress RF inhomogeneity during the NC transfer 46,48,49. Note also that TEDOR transfer relies on the efficiency of 180° pulses and T2 relaxation of the antiphase spin operators, which is relatively short for biomolecular solids. A detailed description of how RF inhomogeneity and sample characteristics affect the ssNMR experiments can be found in the references 50–52. In our hands, however, we found that NCA transfer is more efficient than TEDOR for membrane proteins such as SatP (Figures 2 and 4). Therefore, the performance of these two techniques may depend mostly on sample heterogeneity and protein dynamics. In fact, the RF inhomogeneity compensated shaped pulses can also be applied to hybrid TEDOR-NCX pulse sequences. From a technical viewpoint, the application of POEs with multiple acquisitions may result in an increase of RF duty cycles; however, the pulse sequences designed here are within the power limits indicated for the commercially available E-free or low-E MAS ssNMR probes 12–14.
In recent years, several different techniques have been proposed to speed up the acquisition of MAS ssNMR experiments. Among those, the conjoined ultra-fast MAS with proton detection 53–58 and sparse protein perdeuteration 59 have produced spectra with the resolution and sensitivity comparable to those of liquid-state NMR. Additionally, Ishii and co-workers introduced the use of paramagnetic relaxation agents, reducing recycle delays and increasing the repetition times 60. However, the most significant sensitivity enhancement for biomolecular solids has been achieved using dynamic nuclear polarization (DNP) 61, with recent applications on several biological macromolecules. The pulse sequences presented here can be implemented with the above techniques in a synergistic way to boost even more the sensitivity and resolution of multidimensional NMR experiments for biomolecular samples.
CONCLUSIONS
In conclusion, we introduced a new sub-class of POE pulse sequences for simultaneous acquisition of multiple NC correlation spectra using a single receiver. Both 2D and 3D TEDOR experiments are combined with NC or NCC sequences for recording 15N-13C fingerprints as well as simultaneous measurements of 15N-13C and 13C-13C distances. These experiments are not alternatives to the existing approaches for sensitivity enhancement; rather they provide novel strategies that can be combined with the current methods to speed up data acquisition and lead to faster structure determination of proteins in different folded states.
ACKNOWLEDGEMENTS
This work was supported by the National Institute of Health (GM 64742 to G.V. and R35 GM118047 to H.A.). Many thanks to Dr. D. Weber for critical reading and editing the manuscript.
REFERENCES
- 1.Ader C et al. Structural rearrangements of membrane proteins probed by water-edited solid-state NMR spectroscopy. J Am Chem Soc 131, 170–6 (2009). [DOI] [PubMed] [Google Scholar]
- 2.Castellani F et al. Structure of a protein determined by solid-state magic-angle-spinning NMR spectroscopy. Nature 420, 98–102 (2002). [DOI] [PubMed] [Google Scholar]
- 3.Gustavsson M et al. Allosteric regulation of SERCA by phosphorylation-mediated conformational shift of phospholamban. Proc Natl Acad Sci U S A 110, 17338–43 (2013). [DOI] [PMC free article] [PubMed] [Google Scholar]
- 4.Hong M, Zhang Y & Hu F Membrane protein structure and dynamics from NMR spectroscopy. Annu Rev Phys Chem 63, 1–24 (2012). [DOI] [PMC free article] [PubMed] [Google Scholar]
- 5.Hu F, Luo W & Hong M Mechanisms of proton conduction and gating in influenza M2 proton channels from solid-state NMR. Science 330, 505–8 (2010). [DOI] [PMC free article] [PubMed] [Google Scholar]
- 6.Wang S & Ladizhansky V Recent advances in magic angle spinning solid state NMR of membrane proteins. Prog Nucl Magn Reson Spectrosc 82C, 1–26 (2014). [DOI] [PubMed] [Google Scholar]
- 7.Gopinath T & Veglia G Dual acquisition magic-angle spinning solid-state NMR-spectroscopy: simultaneous acquisition of multidimensional spectra of biomacromolecules. Angew Chem Int Ed Engl 51, 2731–5 (2012). [DOI] [PMC free article] [PubMed] [Google Scholar]
- 8.Gopinath T & Veglia G Orphan spin operators enable the acquisition of multiple 2D and 3D magic angle spinning solid-state NMR spectra. J Chem Phys 138, 184201 (2013). [DOI] [PMC free article] [PubMed] [Google Scholar]
- 9.Gopinath T & Veglia G Experimental Aspects of Polarization Optimized Experiments (POE) for Magic Angle Spinning Solid-State NMR of Microcrystalline and Membrane-Bound Proteins. Methods Mol Biol 1688, 37–53 (2018). [DOI] [PubMed] [Google Scholar]
- 10.Gopinath T & Veglia G 3D DUMAS: simultaneous acquisition of three-dimensional magic angle spinning solid-state NMR experiments of proteins. J Magn Reson 220, 79–84 (2012). [DOI] [PMC free article] [PubMed] [Google Scholar]
- 11.Gopinath T & Veglia G Multiple acquisitions via sequential transfer of orphan spin polarization (MAeSTOSO): How far can we push residual spin polarization in solid-state NMR? J Magn Reson 267, 1–8 (2016). [DOI] [PMC free article] [PubMed] [Google Scholar]
- 12.Gor’kov PL et al. Using low-E resonators to reduce RF heating in biological samples for static solid-state NMR up to 900 MHz. J Magn Reson 185, 77–93 (2007). [DOI] [PubMed] [Google Scholar]
- 13.McNeill SA, Gor’kov PL, Shetty K, Brey WW & Long JR A low-E magic angle spinning probe for biological solid state NMR at 750 MHz. J Magn Reson 197, 135–44 (2009). [DOI] [PMC free article] [PubMed] [Google Scholar]
- 14.Stringer JA et al. Reduction of RF-induced sample heating with a scroll coil resonator structure for solid-state NMR probes. J Magn Reson 173, 40–8 (2005). [DOI] [PubMed] [Google Scholar]
- 15.Bellstedt P et al. Solid state NMR of proteins at high MAS frequencies: symmetry-based mixing and simultaneous acquisition of chemical shift correlation spectra. J Biomol NMR 54, 325–35 (2012). [DOI] [PubMed] [Google Scholar]
- 16.Das BB & Opella SJ Simultaneous cross polarization to (13)C and (15)N with (1)H detection at 60kHz MAS solid-state NMR. J Magn Reson 262, 20–26 (2016). [DOI] [PMC free article] [PubMed] [Google Scholar]
- 17.Sharma K, Madhu PK & Mote KR A suite of pulse sequences based on multiple sequential acquisitions at one and two radiofrequency channels for solid-state magic-angle spinning NMR studies of proteins. J Biomol NMR 65, 127–141 (2016). [DOI] [PubMed] [Google Scholar]
- 18.Gopinath T & Veglia G Orphan Spin Polarization: A Catalyst for High-Throughput Solid-State NMR Spectroscopy of Proteins. Annual Reports on NMR Spectroscopy 89, 103–21 (2016). [DOI] [PMC free article] [PubMed] [Google Scholar]
- 19.Jaroniec CP, Filip C & Griffin RG 3D TEDOR NMR experiments for the simultaneous measurement of multiple carbon-nitrogen distances in uniformly (13)C,(15)N-labeled solids. J Am Chem Soc 124, 10728–42 (2002). [DOI] [PubMed] [Google Scholar]
- 20.Rienstra CM et al. De novo determination of peptide structure with solid-state magic-angle spinning NMR spectroscopy. Proc Natl Acad Sci U S A 99, 10260–5 (2002). [DOI] [PMC free article] [PubMed] [Google Scholar]
- 21.Hong M & Griffin RG Resonance assignments for solid peptides by dipolar-mediated C-13/N-15 correlation solid-state NMR. Journal of the American Chemical Society 120, 7113–7114 (1998). [Google Scholar]
- 22.Andrew W Hing S, and Schaefer Jacob. Transferred-echo double-resonance NMR. Journal of Magnetic Resonance 96, 205–209 (1992). [Google Scholar]
- 23.Baldus M, Petkova AT, Herzfeld J & Griffin RG Cross polarization in the tilted frame: assignment and spectral simplification in heteronuclear spin systems. Molecular Physics 95, 1197–1207 (1998). [Google Scholar]
- 24.Traaseth NJ et al. Structural and dynamic basis of phospholamban and sarcolipin inhibition of Ca(2+)-ATPase. Biochemistry 47, 3–13 (2008). [DOI] [PMC free article] [PubMed] [Google Scholar]
- 25.Sa-Pessoa J et al. SATP (YaaH), a succinate-acetate transporter protein in Escherichia coli. Biochem J 454, 585–95 (2013). [DOI] [PubMed] [Google Scholar]
- 26.Sun P et al. Crystal structure of the bacterial acetate transporter SatP reveals that it forms a hexameric channel. J Biol Chem (2018). [DOI] [PMC free article] [PubMed] [Google Scholar]
- 27.Qiu B et al. Succinate-acetate permease from Citrobacter koseri is an anion channel that unidirectionally translocates acetate. Cell Res 28, 644–654 (2018). [DOI] [PMC free article] [PubMed] [Google Scholar]
- 28.Igumenova TI et al. Assignments of carbon NMR resonances for microcrystalline ubiquitin. J Am Chem Soc 126, 6720–7 (2004). [DOI] [PubMed] [Google Scholar]
- 29.Buck B et al. Overexpression, purification, and characterization of recombinant Ca-ATPase regulators for high-resolution solution and solid-state NMR studies. Protein Expression and Purification 30, 253–261 (2003). [DOI] [PubMed] [Google Scholar]
- 30.Hing AW & Schaefer J Two-dimensional rotational-echo double resonance of Val1-[1–13C]Gly2-[15N]Ala3-gramicidin A in multilamellar dimyristoylphosphatidylcholine dispersions. Biochemistry 32, 7593–604 (1993). [DOI] [PubMed] [Google Scholar]
- 31.Gullion T & Schaefer J Development of REDOR rotational-echo double-resonance NMR. Journal of Magnetic Resonance 81, 196 (1989). [DOI] [PubMed] [Google Scholar]
- 32.Gullion T, Baker DB & Conradi MS New, compensated Carr-Purcell sequences. Journal of Magnetic Resonance 89, 479–484 (1990). [Google Scholar]
- 33.Fung BM, Khitrin AK & Ermolaev K An improved broadband decoupling sequence for liquid crystals and solids. J Magn Reson 142, 97–101 (2000). [DOI] [PubMed] [Google Scholar]
- 34.Franks WT, Kloepper KD, Wylie BJ & Rienstra CM Four-dimensional heteronuclear correlation experiments for chemical shift assignment of solid proteins. J Biomol NMR 39, 107–31 (2007). [DOI] [PubMed] [Google Scholar]
- 35.Takegoshi K N., S; and Terao T 13C-1H dipolar-assisted rotational resonance in magic-angle spinning NMR. Chemical Physics Letters 344, 631–637 (2001). [DOI] [PubMed] [Google Scholar]
- 36.Mote KR, Gopinath T & Veglia G Determination of structural topology of a membrane protein in lipid bilayers using polarization optimized experiments (POE) for static and MAS solid state NMR spectroscopy. J Biomol NMR 57, 91–102 (2013). [DOI] [PMC free article] [PubMed] [Google Scholar]
- 37.Banigan JR & Traaseth NJ Utilizing afterglow magnetization from cross-polarization magic-angle-spinning solid-state NMR spectroscopy to obtain simultaneous heteronuclear multidimensional spectra. J Phys Chem B 116, 7138–44 (2012). [DOI] [PMC free article] [PubMed] [Google Scholar]
- 38.Zhang Y et al. Resonance assignment and three-dimensional structure determination of a human alpha-defensin, HNP-1, by solid-state NMR. J Mol Biol 397, 408–22 (2010). [DOI] [PMC free article] [PubMed] [Google Scholar]
- 39.Ekanayake EV, Fu R & Cross TA Structural Influences: Cholesterol, Drug, and Proton Binding to Full-Length Influenza A M2 Protein. Biophys J 110, 1391–9 (2016). [DOI] [PMC free article] [PubMed] [Google Scholar]
- 40.Pines A, Waugh JS & Gibby MG Proton-Enhanced Nuclear Induction Spectroscopy - Method for High-Resolution Nmr of Dilute Spins in Solids. Journal of Chemical Physics 56, 1776 (1972). [Google Scholar]
- 41.Tang W & Nevzorov AA Repetitive cross-polarization contacts via equilibration-re-equilibration of the proton bath: Sensitivity enhancement for NMR of membrane proteins reconstituted in magnetically aligned bicelles. J Magn Reson 212, 245–8 (2011). [DOI] [PubMed] [Google Scholar]
- 42.Gopinath T, Mote KR & Veglia G Proton evolved local field solid-state nuclear magnetic resonance using Hadamard encoding: theory and application to membrane proteins. J Chem Phys 135, 074503 (2011). [DOI] [PMC free article] [PubMed] [Google Scholar]
- 43.Gopinath T & Veglia G Sensitivity enhancement in static solid-state NMR experiments via single- and multiple-quantum dipolar coherences. J Am Chem Soc 131, 5754–6 (2009). [DOI] [PMC free article] [PubMed] [Google Scholar]
- 44.Gopinath T & Veglia G Multiple acquisition of magic angle spinning solid-state NMR experiments using one receiver: application to microcrystalline and membrane protein preparations. J Magn Reson 253, 143–53 (2015). [DOI] [PMC free article] [PubMed] [Google Scholar]
- 45.Hartmann SR & Hahn EL Nuclear Double Resonance in the Rotating Frame. Physical Review 128, 2042–2053 (1962). [Google Scholar]
- 46.Jain S, Bjerring M & Nielsen NC Efficient and Robust Heteronuclear Cross-Polarization for High-Speed-Spinning Biological Solid-State NMR Spectroscopy. J Phys Chem Lett 3, 703–8 (2012). [DOI] [PubMed] [Google Scholar]
- 47.Daviso E, Eddy MT, Andreas LB, Griffin RG & Herzfeld J Efficient resonance assignment of proteins in MAS NMR by simultaneous intra- and inter-residue 3D correlation spectroscopy. J Biomol NMR 55, 257–65 (2013). [DOI] [PMC free article] [PubMed] [Google Scholar]
- 48.Tosner Z et al. Overcoming Volume Selectivity of Dipolar Recoupling in Biological Solid-State NMR Spectroscopy. Angew Chem Int Ed Engl 57, 14514–14518 (2018). [DOI] [PubMed] [Google Scholar]
- 49.Manu VS & Veglia G Optimization of identity operation in NMR spectroscopy via genetic algorithm: Application to the TEDOR experiment. J Magn Reson 273, 40–46 (2016). [DOI] [PMC free article] [PubMed] [Google Scholar]
- 50.Paulson EK, Martin RW & Zilm KW Cross polarization, radio frequency field homogeneity, and circuit balancing in high field solid state NMR probes. J Magn Reson 171, 314–23 (2004). [DOI] [PubMed] [Google Scholar]
- 51.Tosner Z et al. Radiofrequency fields in MAS solid state NMR probes. J Magn Reson 284, 20–32 (2017). [DOI] [PubMed] [Google Scholar]
- 52.Tekely P & Goldman M Radial-field sidebands in MAS. J Magn Reson 148, 135–41 (2001). [DOI] [PubMed] [Google Scholar]
- 53.Zhang R, Mroue KH & Ramamoorthy A Proton-Based Ultrafast Magic Angle Spinning Solid-State NMR Spectroscopy. Acc Chem Res 50, 1105–1113 (2017). [DOI] [PMC free article] [PubMed] [Google Scholar]
- 54.Andreas LB, Le Marchand T, Jaudzems K & Pintacuda G High-resolution proton-detected NMR of proteins at very fast MAS. Journal of Magnetic Resonance 253, 36–49 (2015). [DOI] [PubMed] [Google Scholar]
- 55.Demers JP, Chevelkov V & Lange A Progress in correlation spectroscopy at ultra-fast magic-angle spinning: Basic building blocks and complex experiments for the study of protein structure and dynamics. Solid State Nuclear Magnetic Resonance 40, 101–113 (2011). [DOI] [PubMed] [Google Scholar]
- 56.Zhou DH et al. Proton-Detected Solid-State NMR Spectroscopy of Fully Protonated Proteins at 40 kHz Magic-Angle Spinning. Journal of the American Chemical Society 129, 11791–11801 (2007). [DOI] [PubMed] [Google Scholar]
- 57.Struppe J et al. Expanding the horizons for structural analysis of fully protonated protein assemblies by NMR spectroscopy at MAS frequencies above 100 kHz. Solid State Nuclear Magnetic Resonance 87, 117–125 (2017). [DOI] [PMC free article] [PubMed] [Google Scholar]
- 58.Wang S et al. Nano-mole scale sequential signal assignment by (1)H-detected protein solid-state NMR. Chem Commun (Camb) 51, 15055–8 (2015). [DOI] [PMC free article] [PubMed] [Google Scholar]
- 59.Reif B Ultra-high resolution in MAS solid-state NMR of perdeuterated proteins: implications for structure and dynamics. J Magn Reson 216, 1–12 (2012). [DOI] [PubMed] [Google Scholar]
- 60.Wickramasinghe NP et al. Nanomole-scale protein solid-state NMR by breaking intrinsic 1HT1 boundaries. Nature methods 6, 215–218 (2009). [DOI] [PMC free article] [PubMed] [Google Scholar]
- 61.Barnes AB et al. High-Field Dynamic Nuclear Polarization for Solid and Solution Biological NMR. Appl Magn Reson 34, 237–263 (2008). [DOI] [PMC free article] [PubMed] [Google Scholar]


