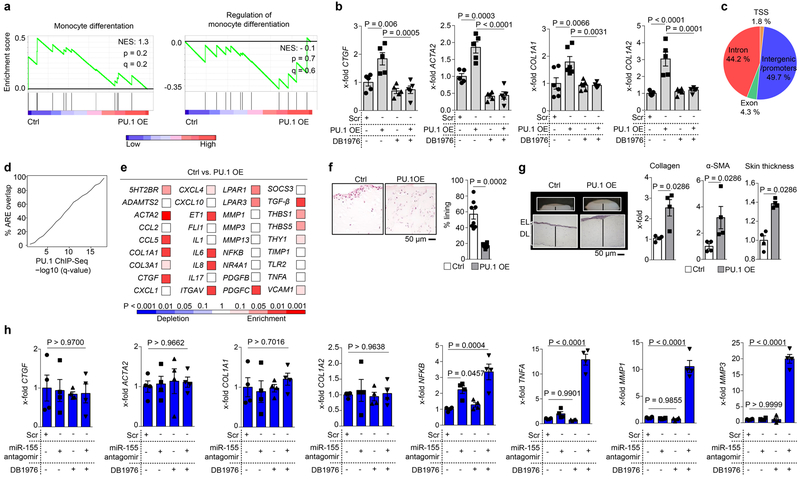
Extended Data Figure 5: Profibrotic potential of PU.1.
(a) Gene set enrichment analysis (GSEA) of quantitative RNA-Seq signals of Gene Ontology (GO)-defined monocytic related gene clusters in human resting fibroblasts co-transfected with PU.1 (n = 4). Resting fibroblasts co-transfected with control plasmid served as controls (n = 4). NES, normalized enrichment score; (b) mRNA expression levels of indicated transcripts in human resting fibroblasts treated with or without DB1976 and simultaneously co-transfected with or without PU.1 (pUNO.1-hSPI1, called ‘PU.1 OE’ here, n = 5 each) as assessed by qPCR; co-transfection with scrambled (scr) plasmid served as control. Results are presented relative to cells co-transfected with scr. (c) Genomic annotation of PU.1-binding sites defined by ChIP-seq analysis in primary human fibrotic fibroblasts. TSS, transcription start site. (d) Annotation of PU.1 ChIP-seq peaks (n = 3 each) at various q-value treshholds to active regulatory elements (AREs). For unbiased identification of AREs 11 ENCODE datasets from DNAse-seq and histone ChIP-seq were used as described in materials & methods; q-values are those provided by MACS2 call-peak64. (e) Differentially expressed genes from gene sets of inflammatory fibroblasts co-transfected with PU.1 (PU.1 OE) or scr vector as control (ctrl); gene sets include fibrosis-associated, inflammatory and matrix-degrading pathways determined by qPCR (n = 4 each). Colors represent the significance levels of the observed changes of the respective expression levels in PU.1 OE compared to ctrl. (f) Micro-mass organoids of inflammatory fibroblasts co-transfected with PU.1 (PU.1 OE) or scr vector as control in the presence of TNF-α for 21 days (n = 8 each). Sections of micro-mass organoids were stained with hematoxylin & eosin. Lining fibroblasts were quantified relative to total number of cells per high power field (HPF). (g) 3D full skin organoid model of inflammatory fibroblasts co-transfected with PU.1 (PU.1 OE) or scr vector as control; EL: epidermal layer, DL: dermal layer; collagen content was measured by hydroxyproline assay; α-SMA and skin thickness were quantified per HPF (n = 4 each). (h) mRNA expression levels of indicated transcripts in primary human inflammatory fibroblasts treated with or without DB1976 and simultaneously co-transfected with or without miR-155 antagomirs (n = 4 each); results are presented relative to cells co-transfected with scrambled antagomirs (scr). Data are shown as the mean ± s.e.m. of respective n independent experiments. P values were determined either according to Subramanian et al.72 (a), by one-way ANOVA with Tukey's multiple comparison post hoc test (b, h) or two-tailed Mann–Whitney U test (e-g).

