

Abstract
Hypoxia is regarded as a potential prognostic biomarker for tumor aggressiveness, progression, and response to therapy. The radiotracer 18F-fluoromisonidazole ([18F]FMISO) has been used with positron emission tomography (PET) to reveal tumor hypoxia. Meanwhile, blood oxygen level dependent (BOLD) MRI and tissue oxygen level dependent (TOLD) MRI offer insight into oxygenation based on endogenous signals without the need for radiolabels. Here, we compared BOLD and TOLD MRI with [18F]FMISO uptake using Dunning prostate R3327-AT1 tumor bearing rats. BOLD and TOLD MRI were acquired with respect to an oxygen gas breathing challenge. The following day, dynamic PET was performed up to 90 minutes following IV injection of [18F]FMISO. Tumors showed distinct heterogeneity based on each technique. Correlations were observed between magnitude of mean BOLD or TOLD MRI signal responses to oxygen-breathing challenge and initial distribution of [18F]FMISO. Correlations were observed for whole tumor as well on a regional basis with stronger correlations in the well perfused tumor periphery indicating the strong influence of perfused vasculature. After 90 minutes most correlations with signal intensity became quite weak, but correlations were observed between hypoxic fraction based on FMISO and fractions of tumor showing BOLD or TOLD response in a subset of tumors. This emphasizes the importance of considering regional heterogeneity and responsive fractions, as opposed to simple magnitudes of responses. Although the data represent a small cohort of tumors they present direct correlations between oxygen sensitive MRI and PET hypoxia reporter agents in the same tumors, indicating the potential utility of further investigations.
Keywords: Tumor hypoxia, oxygen, BOLD, TOLD, biomarkers, prostate tumor, MRI, [18F]FMISO, PET
Introduction
Hypoxia is known to be associated with tumor aggressiveness, metastatic spread and resistance to various treatments [1,2]. As such there has been much interest in developing non-invasive imaging approaches to assessing tumor oxygenation and hypoxia [2-5]. 18F-fluoromisonidazole ([18F]FMISO) has been developed as an imaging radiotracer for tumor hypoxia using positron emission tomography (PET) [3,6]. Meanwhile, blood oxygen level dependent (BOLD) MRI and tissue oxygen level dependent (TOLD) MRI assess vascular oxygenation and tissue oxygenation through the paramagnetic endogenous contrast caused by deoxyhemoglobin and the oxygen molecule, respectively [7-9]. Measurement of BOLD and TOLD with an oxygen breathing intervention can provide information on oxygen delivery [8]. In this study we have explored correlation between these approaches. Specifically, we compared [18F]FMISO uptake with BOLD and TOLD MRI in the well characterized Dunning prostate R3327-AT1 tumor growing subcutaneously in rats [10,11].
Many solid tumors exhibit oxygen deficiency (hypoxia) as a result of rapid growth and inefficient vasculature arising from disorganized angiogenesis. Tumor hypoxia is increasingly regarded as an important factor for malignant progression and response to therapy [12,13]. The direct measurement of tumor hypoxia historically required invasive procedures such as the insertion of polarographic oxygen-sensitive electrodes, which has been considered as the gold standard for measuring the hypoxic fraction in tumors [2]. Noninvasive imaging offers several advantages, including the feasibility of longitudinal measurements on the same subject, the generation of complete three-dimensional maps of tumor hypoxia, and the potential application to image-guided therapy. Quantitative dynamic oximetry has also been achieved using the direct injection of specific oxygen sensitive reporter molecules such as perfluorocarbons, siloxanes and chars permitting oximetry based on 19F or 1H MRI or ESR [14-18]. However, these methods are invasive and are therefore restricted to easily accessible tumors. In addition, they are limited to a relatively small number of measurements. An alternative approach is the use of nitroimidazoles to visualize hypoxia itself [3].
Extensive studies have reported radiotracers that selectively accumulate in hypoxic tumors and detection using PET or SPECT. The most extensively developed agent for PET is 18F-fluoromisonidazole ([18F]FMISO) [3,6]. [18F]FMISO is a lipophilic compound that enters cells by diffusion. Under normoxic conditions, there is equilibrium of intra-cellular and extra-cellular [18F]FMISO, while under hypoxic conditions, a sequence of single electron reductions takes place and it binds to intracellular macromolecules. Several groups reported that there is retention of [18F]FMISO based on tissue oxygenation as assessed by pO2-polarography [19]. Hence, the accumulation of [18F]FMISO in tumors is related to hypoxia. FMISO has been applied in multiple clinical trials, but other agents with modified properties, notably lipophilicity have been developed [3,6,20].
MRI provides functional and anatomical information on tumor vasculature and physiology at high spatial resolution. Recently, oxygen sensitive MRI has attracted increasing interest as a non-invasive indicator [2,5,21,22]. Blood oxygen level dependent (BOLD) MRI is sensitive to vascular oxygenation since deoxyhemoglobin is paramagnetic causing local susceptibility gradients influencing the effective transverse relaxation rate (R2*) [23-26]. Some studies examine baseline R2* as an indicator of hypoxia [27-29], but we favor examining the response ΔR2* to an intervention such as an oxygen breathing gas challenge [8]. Tissue oxygen level dependent (TOLD) MRI is based on T1-weighted images or R1 (=1/T1) relaxation rate measurements. R1 is directly influenced by paramagnetic molecular O2 and is therefore sensitive to the local concentration and consequently partial pressure (pO2) [30,31]. Increasingly studies examine combined BOLD and TOLD measurements to provide additional insights into tissue oxygenation [7-9,32-34]. The aim of our study was to compare uptake of [18F]FMISO with BOLD and TOLD MRI to establish potential correlations relevant to assessing hypoxia. Previous studies in Heidelberg have examined [18F]FMISO uptake in the Dunning prostate R3327-AT1 tumor [35], while extensive studies in Dallas have explored oxygen sensitive MRI [8,36]. Others have interrogated correlations between oxygen sensitive MRI and nitroimidazoles based on immunohistochemistry [22,37]. One brief study examined uptake of FMISO in comparison with BOLD MRI in rat osteosarcomas [38] and others have compared BOLD MRI and hypoxia based on PET, but in separate cohorts of animals and separate publications [39,40]. We have now undertaken sequential combined investigations using BOLD, TOLD and FMISO based PET on individual tumors and believe this is the first study of this type.
Materials and methods
Tumor model
This study was approved by the Institutional Animal Care and Use Committee. Six adult male Copenhagen rats (bred in-house at UT Southwestern; originally from Charles River) were implanted subcutaneously with Dunning R3327-AT1 tumor. AT1 is an anaplastic, low metastatic, comparatively fast growing tumor with tumor volume doubling time of 5.2 days [10]. Tumors were originally obtained from Dr. J. T. Isaacs (Johns Hopkins, Baltimore, MD) [41]. Tumors were allowed to grow (1.4 to 2.6 cm3) and then investigated using MRI and PET.
MRI data acquisition
MRI was performed using an Agilent (Varian) 4.7 T MRI scanner (Palo Alto, CA) and a 35 mm single turn solenoid volume coil placed around the tumor and thigh, as described previously [42]. Briefly, the rats were maintained under general gaseous anesthesia (1.5% isoflurane in air (1 L/min); Baxter International, Deerfield, IL) and kept warm (37°C) using a circulating warm water blanket. Shimming was performed on the tissue water resonance. High resolution T2-weighted anatomical images were acquired transaxially to the tumor and thigh using a fast spin echo sequence (TR=2000 ms, effective TE=48 ms, Echo Train Length =8, 128×128 data matrix, 40×40 mm FOV, 1 mm slice thickness without gap). Interleaved BOLD and TOLD sequences (IBT) with baseline (air) followed by an oxygen gas breathing challenge were performed. BOLD data were acquired using a multi-echo gradient echo sequence with: TR=150 ms, 10 echoes TE range =6 to 69 ms with echo spacing of 7 ms, flip angle =20°, and acquisition time 21 s for 128×128 data matrix, 1 mm slice thickness and 40×40 mm FOV. TOLD was obtained using a gradient echo sequence with TR=30 ms, TE=5 ms, flip angle =45°, acquisition time 3 s, 128×128 data matrix, 1 mm slice thickness and 40×40 mm FOV to match the BOLD acquisition.
PET imaging
The next day PET was performed on a Siemens Inveon Multimodality PET/CT scanner (Siemens Medical Solution Inc., Knoxville, TN, USA). Anesthesia was induced with 3% isoflurane in air at room temperature and maintained under 2% isoflurane anesthesia. The CT images were acquired at 80 kV and 500 µA with a focal spot of 58 µm. The total rotation of the gantry was 360° with 360 rotation steps obtained at an exposure time of approximately 125 ms/frame. Each rat was injected by tail vein with [18F]FMISO (570-600 µCi in 200 µl saline, prepared in our laboratory, according to standard published procedures [43]). Immediately after injection, a dynamic PET scan was initiated and continued over a period of 90 min. PET data were reconstructed into 18 frames, where each frame represents the average value of the respective 5 min interval and PET dynamic time activity curve was generated. PET images were reconstructed using Fourier and Ordered Subsets Expectation Maximization 3D (OSEM3D) signogram and reconstruction algorithms, respectively. Reconstructed CT and PET images were fused and analyzed using Inveon Research Workplace (IRW) software.
Histology
Pimonidazole hydrochloride (Hypoxyprobe-1; NPI, Burlington, MA) was injected into the tail vein at a dose of 60 mg/kg. Sixty minutes later the rat was sacrificed and tissues prepared for routine immunohistochemical detection of pimonidazole hypoxia marker as described previously [44].
Data analysis
For PET quantification, volumes of interest (ROIs) were placed in specific areas. An ellipsoid shaped ROI was used to select the whole tumor. The tumor center was defined with the diameters reduced to 70% in all three dimensions (1/3 of the tumor volume) and the outer layer was defined as tumor periphery (2/3 of the tumor volume). PET data: for presentation a slice was selected by visual inspection of CT images from the 3D data to match the MRI orientation. An ROI was also placed on the contralateral muscle. The resulting quantitative data are expressed as percent of the injected dose per gram of tissue (%ID/g) and as the ratio of uptake of [18F]FMISO (%ID/g) in the region of interest (ROI) vs. muscle. Voxel by voxel analysis provided estimation of hypoxic fraction based on the standard accepted threshold of 1.2 times of %ID/g of muscle [3].
For MRI, ROIs were manually drawn for central and peripheral tumor regions. The changes in signal Intensity (%ΔSI) with respect to oxygen challenge were calculated as (Equation 1):
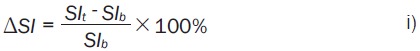 |
SIb is the mean baseline signal intensity during air breathing and SIt is the mean signal intensity with oxygen inhalation based on T1- or T2*-weighted (echo time =20 ms) imaging. R2* (1/T2*) maps were generated by fitting the multi-echo gradient echo images to TE, as a single exponential function on a voxel-by-voxel basis. Changes of T2* and R2* due to oxygen challenge were calculated on a voxel by voxel basis as (Equations 2, 3):
For each ROI, baseline temporal standard deviation in T2* and T1w SI was used to determine the responsive voxels as measured by each method, respectively. A voxel was labeled responsive if T2*w or T1w ΔSI was larger than n times the corresponding baseline standard deviation (n=1.5, 2.0, and 2.5 tested separately). The response fraction was defined as the fraction of responsive voxels over all voxels. Data were processed using Matlab (Math Works Inc., Natick, MA). Pearson correlation coefficients (r2) were calculated to compare measurements. Statistical analyses were performed using Microsoft Excel 2007 (Microsoft, Seattle, WA) and considered significant when P<0.05. Local and regional parameter and response were compared using linear regression.
Results
MRI showed distinct heterogeneity in the Dunning prostate R3327-AT1 tumors (Figures 1 and 2). Global and regional measurements as well as responses to oxygen breathing challenge are shown in Table 1A, 1B, 1C and 1D. As expected strong correlations were observed between semi quantitative mean BOLD and TOLD response (r2>0.93, P<0.01) as well as between BOLD and changes in T2* (ΔT2*; r2>0.90) or R2* (ΔR2*; r2>0.95). Both T2* and R2* are presented since mean R2* ≠ (mean T2*)-1. Tumor oxygenation is often reported as hypoxic fraction rather than mean signal response and fractions of tumor responding to oxygen breathing intervention are shown in Table 2. The apparent enhancing fraction depends on the threshold chosen and three different thresholds are presented, based on changes of 1, 1.5, and 2 times baseline (temporal) standard deviation on a voxel by voxel basis. BOLD responsive enhancing fractions were correlated irrespective of threshold above 1.5 SD: specifically, r2>0.95. Meanwhile, the threshold appears more critical for TOLD with r2>0.85 for 1.5 vs. 2 SD.
Figure 1.

Comparison of PET and Oxygen-sensitive MRI in a hypoxic Dunning prostate R3327-AT1 tumor. (A) [18F]FMISO dynamic activity for two tumor regions (central and peripheral). High [18F]FMISO activity was observed in the peripheral region at early time points, but decreased rapidly. The activity in the tumor center increased gradually over 90 mins. Both regions reached the “hypoxia threshold” suggested to be 120% of muscle. (B) Transaxial image slice selected from 3D PET data set to match MRI in (D). Ring enhancement was observed around the tumor periphery indicating perfusion related [18F]FMISO activity at 3 mins. post injection. Heat maps correspond to local radioactivity. (C) Accumulation of [18F]FMISO at 90 mins shows hypoxia in the tumor center. (D) This tumor was highly responsive to oxygen-breathing challenge as seen in the corresponding oxygen-sensitive MRI. Heat maps of the tumor are overlaid on anatomical image where the thigh muscle and bone marrow are clearly seen. Scale bar 1 cm.
Figure 2.

PET and Oxygen-hyphen sensitive MRI in a Dunning prostate R3327-AT1 tumor showing low [18F]FMISO uptake. A. [18F]FMISO activity in the peripheral region decreased initially and gradually reached the hypoxia threshold. The activity in the tumor center also increased gradually but never reached the hypoxia threshold. B. Ring enhancement showed perfusion related [18F]FMISO activity at 3 mins. C. Accumulation of [18F]FMISO at 90 mins indicated a ring of hypoxia in the peripheral region but no hypoxia in the tumor center. D. This tumor was relatively unresponsive to oxygen breathing challenge in terms of oxygen-sensitive MRI.
Table 1A.
MR parameter responses to oxygen breathing challenge and uptake of FMISO
| Tumor | BOLD (%Δ SI) | TOLD (%Δ SI) | T2* Air ms | T2* O2 ms | ΔT2* ms | R2* Air s-1 | R2* O2 s-1 | ΔR2* s-1 | F-MISO %ID | T/M 3 mins | T/M 90 mins |
|---|---|---|---|---|---|---|---|---|---|---|---|
| 1 | -0.87 | 0.36 | 27.79 | 27.22 | -0.57 | 47.71 | 48.54 | 0.83 | 0.34 | 1.07 | 1.19 |
| 3 | 5.67 | 3.55 | 26.82 | 28.67 | 1.85 | 61.76 | 58.30 | -3.46 | 0.35 | 1.90 | 1.16 |
| 4 | 5.12 | 2.47 | 18.10 | 19.05 | 0.95 | 76.29 | 72.08 | -4.21 | 0.40 | 1.71 | 1.45 |
| 5 | -2.21 | -1.44 | 31.05 | 30.60 | -0.45 | 41.03 | 42.50 | 1.47 | 0.39 | 1.26 | 1.25 |
| 6 | 4.04 | 2.97 | 31.71 | 33.05 | 1.34 | 38.24 | 36.28 | -1.96 | 0.38 | 1.98 | 1.34 |
| Mean | 2.35 | 1.58 | 27.09 | 27.72 | 0.62 | 53.01 | 51.54 | -1.47 | 0.37 | 1.58 | 1.32 |
| SD | 3.63 | 2.07 | 5.44 | 5.32 | 1.08 | 15.88 | 14.06 | 2.53 | 0.03 | 0.40 | 0.15 |
Table 1B.
Data based on mean of tumor periphery (outer 40%) across single image slice
| Tumor | BOLD (%Δ SI) | TOLD (%Δ SI) | T2* Air ms | T2* O2 ms | ΔT2* ms | R2* Air s-1 | R2* O2 s-1 | ΔR2* s-1 | FMISO %ID | T/M 3 mins | T/M 90 mins |
|---|---|---|---|---|---|---|---|---|---|---|---|
| 1 | 0.27 | 0.58 | 28.41 | 28.2 | -0.21 | 48.82 | 48.6 | -0.22 | 0.31 | 1.24 | 1.08 |
| 3 | 5.35 | 4.22 | 21.24 | 22.41 | 1.17 | 81.37 | 77.70 | -3.66 | 0.37 | 2.11 | 1.20 |
| 4 | 2.71 | 1.99 | 16.81 | 17.12 | 0.31 | 87.57 | 84.61 | -2.96 | 0.34 | 1.89 | 1.23 |
| 5 | -0.89 | -1.22 | 26.72 | 26.96 | 0.24 | 45.95 | 45.94 | -0.01 | 0.39 | 1.44 | 1.27 |
| 6 | 5.02 | 3.54 | 26.24 | 27.66 | 1.42 | 45.49 | 42.72 | -2.76 | 0.34 | 2.06 | 1.21 |
| Mean | 2.49 | 1.82 | 23.88 | 24.47 | 0.59 | 61.84 | 59.91 | -1.92 | 0.35 | 1.75 | 1.20 |
| SD | 2.78 | 2.21 | 4.77 | 4.71 | 0.68 | 20.81 | 19.65 | 1.68 | 0.03 | 0.39 | 0.07 |
Table 1C.
Data based on mean of tumor center (central 60%) across single image slice
| Tumor | BOLD (%Δ SI) | TOLD (%Δ SI) | T2* Air ms | T2* O2 ms | ΔT2* ms | R2* Air s-1 | R2* O2 s-1 | ΔR2* s-1 | F-MISO %ID | T/M 3 mins | T/M 90 mins |
|---|---|---|---|---|---|---|---|---|---|---|---|
| 1 | -3.21 | -0.14 | 26.56 | 25.28 | -1.28 | 45.52 | 48.41 | 2.89 | 0.42 | 0.69 | 1.47 |
| 3 | nd | nd | 35.23 | 38.13 | 2.9 | 32.60 | 29.63 | nd | 0.31 | 1.09 | 1.02 |
| 4 | 8.29 | 3.45 | 19.67 | 21.65 | 1.97 | 60.62 | 54.15 | -6.47 | 0.61 | 1.10 | 2.23 |
| 5 | -3.8 | -1.74 | 37.71 | 36.19 | -1.52 | 33.59 | 37.19 | 3.61 | 0.36 | 0.46 | 1.18 |
| 6 | 2.65 | 2.02 | 40.69 | 41.91 | 1.22 | 26.55 | 25.86 | -0.69 | 0.53 | 1.53 | 1.91 |
| Mean | 0.98 | 0.90 | 31.97 | 32.63 | 0.66 | 43.08 | 39.05 | -0.17 | 0.45 | 0.97 | 1.56 |
| SD | 5.68 | 2.30 | 8.66 | 8.71 | 1.97 | 13.08 | 12.06 | 4.60 | 0.12 | 0.41 | 0.50 |
Table 1D.
Data based on mean of muscle across single image slice
| Muscle | BOLD (% SI) | TOLD (% SI) | T2* Air ms | T2* O2 ms | ΔT2* ms | R2* Air s-1 | R2* O2 s-1 | ΔR2* s-1 | FMISO %ID |
|---|---|---|---|---|---|---|---|---|---|
| 1 | 5.07 | 1.57 | 17.01 | 17.98 | 0.98 | 60.71 | 57.2 | -3.5 | 0.29 |
| 3 | 3.15 | 2.14 | 15.27 | 15.8 | 0.53 | 66.87 | 64.77 | -2.1 | 0.30 |
| 4 | 1.63 | -0.52 | 16.61 | 16.87 | 0.26 | 61.56 | 60.75 | -0.81 | 0.27 |
| 5 | -0.34 | -2.88 | 16.95 | 16.83 | -0.12 | 59.78 | 60.26 | 0.48 | 0.31 |
| 6 | 2.21 | 3.2 | 10.99 | 10.93 | -0.06 | 105.22 | 104.53 | -0.7 | 0.28 |
| Mean | 2.34 | 0.70 | 15.37 | 15.68 | 0.32 | 70.83 | 69.50 | -1.33 | 0.29 |
| SD | 1.99 | 2.42 | 2.55 | 2.77 | 0.45 | 19.42 | 19.77 | 1.52 | 0.02 |
Table 2.
Fraction of tumor slice enhancing with respect to gas breathing challenge
| Tumor | TOLD | TOLD | TOLD | BOLD | BOLD | BOLD | PET |
|---|---|---|---|---|---|---|---|
|
| |||||||
| Threshold 1SD (%) | Threshold 1.5SD (%) | Threshold 2SD (%) | Threshold 1SD (%) | Threshold 1.5SD (%) | Threshold 2SD (%) | Hypoxic fraction (%) | |
| 1 | 26 | 12 | 6 | 40 | 25 | 17 | 49 |
| 2 | 14 | 4 | 2 | 37 | 23 | 14 | |
| 3 | 20 | 9 | 4 | 50 | 33 | 20 | 39 |
| 4 | 19 | 7 | 2 | 55 | 40 | 27 | 61 |
| 5 | 23 | 9 | 3 | 29 | 17 | 9 | 49 |
| 6 | 20 | 7 | 2 | 39 | 18 | 9 | 53 |
PET also showed distinct heterogeneity in each tumor with particular differences between central and peripheral regions, which evolved over 90 mins (Figures 1 and 2). The PET system failed during acquisition of data for Tumor #2, so that there were only 5 successful data sets. At early times there was relatively intense signal in the tumor periphery consistent with high perfusion and this declined over the first 15 mins to settle at about 1.2 (tumor to muscle: T/M). Meanwhile, the central regions increased continuously consistent with central hypoxia (Tumor #4; Figure 1). Tumors #5 (Figure 2) and #1 each showed very different behavior with much lower initial central tumor signal, which remained less than muscle even after 90 mins. Images of PET signal intensity at 3, 13 and 90 mins are presented for a central tumor slice to match the MRI TOLD, BOLD, and R2* measurements for all five tumors in Figure S1.
At early time points (e.g., 3 mins) correlations were found between relative [18F]FMISO activity and mean TOLD ΔSI(%), BOLD ΔSI (%), and ΔR2* on a global basis (r2>0.65) and for tumor periphery (all r2>0.75), while weaker correlations were found for central regions (r2 between 0.37 and 0.62) (Figure 3). At 90 mins post infusion peripheral tumor regions showed a highly consistent value T/M=1.2±0.07 and lack of correlation with MRI (Figure 3E-H). In central tumor regions comparison of [18F]FMISO activity and MRI showed correlative trends, however removing the obvious outlier (Tumor #3) yielded strong correlations between BOLD, TOLD, ΔR2* and PET (all r2>0.9).
Figure 3.

Correlations between MRI measurements and [18F]FMISO activity at two time points suggested the contribution from both perfusion and hypoxia conditions. Top panel: correlation of [18F]FMISO activity at 3 mins with MRI measurements (TOLD ΔSI(%), BOLD ΔSI(%), R2*(air) and R2*) of two tumor regions (center and periphery: Peri). Bottom panel: correlation of [18F]FMISO activity at 90 mins with MRI measurements.
MRI responsive enhancing fractions of the tumors based on TOLD and BOLD were calculated based on various thresholds (Table 2). Estimates of responsive fractions were found to be strongly influenced by the threshold, as presented for thresholds defined as changes greater than 1, 1.5 and 2 times the baseline standard deviation. As expected, the greater the threshold, the smaller the determined responsive fraction. While the absolute fractions change with threshold, the relative fractions were quite consistent with responsive TOLD fractions being correlated (r2>0.85). Meanwhile, the BOLD response was less sensitive to threshold with correlations r2>0.95 for 1, 1.5 or 2 SD. No obvious correlations were observed between BOLD and TOLD responsive fractions. Comparison of oxygen-sensitive MRI response fractions with PET hypoxic fraction indicated that both TOLD and BOLD showed significant correlations when 4 out of 5 tumors were considered, excluding the outlier (Figure 4A, 4B). In each case a larger hypoxic fraction associated with smaller oxygen responsive fraction: the correlation was much stronger for TOLD than BOLD.
Figure 4.
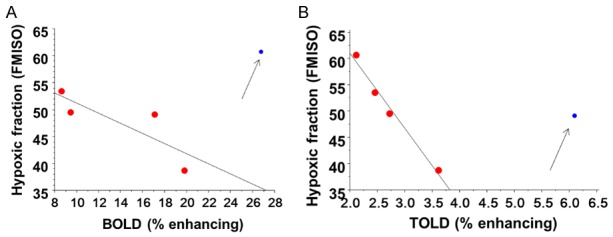
Responsive fractions compared with hypoxic fraction. Correlation of hypoxic fraction determined by 18FMISO PET in tumor slice with (A) T2*-weighted fraction of slice enhancing by more than 2SD with oxygen breathing challenge (r2>0.65) and (B) T1-weighted fraction of tumor image slice enhancing by more than 2SD with oxygen breathing challenge (r2>0.98). In each case correlation is based on 4 out of 5 tumors (red) with blue outlier neglected (Tumor #1 for TOLD and Tumor #4 for BOLD).
Discussion
We successfully achieved oxygen-sensitive MRI and hypoxia-sensitive PET in a group of Dunning prostate R3327-AT1 tumors growing subcutaneously in rats. Each approach revealed heterogeneity in the tumors. Strong correlations between MRI and early distribution of [18F]FMISO indicated that each method is strongly influenced by tumor perfusion. At later times correlations became more subtle, but strong inverse correlations were observed between hypoxic fraction determined by PET and enhancing fractions observed by oxygen sensitive MRI with respect to an oxygen gas breathing challenge.
BOLD and TOLD measurements matched our previous observations in AT1 tumors: baseline R2* during air breathing was similar [36], as was the response to oxygen breathing [8,42]. We also found that mean BOLD and TOLD measurements were correlated and BOLD magnitude was typically about double TOLD [36]. Both MRI and PET indicated tumor heterogeneity, notably well perfused tumor periphery, which is typical of the Dunning prostate R3327-AT1 tumor type [45-48]. Figure 3 (3 mins) indicates peripheral perfusion based on PET and the responsive regions for MRI. At 90 minutes the periphery shows relatively low [18F]FMISO essentially at the threshold of 1.2 and was unrelated to MRI. Meanwhile, the signal at the tumor center correlated closely with MRI for 4 out of 5 tumors. Three of 5 tumors showed T/M>1.2 indicating hypoxia. We found that higher [18F]FMISO corresponded with larger BOLD and TOLD response. This suggests that hypoxia is present (hence T/M>1.2), but that tumor oxygenation could be modified in response to oxygen breathing. Indeed, we have previously observed baseline hypoxia in this tumor type [8,46,49], which could be modified by oxygen breathing, as indicated by BOLD and TOLD responses.
The correlations of the magnitude of BOLD and TOLD responses with FMISO uptake are interesting, but spatial extent of uptake may be more meaningful, specifically, relating to the classic hypoxic fraction (Figure 4). Here, both BOLD and TOLD showed significant intuitive correlations: in 4 of 5 tumors a large enhancing area defined by MRI correlated with a smaller hypoxic fraction determined from FMISO PET. In each case an outlier was observed (Figure 4). Separate tumors were outliers in the BOLD and TOLD observations and in each case the fractional MR enhancement was larger than expected for the extent of FMISO uptake or conversely FMISO uptake was larger than expected. Discrepancies may arise from various factors. It is important to note that the PET data were acquired from 3D data sets thereby reflecting the whole tumor, whereas MRI was limited to a single slice through a central region. For the outliers other tumor regions may have been exceptionally hypoxic.
Use of an exogenous reporter may be subject to issues of delivery; specifically severe hypoxia is likely caused by lack of perfusion in which case the [18F]FMISO may not reach the target tissue effectively. It is noticeable that every tumor showed extensive peripheral [18F]FMISO at early time points (3 minutes in Figures 1 and 2 and 13 minutes in Figure S1), but in some cases central perfusion was exceptionally low (Figure 2). At 90 minutes 4 of 5 tumors showed signal throughout the tumor, albeit with highly variable concentration. However, Tumor #5 (Figures 2 and S1) showed minimal uptake in the tumor center. This may reflect lack of hypoxia, but appears to be consistent with the low perfusion. Indeed, BOLD and TOLD response was particular low implying lack of vasculature and hypoxia. This suggests a need to account for perfusion, as widely recognized in the need to consider both early and late time points [35,50]. Likewise, O’Connor et al. have shown that consideration of the uptake of pimonidazole (a nitroimidazole widely used for immunohistological detection of hypoxia) correlates better with TOLD measurements in some tumors, if poorly perfused regions are identified by dynamic contrast enhanced MRI and excluded from consideration [22]. Here, we infused pimonidazole in some rats and staining emphasized predominant central hypoxia, though we have insufficient data to seek correlations (Figure S2). Exogenous reporter agents are subject to delivery to cells and uptake. Indeed, it is reported that uptake of [18F]FMISO was limited in tumors following vascular disruption based on DMXAA, thereby reflecting reduced perfusion as opposed to increased hypoxia [51].
We chose [18F]FMISO as the PET reporter for hypoxia, since it has been most widely used in both pre-clinical and human investigations [3,52]. However, we recognize ongoing efforts to develop enhanced agents and several reports comparing the relative efficacy to detect hypoxia in tissues [53]. FMISO has an octanol-water partition coefficient around 0.4 leading to extensive initial uptake in normal tissues, and hence relatively low contrast [3]. 18F-2-(2-nitro-1H-imidazol-1-yl)-N-(3,3,3-trifluoropropyl)-acetamide ([18F]EF3) is more lipophilic and might be expected to partition better into cells, but was reported to not be superior to FMISO [54]. 18F-2-(2-nitro-1H-imidazol-1-yl)-N-(2,2,3,3,3-pentafluoropropyl)-acetamide ([18F]EF5) is still more lipophilic and has been tested in clinical trials [55,56], but its preparation is more complex. A head to head comparison of several fluorinated nitroimidazoles indicated more rapid clearance for the relatively hydrophilic agents 18F-2-(4-((2-nitro-1H-imidazol-1-yl)methyl)-1H-1,2,3-triazol-1-yl)propan-1-ol ([18F]HX4) and 18F-fluoroazomycin arabinoside ([18F]FAZA) vs. [18F]FMISO in rhabdomyosarcomas, suggesting potential benefit for determining hypoxia with higher contrast at earlier times [57]. Chelated metal ions promise facile preparation of radiolabeled reporter agents [58,59]. Copper-diacetylbis(N4-methylthiosemicarbazone) (Cu-ATSM) has been evaluated extensively, but cell line dependent discrepancies in biodistribution have been reported [60]. A study comparing several agents showed higher uptake of 64Cu-diacetyl-bis(N4-methylsemicarbazone) [64Cu]Cu-ATSM]) in an SQ20b mouse tumor, but a lack of correlation with the immunohistochemistry hypoxia markers pimonidazole or endogenous CAIX [61]. Meanwhile, the three fluorinated agents [18F]FMISO], [18F]HX4, and [18F]FAZA showed similar tumor distributions, which were consistent with immunohistochemistry. There is also choice in nitroimidazole for immunohistological validation with pimonidazole and CCI-103F being readily available and widely used including pulse chase investigations to allow assessment of changes in hypoxia [37,42]. We selected pimonidazole for the current study, since it is much easier to use than the exceedingly hydrophobic CCI-103F, which must be administered in peanut oil IP [42].
It is of course important to note that FMISO uptake is indicative of hypoxia, whereas oxygen sensitive MRI is likely more closely related with the ability to manipulate tumor oxygenation. Our past studies suggest that tumors which show a very small BOLD or TOLD response are hypoxic and cannot be modulated by the oxygen breathing challenge [8,62]. Nonetheless the correlations observed here do suggest that oxygen-sensitive MRI is related to tumor hypoxia. The correlations observed between BOLD, TOLD and [18F]FMISO uptake provide further impetus for the use of non-invasive oxygen sensitive MRI to evaluate tumor oxygenation.
Acknowledgements
We are grateful to Drs. Padmakar Kulkarni, Nikolai Slavine, Matthew A. Lewis, and Zhongwei Zhang for valuable discussions. We also thank Rashmi P. R. Reddy, Saleh Ramezani, Joshua Gunpat and Dr. Li Li for tumor implantation and undertaking immunohistochemistry. This research was supported in part by CPRIT-IIRA RP140285, NCI R01 CA139043 and infrastructure of the Small Animal Imaging Research Program (SAIRP), U24 CA126608, BTRP P41RR02584 and Simmons Cancer Center and P30 CA142543.
Disclosure of conflict of interest
None.
Supporting Information
References
- 1.Vaupel P, Mayer A. Hypoxia in cancer: significance and impact on clinical outcome. Cancer Metast Rev. 2007;26:225–239. doi: 10.1007/s10555-007-9055-1. [DOI] [PubMed] [Google Scholar]
- 2.Tatum JL, Kelloff GJ, Gillies RJ, Arbeit JM, Brown JM, Chao KS, Chapman JD, Eckelman WC, Fyles AW, Giaccia AJ, Hill RP, Koch CJ, Krishna MC, Krohn KA, Lewis JS, Mason RP, Melillo G, Padhani AR, Powis G, Rajendran JG, Reba R, Robinson SP, Semenza GL, Swartz HM, Vaupel P, Yang D, Croft B, Hoffman J, Liu GY, Stone H, Sullivan D. Hypoxia: importance in tumor biology, noninvasive measurement by imaging, and value of its measurement in the management of cancer therapy. Int J Radiat Biol. 2006;82:699–757. doi: 10.1080/09553000601002324. [DOI] [PubMed] [Google Scholar]
- 3.Krohn KA, Link JM, Mason RP. Molecular imaging of hypoxia. J Nucl Med. 2008;49:129S–148S. doi: 10.2967/jnumed.107.045914. [DOI] [PubMed] [Google Scholar]
- 4.Mason RP, Zhao D, Pacheco-Torres J, Cui W, Kodibagkar VD, Gulaka PK, Hao G, Thorpe P, Hahn EW, Peschke P. Multimodality imaging of hypoxia in preclinical settings. Q J Nucl Med Mol Imaging. 2010;54:259–280. [PMC free article] [PubMed] [Google Scholar]
- 5.Colliez F, Gallez B, Jordan BF. Assessing tumor oxygenation for predicting outcome in radiation oncology: a review of studies correlating tumor hypoxic status and outcome in the preclinical and clinical settings. Front Oncol. 2017;7:1–10. doi: 10.3389/fonc.2017.00010. [DOI] [PMC free article] [PubMed] [Google Scholar]
- 6.Fleming IN, Manavaki R, Blower PJ, West C, Williams KJ, Harris AL, Domarkas J, Lord S, Baldry C, Gilbert FJ. Imaging tumour hypoxia with positron emission tomography. Br J Cancer. 2015;112:238–250. doi: 10.1038/bjc.2014.610. [DOI] [PMC free article] [PubMed] [Google Scholar]
- 7.O’Connor JP, Naish JH, Jackson A, Waterton JC, Watson Y, Cheung S, Buckley DL, McGrath DM, Buonaccorsi GA, Mills SJ, Roberts C, Jayson GC, Parker GJ. Comparison of normal tissue R-1 and R-2* modulation by oxygen and carbogen. Magn Reson Med. 2009;61:75–83. doi: 10.1002/mrm.21815. [DOI] [PubMed] [Google Scholar]
- 8.Hallac RR, Zhou H, Pidikiti R, Song K, Stojadinovic S, Zhao D, Solberg T, Peschke P, Mason RP. Correlations of noninvasive BOLD and TOLD MRI with pO2 and relevance to tumor radiation response. Magn Reson Med. 2014;71:1863–1873. doi: 10.1002/mrm.24846. [DOI] [PMC free article] [PubMed] [Google Scholar]
- 9.Safronova MM, Colliez F, Magat J, Joudiou N, Jordan BF, Raftopoulos C, Gallez B, Duprez T. Mapping of global R1 and R2* values versus lipids R1 values as potential markers of hypoxia in human glial tumors: a feasibility study. Magn Reson Imaging. 2016;34:105–113. doi: 10.1016/j.mri.2015.10.021. [DOI] [PubMed] [Google Scholar]
- 10.Peschke P, Hahn EW, Wenz F, Lohr F, Braunschweig F, Wolber G, Zuna I, Wannenmacher M. Differential sensitivity of three sublines of the rat dunning prostate tumor system R3327 to radiation and/or local tumor hyperthermia. Radiat Res. 1998;150:423–430. [PubMed] [Google Scholar]
- 11.Glowa C, Karger CP, Brons S, Zhao D, Mason RP, Huber PE, Debus J, Peschke P. Carbon ion radiotherapy decreases the impact of tumor heterogeneity on radiation response in experimental prostate tumors. Cancer Lett. 2016;378:97–103. doi: 10.1016/j.canlet.2016.05.013. [DOI] [PMC free article] [PubMed] [Google Scholar]
- 12.Semenza GL. Targeting HIF-1 for cancer therapy. Nat Rev Cancer. 2003;3:721–732. doi: 10.1038/nrc1187. [DOI] [PubMed] [Google Scholar]
- 13.Horsman MR, Mortensen LS, Petersen JB, Busk M, Overgaard J. Imaging hypoxia to improve radiotherapy outcome. Nat Rev Clin Oncol. 2012;9:674–687. doi: 10.1038/nrclinonc.2012.171. [DOI] [PubMed] [Google Scholar]
- 14.Zhou H, Hallac RR, Lopez RR, Denney R, MacDonough MT, Li L, Liu L, Graves EE, Trawick ML, Pinney KG, Mason RP. Evaluation of tumor ischemia in response to an indole-based vascular disrupting agent using BLI and 19F MRI. Am J Nucl Med Mol Imaging. 2015;5:143–153. [PMC free article] [PubMed] [Google Scholar]
- 15.Zhao D, Jiang L, Mason RP. Measuring changes in tumor oxygenation. Methods Enzymol. 2004;386:378–418. doi: 10.1016/S0076-6879(04)86018-X. [DOI] [PubMed] [Google Scholar]
- 16.Kodibagkar VD, Wang X, Pacheco-Torres J, Gulaka P, Mason RP. Proton imaging of siloxanes to map tissue oxygenation levels (PISTOL): a tool for quantitative tissue oximetry. NMR Biomed. 2008;21:899–907. doi: 10.1002/nbm.1279. [DOI] [PMC free article] [PubMed] [Google Scholar]
- 17.Swartz HM, Dunn JF. Measurements of oxygen in tissues: overview and perspectives on methods. In: Dunn JF, Swartz HM, editors. Oxygen Transport to Tissue XXIV. New York: Kluwer Academic; 2003. pp. 1–12. [DOI] [PubMed] [Google Scholar]
- 18.Pacheco-Torres J, López-Larrubia P, Ballesteros P, Cerdán S. Imaging tumor hypoxia by magnetic resonance methods. NMR Biomed. 2011;24:1–16. doi: 10.1002/nbm.1558. [DOI] [PubMed] [Google Scholar]
- 19.Zimny M, Gagel B, DiMartino E, Hamacher K, Coenen HH, Westhofen M, Eble M, Buell U, Reinartz P. FDG - a marker of tumour hypoxia? A comparison with [F-18] fluoromisonidazole and pO(2)-polarography in metastatic head and neck cancer. Eur J Nucl Med Mol Imag. 2006;33:1426–1431. doi: 10.1007/s00259-006-0175-6. [DOI] [PubMed] [Google Scholar]
- 20.Xu ZY, Li XF, Zou HY, Sun XL, Shen BZ. F-18-Fluoromisonidazole in tumor hypoxia imaging. Oncotarget. 2017;8:94969–94979. doi: 10.18632/oncotarget.21662. [DOI] [PMC free article] [PubMed] [Google Scholar]
- 21.Howe FA, Robinson SP, McIntyre DJ, Stubbs M, Griffiths JR. Issues in flow and oxygenation dependent contrast (FLOOD) imaging of tumours. NMR Biomed. 2001;14:497–506. doi: 10.1002/nbm.716. [DOI] [PubMed] [Google Scholar]
- 22.O’Connor JP, Boult JK, Jamin Y, Babur M, Finegan KG, Williams KJ, Little RA, Jackson A, Parker GJ, Reynolds AR, Waterton JC, Robinson SP. Oxygen-enhanced MRI accurately identifies, quantifies, and maps tumor hypoxia in preclinical cancer models. Cancer Res. 2016;76:787–795. doi: 10.1158/0008-5472.CAN-15-2062. [DOI] [PMC free article] [PubMed] [Google Scholar]
- 23.Thulborn KR, Waterton JC, Matthews PM, Radda GK. Oxygenation dependence of the transverse relaxation-time of water protons in whole-blood at high-field. Biochim Biophys Acta. 1982;714:265–270. doi: 10.1016/0304-4165(82)90333-6. [DOI] [PubMed] [Google Scholar]
- 24.Baudelet C, Gallez B. How does blood oxygen level-dependent (BOLD) contrast correlate with oxygen partial pressure (pO2) inside tumors? Magn Reson Med. 2002;48:980–986. doi: 10.1002/mrm.10318. [DOI] [PubMed] [Google Scholar]
- 25.Al-Hallaq HA, River JN, Zamora M, Oikawa H, Karczmar GS. Correlation of magnetic resonance and oxygen microelectrode measurements of carbogen-induced changes in tumor oxygenation. Int J Radiat Oncol Biol Phys. 1998;41:151–159. doi: 10.1016/s0360-3016(98)00038-8. [DOI] [PubMed] [Google Scholar]
- 26.Robinson SP, Howe FA, Rodrigues LM, Stubbs M, Griffiths JR. Magnetic resonance imaging techniques for monitoring changes in tumor oxygenation and blood flow. Semin Radiat Oncol. 1998;8:198–207. doi: 10.1016/s1053-4296(98)80045-3. [DOI] [PubMed] [Google Scholar]
- 27.Padhani A, Krohn K, Lewis J, Alber M. Imaging oxygenation of human tumours. Eur Radiol. 2007;17:861–872. doi: 10.1007/s00330-006-0431-y. [DOI] [PMC free article] [PubMed] [Google Scholar]
- 28.Preibisch C, Shi KY, Kluge A, Lukas M, Wiestler B, Gottler J, Gempt J, Ringel F, Al Jaberi M, Schlegel J, Meyer B, Zimmer C, Pyka T, Forster S. Characterizing hypoxia in human glioma: a simultaneous multimodal MRI and PET study. NMR Biomed. 2017:30. doi: 10.1002/nbm.3775. [DOI] [PubMed] [Google Scholar]
- 29.Wiedenmann N, Bunea H, Rischke HC, Bunea A, Majerus L, Bielak L, Protopopov A, Ludwig U, Buchert M, Stoykow C, Nicolay NH, Weber WA, Mix M, Meyer PT, Hennig J, Bock M, Grosu AL. Effect of radiochemotherapy on T2*MRI in HNSCC and its relation to FMISO PET derived hypoxia and FDG PET. Radiat Oncol. 2018;13:159. doi: 10.1186/s13014-018-1103-1. [DOI] [PMC free article] [PubMed] [Google Scholar]
- 30.Matsumoto K, Bernardo M, Subramanian S, Choyke P, Mitchell JB, Krishna MC, Lizak MJ. MR assessment of changes of tumor in response to hyperbaric oxygen treatment. Magn Reson Med. 2006;56:240–246. doi: 10.1002/mrm.20961. [DOI] [PubMed] [Google Scholar]
- 31.Beeman SC, Shui YB, Perez-Torres CJ, Engelbach JA, Ackerman JJ, Garbow JR. O2-sensitive MRI distinguishes brain tumor versus radiation necrosis in murine models. Magn Reson Med. 2015;75:2442–2447. doi: 10.1002/mrm.25821. [DOI] [PMC free article] [PubMed] [Google Scholar]
- 32.Winter JD, Akens MK, Cheng HL. Quantitative MRI assessment of VX2 tumour oxygenation changes in response to hyperoxia and hypercapnia. Phys Med Biol. 2011;56:1225. doi: 10.1088/0031-9155/56/5/001. [DOI] [PubMed] [Google Scholar]
- 33.Avni R, Golani O, Akselrod-Ballin A, Cohen Y, Biton I, Garbow JR, Neeman M. MR imaging-derived oxygenhemoglobin dissociation curves and fetal-placental oxygenhemoglobin affinities. Radiology. 2016;280:68–77. doi: 10.1148/radiol.2015150721. [DOI] [PMC free article] [PubMed] [Google Scholar]
- 34.Burrell JS, Walker-Samuel S, Baker LC, Boult JK, Jamin Y, Halliday J, Waterton JC, Robinson SP. Exploring ΔR2* and ΔR1 as imaging biomarkers of tumor oxygenation. J Magn Reson Imaging. 2013;38:429–434. doi: 10.1002/jmri.23987. [DOI] [PubMed] [Google Scholar]
- 35.Mena-Romano P, Cheng CX, Glowa C, Peschke P, Pan L, Haberkorn U, Dimitrakopoulou-Strauss A, Karger CP. Measurement of hypoxia-related parameters in three sublines of a rat prostate carcinoma using dynamic F-18-FMISO-PET-CT and quantitative histology. Am J Nucl Med Mol Imaging. 2015;5:348–362. [PMC free article] [PubMed] [Google Scholar]
- 36.Zhao D, Pacheco-Torres J, Hallac RR, White D, Peschke P, Cerdán S, Mason RP. Dynamic oxygen challenge evaluated by NMR T1 and T2* -- insights into tumor oxygenation. NMR Biomed. 2015;28:937–947. doi: 10.1002/nbm.3325. [DOI] [PMC free article] [PubMed] [Google Scholar]
- 37.Baker LC, Boult JK, Jamin Y, Gilmour LD, Walker-Samuel S, Burrell JS, Ashcroft M, Howe FA, Griffiths JR, Raleigh JA, van der Kogel AJ, Robinson SP. Evaluation and immunohistochemical qualification of carbogen-induced R2* as a noninvasive imaging biomarker of improved tumor oxygenation. Int J Radiat Oncol Biol Phys. 2013;87:160–167. doi: 10.1016/j.ijrobp.2013.04.051. [DOI] [PubMed] [Google Scholar]
- 38.Dallaudiere B, Hummel V, Hess A, Lincot J, Preux PM, Maubon A, Monteil J. Tumoral hypoxia in osteosarcoma in rats: preliminary study of blood oxygenation level-dependent functional MRI and F-18-misonidazole PET/CT with diffusion-weighted MRI correlation. Am J Roentgenol. 2013;200:W187–W192. doi: 10.2214/AJR.12.8969. [DOI] [PubMed] [Google Scholar]
- 39.Tran LB, Bol A, Labar D, Karroum O, Bol V, Jordan B, Gregoire V, Gallez B. Potential role of hypoxia imaging using F-18-FAZA PET to guide hypoxia-driven interventions (carbogen breathing or dose escalation) in radiation therapy. Radiother Oncol. 2014;113:204–209. doi: 10.1016/j.radonc.2014.09.016. [DOI] [PubMed] [Google Scholar]
- 40.Cao-Pham TT, Tran LB, Colliez F, Joudiou N, El Bachiri S, Gregoire V, Leveque P, Gallez B, Jordan BF. Monitoring tumor response to carbogen breathing by oxygen-sensitive magnetic resonance parameters to predict the outcome of radiation therapy: a preclinical study. Int J Radiat Oncol Biol Phys. 2016;96:149–160. doi: 10.1016/j.ijrobp.2016.04.029. [DOI] [PubMed] [Google Scholar]
- 41.Isaacs J, Heston W, Weissman R, Coffey D. Animal models of the hormone sensitive and insensitive prostatic adenocarcinomas, Dunning R3327-H, -HI and AT. Cancer Res. 1978;38:4353–4359. [PubMed] [Google Scholar]
- 42.White DA, Zhang Z, Li L, Gerberich J, Stojadinovic S, Peschke P, Mason RP. Developing oxygen-enhanced magnetic resonance imaging as a prognostic biomarker of radiation response. Cancer Lett. 2016;380:69–77. doi: 10.1016/j.canlet.2016.06.003. [DOI] [PMC free article] [PubMed] [Google Scholar]
- 43.Riss PJ, Ferrari V, Bielik R, Canales-Candela R, Smith R, Aigbirhio FI. Synthesis of [18F] Fluoromisonidazole (1-(2-Hydroxy-3-[18F] Fluoropropyl)-2-Nitroimidazole, [18F] FMISO) In: Scott PJH, Hockley BG, editors. Radiochemical Syntheses: Radiopharmaceuticals for Positron Emission Tomography. John Wiley & Sons, Inc; 2012. pp. 41–49. [Google Scholar]
- 44.Zhou H, Zhang Z, Denney R, Williams JS, Gerberich J, Stojadinovic S, Saha D, Shelton JM, Mason RP. Tumor physiological changes during hypofractionated stereotactic body radiation therapy assessed using multi-parametric magnetic resonance imaging. Oncotarget. 2017;8:37464–37477. doi: 10.18632/oncotarget.16395. [DOI] [PMC free article] [PubMed] [Google Scholar]
- 45.Mason RP, Antich PP, Babcock EE, Constantinescu A, Peschke P, Hahn EW. Non-invasive determination of tumor oxygen tension and local variation with growth. Int J Radiat Oncol Biol Phys. 1994;29:95–103. doi: 10.1016/0360-3016(94)90231-3. [DOI] [PubMed] [Google Scholar]
- 46.Bourke VA, Zhao D, Gilio J, Chang CH, Jiang L, Hahn EW, Mason RP. Correlation of radiation response with tumor oxygenation in the dunning prostate R3327-AT1 tumor. Int J Radiat Oncol Biol Phys. 2007;67:1179–1186. doi: 10.1016/j.ijrobp.2006.11.037. [DOI] [PMC free article] [PubMed] [Google Scholar]
- 47.Jiang L, Weatherall PT, McColl RW, Tripathy D, Mason RP. Blood oxygenation level-dependent (BOLD) contrast magnetic resonance imaging (MRI) for prediction of breast cancer chemotherapy response: a pilot study. J Magn Reson Imaging. 2013;37:1083–1092. doi: 10.1002/jmri.23891. [DOI] [PubMed] [Google Scholar]
- 48.Eble MJ, Wenz F, Bachert KB, Lohr F, Peschke P. Invasive pO2 histography in Dunning prostate tumor R-3327-AT1 and R3327-HI: correlation with 31P-MR spectroscopy and in-vivo radiosensitivity. In: Vaupel PW, Kelleher DK, Günderoth M, editors. Tumor Oxygenation. Stuttgart: Gustav Fischer; 1995. pp. 95–105. [Google Scholar]
- 49.Zhao D, Ran S, Constantinescu A, Hahn EW, Mason RP. Tumor oxygen dynamics: correlation of in vivo MRI with histological findings. Neoplasia. 2003;5:308–318. doi: 10.1016/S1476-5586(03)80024-6. [DOI] [PMC free article] [PubMed] [Google Scholar]
- 50.Kelada OJ, Carlson DJ. Molecular imaging of tumor hypoxia with positron emission tomography. Radiat Res. 2014;181:335–349. doi: 10.1667/RR13590.1. [DOI] [PMC free article] [PubMed] [Google Scholar]
- 51.Oehler C, O’Donoghue JA, Russell J, Zanzonico P, Lorenzen S, Ling CC, Carlin S. F-18-fluromisonidazole PET imaging as a biomarker for the response to 5,6-dimethylxanthenone-4-acetic acid in colorectal xenograft tumors. J Nucl Med. 2011;52:437–444. doi: 10.2967/jnumed.110.081372. [DOI] [PMC free article] [PubMed] [Google Scholar]
- 52.Sachpekidis C, Thieke C, Askoxylakis V, Nicolay NH, Huber PE, Thomas M, Dimitrakopoulou G, Debus J, Haberkorn U, Dimitrakopoulou-Strauss A. Combined use of F-18-FDG and F-18-FMISO in unresectable non-small cell lung cancer patients planned for radiotherapy: a dynamic PET/CT study. Am J Nucl Med Molec Imaging. 2015;5:127–142. [PMC free article] [PubMed] [Google Scholar]
- 53.Davidson CQ, Phenix CP, Tai TC, Khaper N, Lees SJ. Searching for novel PET radiotracers: imaging cardiac perfusion, metabolism and inflammation. Am J Nucl Med Molec Imaging. 2018;8:200–227. [PMC free article] [PubMed] [Google Scholar]
- 54.Dubois L, Landuyt W, Cloetens L, Bol A, Bormans G, Haustermans K, Labar D, Nuyts J, Gregoire V, Mortelmans L. [F-18] EF3 is not superior to [F-18] FMISO for PET-based hypoxia evaluation as measured in a rat rhabdomyosarcoma tumour model. Eur J Nucl Med Mol Imaging. 2009;36:209–218. doi: 10.1007/s00259-008-0907-x. [DOI] [PubMed] [Google Scholar]
- 55.Evans SM, Judy KD, Dunphy I, Jenkins WT, Nelson PT, Collins R, Wileyto EP, Jenkins K, Hahn SM, Stevens CW, Judkins AR, Phillips P, Geoerger B, Koch CJ. Comparative measurements of hypoxia in human brain tumors using needle electrodes and EF5 binding. Cancer Res. 2004;64:1886–1892. doi: 10.1158/0008-5472.can-03-2424. [DOI] [PubMed] [Google Scholar]
- 56.Qian YS, Von Eyben R, Liu YF, Chin FT, Miao Z, Apte S, Carter JN, Binkley MS, Pollom EL, Harris JP, Prionas ND, Kissel M, Simmons A, Diehn M, Shultz DB, Brown JM, Maxim PG, Koong AC, Graves EE, Loo BW. F-18-EF5 PET-based imageable hypoxia predicts local recurrence in tumors treated with highly conformal radiation therapy. Int J Radiat Oncol Biol Phys. 2018;102:1183–1192. doi: 10.1016/j.ijrobp.2018.03.045. [DOI] [PubMed] [Google Scholar]
- 57.Peeters SG, Zegers CM, Lieuwes N, Van Elmpt W, Eriksson J, Van Dongen GA, Dubois L, Lambin P. A comparative study of the hypoxia PET tracers [18F]HX4, [18F]FAZA, and [18F]FMISO in a preclinical tumor model. Int J Radiat Oncol Biol Phys. 2015;91:351–359. doi: 10.1016/j.ijrobp.2014.09.045. [DOI] [PubMed] [Google Scholar]
- 58.Wu YK, Hao GY, Ramezani S, Saha D, Zhao DW, Sun XK, Sherry AD. [Ga-68]-HP-DO3A-nitroimidazole: a promising agent for PET detection of tumor hypoxia. Contrast Media Mol Imaging. 2015;10:465–472. doi: 10.1002/cmmi.1649. [DOI] [PMC free article] [PubMed] [Google Scholar]
- 59.Dehdashti F, Mintun MA, Lewis JS, Bradley J, Govinda R, Laforest R, Welch MJ, Siegel BA. In vivo assessment of tumor hypoxia in lung cancer with (60)Cu-ATSM. Eur J Nucl Med Mol Imaging. 2003;30:844–850. doi: 10.1007/s00259-003-1130-4. [DOI] [PubMed] [Google Scholar]
- 60.O’Donoghue JA, Zanzonico P, Pugachev A, Wen BX, Smith-Jones P, Cai SD, Burnazi E, Finn RD, Burgman P, Ruan S, Lewis JS, Welch MJ, Ling CC, Humm JL. Assessment of regional tumor hypoxia using F-18-fluoromisonidazole and Cu-64(II)-diacetyl-bis(N4-methylthiosemicarbazone) positron emission tomography: comparative study featuring microPET imaging, Po-2 probe measurement, autoradiography, and fluorescent microscopy in the R3327-AT and FaDu rat tumor models. Int J Radiat Oncol Biol Phys. 2005;61:1493–1502. doi: 10.1016/j.ijrobp.2004.12.057. [DOI] [PubMed] [Google Scholar]
- 61.Carlin S, Zhang HW, Reese M, Ramos NN, Chen Q, Ricketts SA. A comparison of the imaging characteristics and microregional distribution of 4 hypoxia PET tracers. J Nucl Med. 2014;55:515–521. doi: 10.2967/jnumed.113.126615. [DOI] [PMC free article] [PubMed] [Google Scholar]
- 62.Zhao D, Jiang L, Hahn EW, Mason RP. Comparison of 1H blood oxygen level-dependent (BOLD) and 19F MRI to investigate tumor oxygenation. Magn Reson Med. 2009;62:357–364. doi: 10.1002/mrm.22020. [DOI] [PMC free article] [PubMed] [Google Scholar]
Associated Data
This section collects any data citations, data availability statements, or supplementary materials included in this article.