Abstract
Phytochemicals are inevitable part of human civilization. It is impossible to say exactly when menfolk started to take plant portions to cure various diseases. Phytochemical investigation of diethyl ether and ethanol extracts of Magnolia grandiflora green seed cones has been carried out. Extraction, isolation, and identification of the phytochemicals were carried out. Structures were determined by various analytical methods including extensive nuclear magnetic resonance, gas chromatography‐mass spectroscopy, and X‐ray crystallographic analyses. Structures of the three compounds viz. 5,5′‐diallyl‐[1,1′‐biphenyl]‐2,2′‐diol (I), 3′,5‐diallyl‐[1,1′‐biphenyl]‐2,4′‐diol (II), and (3S,3aS,8S,9aS,10aR,10bS,E)‐8‐hydroxy‐3,6,9a‐trimethyl‐3a,4,5,8,9,9a,10a,10b‐octahydrooxireno[2′,3′:9,10]cyclodeca[1,2‐b]furan‐2(3H)‐one (III) were confirmed by X‐ray crystallographic analysis. GS‐MS studies of the isolated oil, eluted with hexanes, revealed the presence of eight compounds including two highly bio‐privileged molecules 5,5′‐diallyl‐2′‐methoxy‐[1,1′‐biphenyl]‐2‐ol (IV) and 1‐(4‐isopropylbenzyl)‐1,3‐dihydro‐2H‐benzo[d]imidazol‐2‐one (V). The druggability of the five compounds has also been determined by in silico studies. The isolated compounds and/or their semi‐synthetic products may find application in natural drug development research.
Keywords: druggability, gas chromatography‐mass spectroscopy, Magnolia grandiflora, phytoceutical, phytochemical, X‐ray crystallography
1. INTRODUCTION
Medicinal plants are being used for thousands of years as remedies for human ailments because of the presence of numerous phytoceuticals. In practice, the term “phytochemicals” refers to a wide variety of compounds that are found in plants and validate health benefits on human/animal. “Phyto” is a Greek word that indicates “plant.” Accordingly, chemicals that are derived from plants are called “phytochemicals.” Phytochemicals can be broadly categorized into five major categories such as phytoceuticals, nutraceuticals, addictives (narcotics), toxins, and biologically inactive compounds. Out of these five categories, phytoceuticals and nutraceuticals are pharmacologically/medicinally relevant molecules that produce therapeutic effects (positive health effect); addictives have negative health effects, whereas toxins cause fatal health effect (Bandyopadhyay, 2014a,2014b). The utilization of natural products and/or their novel cores, in order to discover and develop the final drug entity, is still an interesting and highly promising area of drug discovery research. For example, in the area of cancer, from around the 1940s to the end of 2014, 175 small molecules were approved by the US Federal Drug Administration (FDA) or its similar organizations worldwide. Out of these 175 small molecule anticancer drugs, 131 (74.85%) are completely nonsynthetic molecules. Presently, about 25% of medicines are directly derived from nature. About 61% of new chemical entity (NCE) can be traced to a natural product origin. In certain therapeutic areas, this impact is even higher. For example, about 75% of anticancer drugs and 78% of antibacterial drugs are either natural products or chemically modified natural products or semi‐synthetic natural products. The rapidly evolving recognition that a significant number of drugs/leads/hits are produced by Mother Nature, and therefore it is considered that this area of natural resources should be expanded significantly (Giddings & Newman, 2015a,2015b,2015c; Newman & Cragg, 2016). Accordingly, chemical investigation of natural compounds is one of the most reliable and traditional routes to discover new and novel natural drugs. Magnolias (belong to the family Magnoliaceae) are known worldwide for their beautiful flowers with intense fragrance. Many species of the genus Magnolia are grown around the world, and out of all these different species, Magnolia grandiflora is the most attractive one because of its large size, gorgeous color, and fragrance (Avonto, Chittiboyina, Sadrieh, Vukmanovic, & Khan, 2018; Ding et al., 2018; Lata et al., 2017). This article deals with the phytochemical investigation of the diethyl ether and ethanol extracts derived from the Magnolia grandiflora green seed cones. Along with other compounds, five medicinally privileged compounds have been isolated and identified as drug‐like molecules through in silico evaluation. Appropriate chemical modifications of these molecules aiming to synthesize suitable semi‐synthetic compounds for drug–protein interactions might lead to develop novel therapeutics. These compounds (Figure 1) were characterized through various analytical techniques including gas chromatography‐mass spectroscopy (GC‐MS) and X‐ray crystallographic analyses.
Figure 1.
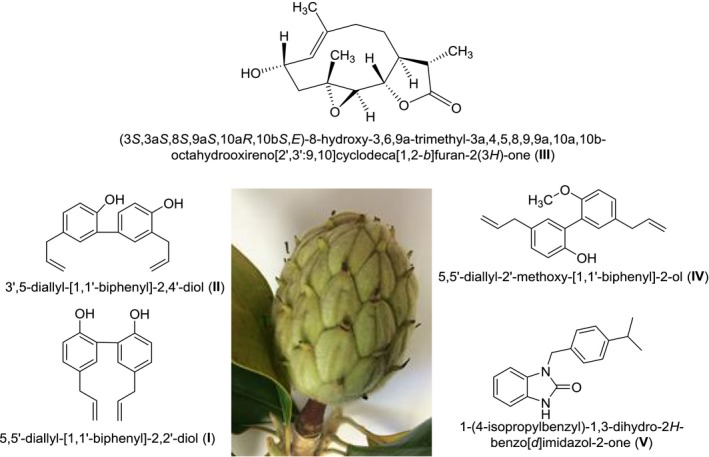
Compounds obtained from Magnolia grandiflora green seed cones
2. MATERIALS AND METHODS
2.1. General experimental
Melting points were determined in a DigiMelt MPA 160 (Stanford Research Systems, USA) digital melting point apparatus. FT‐IR spectra were recorded on a Bruker Alpha modular Platinum‐ATR FT‐IR spectrometer with OPUS software, using the samples directly (neat) without making pallets. 1H‐NMR (600 MHz) and 13C‐NMR (150 MHz) spectra were obtained at room temperature with Bruker superconducting Ultrashield Plus 600 MHz NMR spectrometer with central field 14.09 T, coil inductance 89.1 H, and magnetic energy 1,127.2 kJ using CDCl3 or d6‐DMSO as solvent. The GC‐MS analysis of the oil was carried out by MassHunter gas chromatography‐mass spectrometer (Agilent Technologies, Inc.) using the MS firmware version 7.02.22. The column information is as follows: column‐HP‐5MS UI; length = 30 meters; diameter = 0.25 (mm); film thickness = 1.00 (μm); carrier gas was helium. X‐ray crystallographic studies were conducted in SuperNova, Dual, Cu at zero, Atlas diffractometer with Mo Kα radiation (λ = 0.71073 Å) under the program CrysAlisPro (Version 1.171.36.32 Agilent Technologies, 2013). The same program was used to refine the cell dimensions and for data reduction. The computer programs used were CrysAlis PRO, Agilent Technologies, version 1.171.36.32 (release 02–08‐2013 CrysAlis171.NET) (compiled Aug 02 2013), SHELXS2014/7, SHELXL2014/7 (Sheldrick, 2015), and SHELXTL v6.10 (Sheldrick, 2008). All the solvents were purchased from Fisher‐Scientific throughout the investigation. Deionized water was used for the preparation of all aqueous solutions.
2.2. Plant materials
Fresh and mature green seed cones were collected directly from a Magnolia grandiflora tree located at the Edinburg campus of the University of Texas Rio Grande Valley and authenticated by Dr. Andrew McDonald, Professor of Ethnobotany, Department of Biology of the University of Texas Rio Grande Valley.
2.3. Extraction, fractionation, and separation
Bioactivity‐guided extraction was performed (Bandyopadhyay, Banerjee, Laskar, & Basak, 2011; Bandyopadhyay et al., 2006, 2007; Scoffoni et al., 2017). Fresh mature seed cones were chopped into small pieces and air‐dried in absence of sunlight and grinded to produce powder (679 g). The powder was submerged in diethyl ether at room temperature for 21 days. After the stipulated period, the solvent was removed from the extract under reduced pressure. The resultant gummy mass was chromatographed over silica gel and eluted with hexanes/ethyl acetate mixtures by increasing the polarity gradually. A reddish oil was isolated from the pure hexanes eluent. The hexanes/ethyl acetate (95:5) mixture afforded a reddish solid, which on recrystallization over dichloromethane/hexanes/diethyl ether gave reddish needle‐shaped crystals (1.67 g) of 5,5′‐Diallyl‐[1,1′‐biphenyl]‐2,2′‐diol (1). Another compound, 3′,5‐diallyl‐[1,1′‐biphenyl]‐2,4′‐diol (II), was collected from the same column using hexanes/ethyl acetate (93:7) mixture as eluent which on crystallization yielded (623 mg) white crystals of (II). The residue obtained from the diethyl ether extraction was re‐extracted with ethanol following the same procedure and the crude extract was chromatographed. The compound 2α‐hydroxydihydroparthenolide, a sesquiterpenoid lactone, was collected from the hexanes/ethyl acetate (40:60) mixture as eluent which on crystallization yielded (71 mg) light violet crystals of (III).
3. RESULTS AND DISCUSSION
The melting points of the compounds (1), (II), and (III) were recorded as 102–103°C, 87–88°C, and 220–221°C, respectively. Both 1D‐ and 2D‐NMR experiments were conducted to determine the structure of the compound. APT (Attached Proton Test), DEPT (Distortionless Enhancement of Polarization Transfer)‐45° and 135° experiments were carried out to reveal the nature of the carbons (methyl, methylene, methine, and quaternary) in the molecule. 1H–1H‐correlations were figured out by double quantum filtered correlation spectroscopy (DQF‐COSY). Short range and long range 1H–13C‐correlations were determined by HMQC (Heteronuclear Multiple‐Quantum Correlation) and HMBC (Heteronuclear Multiple Bond Correlation) experiments, respectively. The analytical data of the compounds (I), (II), and (III) are presented in the sequel.
3.1. Characterization of compound (I)
5,5′‐Diallyl‐[1,1′‐biphenyl]‐2,2′‐diol (I): Mp 102–103°C; IR (neat, ν in cm−1): 3,132, 2,994, 1,493, 1,408, 1,209, 1,155, 1,089, 989, 901, 817, 661; 1H‐NMR (600 MHz, CDCl3) δ 7.09 (d, J = 8.04 Hz, 2H), 7.07 (s, 2H), 6.90 (dd, J = 10.56, 2.22 Hz, 2H), 6.02 (s, 2H), 5.95 (m, 2H), 5.07 (m, 4H), 3.35 (d, J = 6.72 Hz, 2H); 13C‐NMR (150 MHz, CDCl3) δ 151.98, 137.55, 133.32, 131.35, 129.91, 124.17, 116.75, 115.86, 39.39.
In FT‐IR spectrum, the broad peak at 3,132 cm‐1 identified the phenolic O–H stretching, whereas the presence of terminal double bonds was determined by 1D‐NMR experiments. The structure of the compound (I) was further confirmed by X‐ray crystallographic analysis. The ORTEP projection of the compound (I) is presented in Figure 2.
Figure 2.
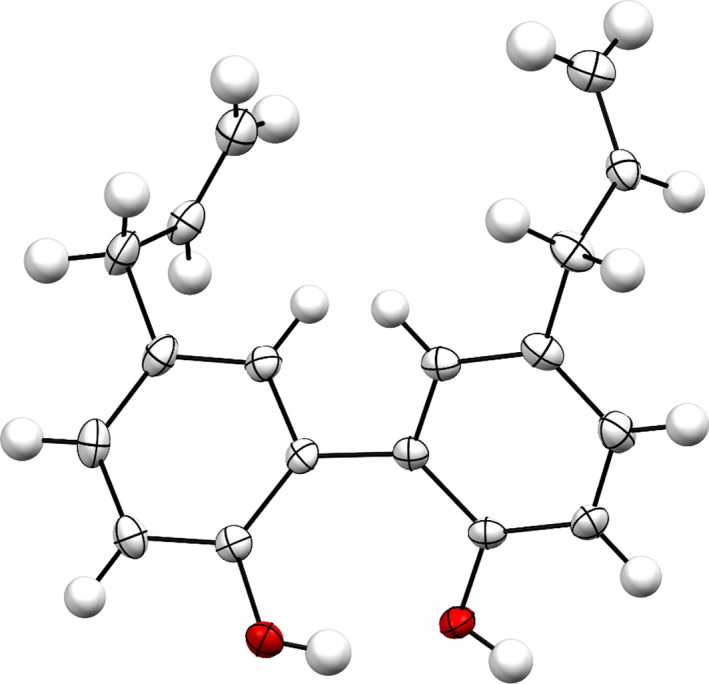
X‐ray crystallographic analysis of compound (I)
The structure was solved with the program SHELXS‐2014/7 and was refined on F2 with SHELXL‐2014/7 (Sheldrick, 2015). Numerical absorption correction based on Gaussian integration over a multifaceted crystal model was applied using CrysAlisPro. The temperature of the data collection was controlled using the system Cryojet (manufactured by Oxford Instruments). The H atoms were placed at calculated positions using the instructions AFIX 23, AFIX 43, AFIX 93, or AFIX 137 with isotropic displacement parameters having values 1.2 or 1.5 Ueq of the attached C atoms. The structure is ordered and the details are shown in Table 1.
Table 1.
X‐ray crystallographic details of the compound (I)
| CCDC | 1876722 | |
| Crystal data | ||
| Chemical formula | C18H18O2 | |
| M r | 266.32 | |
| Crystal system, space group | Monoclinic, P21/c | |
| Temperature (K) | 110 | |
| a, b, c (Å) | 10.8006 (5), 8.7496 (3), 15.9339 (8) | |
| β (°) | 107.431 (5) | |
| V (Å3) | 1,436.62 (12) | |
| Z | 4 | |
| Radiation type | Mo Kα | |
| μ (mm−1) | 0.08 | |
| Crystal size (mm) | 0.42 × 0.30 × 0.22 | |
| Data collection | ||
| Diffractometer | SuperNova, Dual, Cu at zero, Atlas | |
| Absorption correction |
Gaussian CrysAlis PRO, Agilent Technologies, Version 1.171.36.32 (release 02‐08‐2013 CrysAlis171.NET) (compiled Aug 2 2013,16:46:58) Numerical absorption correction based on Gaussian integration over a multifaceted crystal model |
|
| T min, T max | 0.343, 1.000 | |
| No. of measured, independent and observed [I > 2σ(I)] reflections | 11,350, 3,293, 2,708 | |
| R int | 0.026 | |
| (sin θ/λ)max (Å−1) | 0.650 | |
| Refinement | ||
| R[F 2 > 2σ(F 2)], wR(F 2), S | 0.045, 0.111, 1.04 | |
| No. of reflections | 3,293 | |
| No. of parameters | 184 | |
| H‐atom treatment | H‐atom parameters constrained | |
| Δρmax, Δρmin (e Å−3) | 0.35, −0.23 | |
3.2. Characterization of compound (II)
3′,5‐diallyl‐[1,1′‐biphenyl]‐2,4′‐diol (II): Mp 87–88°C; IR (neat, ν in cm‐1): 3,293, 3,080, 1,494, 1,429, 1,326, 1,241, 1,185, 1,050, 917, 822, 774; 1H‐NMR (600 MHz, CDCl3) δ 7.22 (m, 2H), 7.04 (dd, J = 8.28, 1.86 Hz, 1H), 7.01 (m, 1H), 6.88 (dd, J = 8.16, 2.04 Hz, 2H), 5.99 (m, 2H), 5.15 (m, 2H), 5.05 (m, 2H), 3.44 (d, J = 6.36 Hz, 2H), 3.34 (d, J = 6.66 Hz, 2H); 3C‐NMR (150 MHz, CDCl3) δ 153.94, 150.77, 137.81, 136.01, 132.28, 131.17, 130.25, 129.65, 128.85, 128.58, 127.75, 126.40, 116.96, 116.60, 115.63, 115.59, 39.43, 35.17.
In FT‐IR spectrum, the broad peak at 3,293 cm‐1 identified the phenolic O–H stretching, whereas the presence of terminal double bonds was determined by 1D‐NMR experiments. APT and DEPT experiments revealed the presence of three aromatic methine carbons, one aliphatic methine carbon, two methylene carbons, and three quaternary carbons in the molecule. The structure of the compound (II) was further confirmed by X‐ray crystallographic analysis. The ORTEP projection of the compound (II) is presented in Figure 3.
Figure 3.
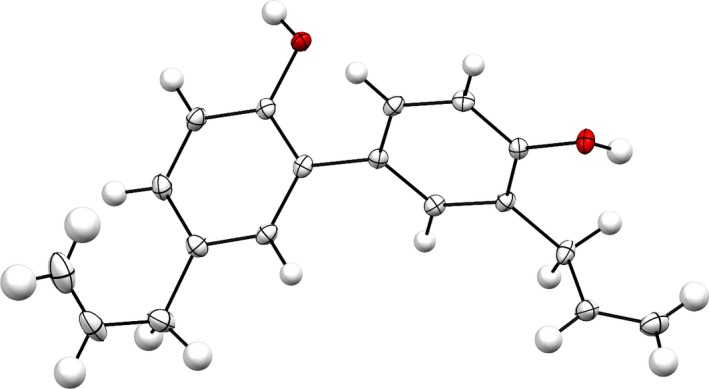
X‐ray crystallographic analysis of compound (II)
The structure (II) was solved following the method stated earlier, and the details are shown in Table 2. The structure is ordered.
Table 2.
X‐ray crystallographic details of the compound (II)
| CCDC | 1876723 |
| Crystal data | |
| Chemical formula | C18H18O2 |
| M r | 266.32 |
| Crystal system, space group | Monoclinic, P21/c |
| Temperature (K) | 110 |
| a, b, c (Å) | 12.5019 (4), 14.3062 (4), 7.8803 (3) |
| β (°) | 93.885 (3) |
| V (Å3) | 1,406.19 (8) |
| Z | 4 |
| Radiation type | Mo Kα |
| μ (mm−1) | 0.08 |
| Crystal size (mm) | 0.53 × 0.24 × 0.19 |
| Data collection | |
| Diffractometer | SuperNova, Dual, Cu at zero, Atlas |
| Absorption correction |
Gaussian CrysAlis PRO, Agilent Technologies, Version 1.171.36.32 (release 02‐08‐2013 CrysAlis171.NET) (compiled Aug 2 2013,16:46:58) Numerical absorption correction based on gaussian integration over a multifaceted crystal model |
| T min, T max | 0.600, 1.000 |
| No. of measured, independent and observed [I > 2σ(I)] reflections | 10,879, 3,229, 2,762 |
| R int | 0.025 |
| (sin θ/λ)max (Å−1) | 0.649 |
| Refinement | |
| R[F 2 > 2σ(F 2)], wR(F 2), S | 0.043, 0.103, 1.05 |
| No. of reflections | 3,229 |
| No. of parameters | 183 |
| H‐atom treatment | H‐atom parameters constrained |
| Δρmax, Δρmin (e Å−3) | 0.29, −0.19 |
3.3. Characterization of compound (III)
(3S,3aS,8S,9aS,10aR,10bS,E)‐8‐hydroxy‐3,6,9a‐trimethyl‐3a,4,5,8,9,9a,10a,10b‐octahydrooxireno[2′,3′:9,10]cyclodeca[1,2‐b]furan‐2(3H)‐one or 2α‐hydroxydihydroparthenolide (III): Mp 220–221°C; IR (neat, ν in cm–1): 3,492, 1,760, 1,456, 1,229, 1,183, 1,028, 1,012, 806; 1H‐NMR (600 MHz, CDCl3) δ 5.20 (d, J = 10.26 Hz, 1H), 4.81 (d, J = 4.08 Hz, 1H), 4.44 (m, 1H), 3.96 (t, J = 9.12 Hz, 1H), 3.33 (s, 1H), 2.82 (d, J = 9.12 Hz, 1H), 2.37 (m, 2H), 2.31 (dd, J = 11.82, 5.76 Hz, 1H), 2.17 (dd, J = 12.72, 6.48 Hz, 1H), 1.98 (m, 2H), 1.80 (m, 1H), 1.63 (s, CH3), 1.19 (s, CH3), 1.13 (d, J = 7.02 Hz, CH3); 3C‐NMR (150 MHz, CDCl3) δ 178.08, 134.16, 130.59, 81.81, 65.98, 65.23, 60.92, 50.91, 46.20, 41.98, 40.98, 28.86, 18.44, 17.60, 13.28.
In FT‐IR spectroscopy, the alcoholic –OH hydrogen appeared at 3,492 cm‐1 and the lactone carbonyl appeared at 1,760 cm‐1. The presence of three methyl groups was confirmed by APT and DEPT experiments. The three methylene carbons appeared at δ 46.20, 40.98, and 28.86. The structure and stereochemistry of the compound (III) were determined by 2D‐NMR spectroscopy and further confirmed by X‐ray crystallographic analysis. The ORTEP projection of the compound (III) is presented in Figure 4.
Figure 4.
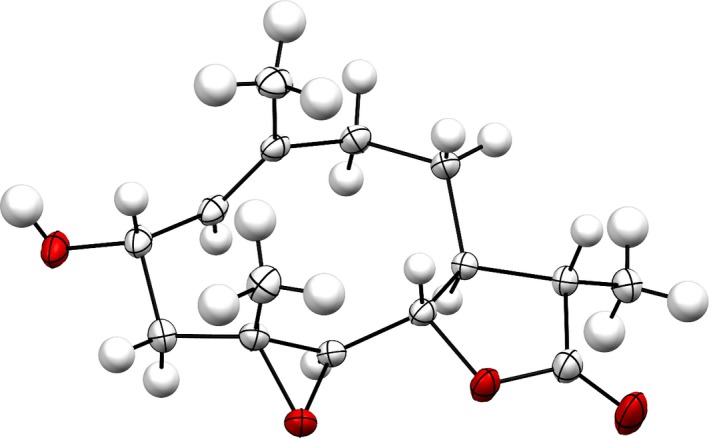
X‐ray crystallographic analysis of compound (III)
The structure of (III) was solved following the method stated earlier, and the details are shown in Table 3. The structure is ordered and the absolute configuration was established by anomalous‐dispersion effects in diffraction measurements on the crystal, and the Flack and Hooft parameters refine to −0.08(6) and −0.08(5), respectively. The structure has chirality S, S, S, S, R, R at C1, C6, C7, C9, C10, and C11, respectively.
Table 3.
X‐ray crystallographic details of the compound (III)
| CCDC | 1876724 |
| Crystal data | |
| Chemical formula | C15H22O4 |
| M r | 266.32 |
| Crystal system, space group | Orthorhombic, P212121 |
| Temperature (K) | 110 |
| a, b, c (Å) | 7.68084 (12), 11.44478 (17), 15.6640 (2) |
| V (Å3) | 1,376.95 (3) |
| Z | 4 |
| Radiation type | Cu Kα |
| μ (mm−1) | 0.75 |
| Crystal size (mm) | 0.53 × 0.24 × 0.16 |
| Data collection | |
| Diffractometer | SuperNova, Dual, Cu at zero, Atlas |
| Absorption correction |
Analytical CrysAlis PRO 1.171.39.29c (Rigaku Oxford Diffraction, 2017) Analytical numeric absorption correction using a multifaceted crystal model based on expressions derived by Clark and Reid (1995) |
| T min, T max | 0.782, 0.917 |
| No. of measured, independent and observed [I > 2σ(I)] reflections | 8,913, 2,704, 2,642 |
| R int | 0.018 |
| (sin θ/λ)max (Å−1) | 0.616 |
| Refinement | |
| R[F 2> 2σ(F 2)], wR(F 2), S | 0.027, 0.073, 1.06 |
| No. of reflections | 2,704 |
| No. of parameters | 177 |
| H‐atom treatment | H‐atom parameters constrained |
| Δρmax, Δρmin (e Å−3) | 0.20, −0.14 |
| Absolute structure | Flack x determined using 1,100 quotients [(I+)‐(I‐)]/[(I+)+(I−)] (Parsons, Flack, & Wagner, 2013). |
| Absolute structure parameter | −0.08 (6) |
3.4. GC‐MS studies of the oil
A dark red oil was isolated by eluting hexanes during column chromatography of the diethyl ether extract. GC‐MS analysis indicated the presence of eight compounds in the oil among which 5,5′‐diallyl‐2′‐methoxy‐[1,1′‐biphenyl]‐2‐ol (Compound IV, Figure 1) was found to be the major constituent (75.37%; RT = 37.112). The –OCH3 carbon appeared at δ55.53, and the presence of the two medicinally privileged phenylpropanoid skeletons was confirmed by FT‐IR and 1D‐NMR spectra. The compounds were identified based on retention time (RT), area under the curve (AUC), and mass spectral (m/z) analysis (Figure 5).
Figure 5.
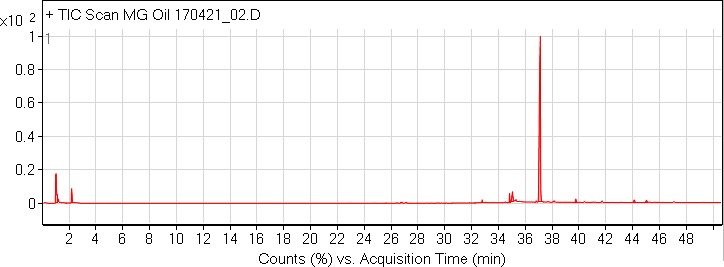
GC‐MS chromatogram of the oil isolated from M. grandiflora green seed cones
Aside compound (IV), other identified compounds are as follows: Cis‐vaccenic acid (4.14%; RT = 35.044), 1‐(4‐isopropylbenzyl)‐1,3‐dihydro‐2H‐benzo[d]imidazol‐2‐one (1.72%; RT = 34.822; compound V), heptacosane (0.98%; RT = 44.127), heneicosane (0.94%; RT = 39.759), 13‐methylheptacosane (0.86%; RT = 45.031), 1,1‐difluoroethane (0.83%; RT = 1.113), and n‐hexadecanoic acid (0.5%; RT = 32.786). The mass spectra of compound (IV) and (V) are shown in Figures 6 and 7, respectively.
Figure 6.
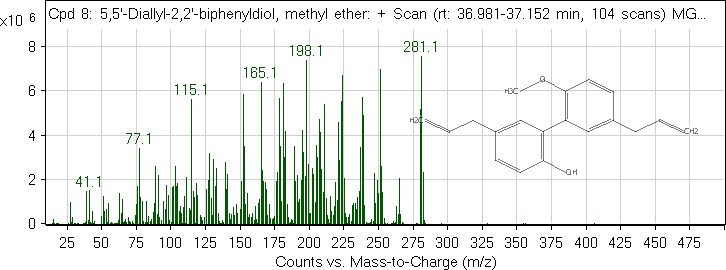
GC‐MS spectrum of the compound (IV)
Figure 7.
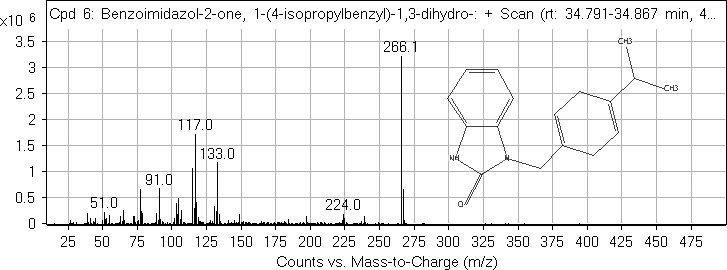
GC‐MS spectrum of the compound (V)
In the next step, the druggability of the compounds (I–V, Figure 1) was validated following Lipinski's rule‐of‐five (RO5) (Lipinski, 2004; Lipinski, Lombardo, Dominy, & Feeney, 1997). Compounds I, III, and V showed no violation, whereas other two compounds (II and IV) showed only one violation each. Accordingly, all the five compounds can be considered as “drug‐like” molecules and semi‐synthetic products derived from these molecules (with appropriate chemical modification) have high promise to become effective drug(s). The druggability (druglikeness) of the compounds (I–V, Figure 1) was calculated by Molinspiration software is shown in Table 4.
Table 4.
Druggability validationa of the compounds (I‐V)
| Compound | miLogPb | HBAc | HBDd | TPSAe | RBf | MWg | Violation (RO5) |
|---|---|---|---|---|---|---|---|
| I | 4.80 | 2 | 2 | 40.46 | 5 | 266.34 | 0 |
| II | 5.00 | 2 | 2 | 40.46 | 5 | 266.34 | 1 |
| III | 1.10 | 4 | 1 | 59.06 | 0 | 266.34 | 0 |
| IV | 5.07 | 2 | 1 | 29.46 | 6 | 280.37 | 1 |
| V | 4.25 | 3 | 1 | 37.80 | 3 | 266.34 | 0 |
Molinspiration property engine v2016.10.
miLogP: Moriguchi octanol–water partition coefficient is based on quantitative structure‐LogP relationships, by using topological indexes.
Hydrogen bond acceptor.
Hydrogen bond donor.
Total polar surface area.
Number of rotatable bonds.
Molecular weight in Dalton.
4. CONCLUSION
In conclusion, five bio‐privileged molecules have been identified as the major components of the diethyl ether and ethanol fractions of Magnolia grandiflora green seed cones, and out of these, X‐ray crystallographic analyses of three compounds (I, II, and III) were successfully carried out. All the five compounds (I–V) discussed herein showed good to excellent in silico druggability. Some of these molecules may find application to open new frontiers in natural drug discovery research via appropriate chemical modification.
CONFLICTS OF INTEREST
The authors do not have any conflicting interests.
ETHICAL APPROVAL
This study does not involve any human or animal testing.
INFORMED CONSENT
None.
ACKNOWLEDGMENTS
The authors are grateful to the Department of Chemistry and the School of Earth Environment and Marine Sciences (SEEMS) of the University of Texas Rio Grande Valley for start‐up funding (to DB) and for extending facilities for this study. Thanks are accorded to Ms. Maria Lourdes Bernadette Vigilar for helping to process the seed cones. The Department of Chemistry at the University of Texas Rio Grande Valley is grateful for the generous support provided by a Departmental Grant from the Robert A. Welch Foundation (Grant No. BX‐0048).
Garza B, Echeverria A, Gonzalez F, Castillo O, Eubanks T, Bandyopadhyay D. Phytochemical investigation of Magnolia grandiflora green seed cones: Analytical and phytoceutical studies. Food Sci Nutr. 2019;7:1761–1767. 10.1002/fsn3.1016
This paper is respectfully dedicated to Professor (Dr.) Parwinder Singh Grewal to honor his lifelong devotion to Science and Community.
REFERENCES
- Avonto, C. , Chittiboyina, A. G. , Sadrieh, N. , Vukmanovic, S. , & Khan, I. A. (2018). In chemico skin sensitization risk assessment of botanical ingredients. Journal of Applied Toxicology, 38, 1047–1053. 10.1002/jat.3614 [DOI] [PubMed] [Google Scholar]
- Bandyopadhyay, D. (2014a). Curcumin: A folklore remedy from kitchen on the way to clinic as cancer drug In Watanabe H. S. (Ed.) Horizons in cancer research (pp. 1761–42). Hauppauge, NY: Nova Science Publishers Inc. [Google Scholar]
- Bandyopadhyay, D. (2014b). Farmer to pharmacist: Curcumin as an anti‐invasive and antimetastatic agent for the treatment of cancer. Frontiers in Chemistry, 2, Article# 113. [DOI] [PMC free article] [PubMed] [Google Scholar]
- Bandyopadhyay, D. , Banerjee, M. , Laskar, S. , & Basak, B. (2011). Asimafoetidnol: A new Sesquiterpenoid Coumarin from the gum resin of Ferula assa‐foetida L. Natural Product Communications, 6, 209–212. [PubMed] [Google Scholar]
- Bandyopadhyay, D. , Basak, B. , Chatterjee, A. , Lai, T. K. , Banerji, A. , Banerji, J. , … Prangé, T. (2006). Saradaferin, a new Sesquiterpenoid Coumarin from Ferula assafoetida . Natural Product Research, 20, 961–965. 10.1080/14786410600823431 [DOI] [PubMed] [Google Scholar]
- Bandyopadhyay, D. , Basak, B. , Nayak, A. , Banerji, A. , Banerji, J. , & Chatterjee, A. (2007). N‐(4‐methylphenyl) benzenepropanamide — The first isolated amide from the genus Paederia . Natural Product Communications, 2, 753–754. [Google Scholar]
- Clark, R. C. , & Reid, J. S. (1995). Empirical absorption correction using spherical harmonics, implemented in SCALE3 ABSPACK scaling algorithm. Acta Crystallographica, A51, 887–897. [Google Scholar]
- Ding, L.‐F. , Su, J. , Pan, Z.‐H. , Zhang, Z.‐J. , Li, X.‐N. , Song, L.‐D. , … Zhao, Q.‐S. (2018). Cytotoxic sesquiterpenoids from the leaves of Magnolia grandiflora . Phytochemistry, 155, 182–190. 10.1016/j.phytochem.2018.08.006 [DOI] [PubMed] [Google Scholar]
- Giddings, L.‐A. , & Newman, D. J. (2015a). Bioactive compounds from terrestrial extremophiles. Heidelberg, Germany: Springer. [Google Scholar]
- Giddings, L.‐A. , & Newman, D. J. (2015b). Bioactive compounds from marine extremophiles. Heidelberg, Germany: Springer. [Google Scholar]
- Giddings, L.‐A. , & Newman, D. J. (2015c). Bioactive compounds from extremophiles: Genomic studies. Heidelberg, Germany: Springer. [Google Scholar]
- Lata, P. , Govindarajan, S. S. , Qi, F. , Li, J.‐L. , Maurya, S. K. , & Sahoo, M. K. (2017). Whole‐genome sequence of Pantoea americana Strain VS1, an extended‐spectrum β‐lactamase‐producing epibiont isolated from Magnolia grandiflora . Genome Announcements, 5, Article # 46. [DOI] [PMC free article] [PubMed] [Google Scholar]
- Lipinski, C. A. (2004). Lead‐ and drug‐like compounds: The rule‐of‐five revolution. Drug Discovery Today: Technologies, 1, 337–341. 10.1016/j.ddtec.2004.11.007 [DOI] [PubMed] [Google Scholar]
- Lipinski, C. A. , Lombardo, F. , Dominy, B. W. , & Feeney, P. J. (1997). Experimental and computational approaches to estimate solubility and permeability in drug discovery and development settings. Advanced Drug Delivery Reviews, 23, 3–25. 10.1016/S0169-409X(96)00423-1 [DOI] [PubMed] [Google Scholar]
- Newman, D. J. , & Cragg, G. M. (2016). Natural products as sources of new drugs from 1981 to 2014. Journal of Natural Products, 79, 629–661. 10.1021/acs.jnatprod.5b01055 [DOI] [PubMed] [Google Scholar]
- Parsons, S. , Flack, H. D. , & Wagner, T. (2013). Acta Crystallographica, B69, 249–259. [DOI] [PMC free article] [PubMed] [Google Scholar]
- Scoffoni, C. , Albuquerque, C. , Brodersen, C. R. , Townes, S. V. , John, G. P. , Cochard, H. , … Sack, L. (2017). Leaf vein xylem conduit diameter influences susceptibility to embolism and hydraulic decline. New Phytologist, 213, 1076–1092. 10.1111/nph.14256 [DOI] [PubMed] [Google Scholar]
- Sheldrick, G. M. (2008). A short history of SHELX. Acta Crystallographica Section A., A64, 112–122. [DOI] [PubMed] [Google Scholar]
- Sheldrick, G. M. (2015). Crystal structure refinement with SHELXL. Acta Crystallographica Section C: Structural Chemistry, C71, 3–8. [DOI] [PMC free article] [PubMed] [Google Scholar]


