

Summary
Innate immune responses vary in a circadian manner, and more recent investigations aim to understand the underlying molecular mechanisms. Cytokine production varies significantly over the course of a day depending on the time of stimulation by pathogens or Toll‐like receptor ligands, and multiple signaling pathways linked to the cell‐autonomous circadian clock modulate innate immunity. Recognition of foreign material, especially by innate immune cells, engages a myriad of receptors, which trigger inflammatory responses, as well as endocytosis and degradation and/or processing for antigen presentation. Because of the close connection between particle engulfment and inflammation, it has been proposed that phagocytic uptake may drive cytokine production in phagocytes. Here we show that bacterial particle ingestion by mouse peritoneal macrophages displays temporal variation, but is independent of the cell‐intrinsic circadian clock in an ex vivo setting. Although cytokine production is dependent on phagocytosis, uptake capacity across 12 hr does not translate into 24‐hr rhythms in cytokine production. In vivo, time‐of‐day variations in phagocytic capacity are not found, whereas a time of day and clock‐dependent cytokine response is maintained. These data show that efficiency of bacterial phagocytosis and the 24‐hr rhythmicity of cytokine production by macrophages are independent of one another and should be studied separately.
Keywords: Circadian, ex vivo, in vivo, macrophages, phagocytosis
Introduction
Circadian rhythmicity in higher organisms is controlled by a hierarchical structure, where a master clock in the suprachiasmatic nucleus responds to environmental signals, such as diurnal changes in light, and signals to cellular clocks in peripheral tissues to ensure synchrony of the organism with solar time.1, 2 Cell intrinsic, autonomous molecular clocks exist in most cells and are comprised of interlocked, transcriptional–translation feedback loops. Brain and Muscle ARNT‐Like 1 (BMAL1) dimerizes with CLOCK3 and binds to E‐box (CACGTG) motifs in DNA4 to induce transcription of clock genes, such as Period (PER), Cryptochrome (CRY) and RAR Related Orphan Receptor (ROR) and Reverb.5 Following translation, PERs and CRYs translocate to the nucleus to inhibit the BMAL1:CLOCK dimer, thereby inhibiting their own transcription, while RORs and REV‐ERBs directly regulate transcription of Bmal1, the only non‐redundant clock component that, when deleted, by itself results in a complete functional breakdown of the molecular clock.6 Components of the molecular clock, such as BMAL1, can further bind to thousands of sites within the genome to induce expression of clock‐controlled genes; it is estimated that up to 43% of the transcriptome may be clock controlled.7
Circadian variation in innate immune responses and susceptibility of mouse models to septic shock have been known for many years8, 9, 10 and more recent studies have demonstrated a significant role for the molecular circadian clock and specific clock components in innate immune responses to pro‐inflammatory stimulation. The abundance of immune cells in the circulation,11, 12 and immune cell subsets such as Ly6Chigh inflammatory monocytes,13 natural killer cells,14 eosinophils15 and T cells16, 17 fluctuate over the course of the day, which may contribute to the intensity of an immune response. Cytokine production following inflammogenic stimulation has also been attributed to the circadian system and deletion of clock components such as Reverba and Cry2, which both display sustained overall functionality of the clock, increase interleukin‐6 (IL‐6) production in macrophages in an in vitro, as well as an in vivo, model.18, 19 This argues for a pathway that cannot be fully ascribed to a single clock component and emphasizes that our understanding of how the circadian system may regulate cytokine response is still lacking.
In sepsis models, the production of cytokines following an immune stimulation is critical in the response to infection. Cytokine levels are therefore widely used as indicators for the intensity of an immune response and in accordance with rhythmic mortality upon stimulation with lipopolysaccharide (LPS) and tumor necrosis factor,8, 9 the intensity of cytokine production similarly correlates with the time of immunological innervation.13, 19, 20, 21, 22, 23
The initial induction of an immune response and cytokine production relies on the engagement of inflammogenic material with surface receptors on immune cells, and this interaction also often results in internalization of these materials, particularly when they are in particulate form such as bacteria.24 Macrophages, the immediate responders to an inflammatory insult, which are often studied in the context of LPS‐induced inflammation, are professional phagocytes with a significant capacity for particle ingestion. Considering the correlation of the type of material encountered to the inflammatory response induced, as well as the mechanism by which it is internalized,25 phagocytic uptake and cytokine production – which are not necessary interdependent26 – may be coupled across the daily cycle.
The capability of immune cells to internalize inflammogenic material has also been studied in the context of circadian biology.27, 28, 29 Daily oscillations in the capacity of peritoneal cells to phagocytose Zymosan27 and clock regulation of Streptococcus pneumoniae and Serratia marcescens phagocytosis in Drosophila 28 among others were described. Further, melatonin, a hormone primarily produced by the pineal gland under the control of the suprachiasmatic nucleus, which projects lighting information to tissues throughout the body, has been identified as a potent regulator of particle ingestion in a variety of cell types.30, 31, 32 However, whether the cell‐intrinsic clock regulates circadian oscillations in phagocytosis, and the relationship between phagocytosis and inflammatory cytokine production by macrophages is not well understood.
Here we have studied the influence of daily time and the molecular clock on phagocytosis of bacterial and other particles by peritoneal macrophages both ex vivo and in vivo, the relationship between efficiency of phagocytosis and cytokine production, and the dependence of these responses on the cell‐intrinsic molecular clock. Although particle phagocytosis by macrophages ex vivo varied across 12 hr, phagocytosis was not regulated by the cell‐autonomous clock, and time‐of‐day variations in cytokine response were regulated independent of particle ingestion. These results show that cytokine production and inflammatory responses are not linked to phagocytic capacity of macrophages, and provide a new perspective on the origin of variation in innate immunity over time of day.
Material and methods
Mice
Cd36 knockout mice (B6.129S1‐Cd36tm1Mfe/J stock number 019006) and control C57BL/6J mice (stock number 000664) were obtained from the Jackson Laboratories (Bar Harbor, ME). Bmal1 floxed animals (B6.129S4(Cg)Arntltm1Weit/J stock number 007668) and LyzM‐Cre mice (B6.129P2‐Lyz2tm1(cre)Ifo/J stock number 004781) were purchased from the Jackson Laboratory on C57BL/6J background and were intercrossed to generate BMAL1fl/flLyzM‐Cre+/+, which lack the Bmal1 gene in the myeloid lineage. BMAL1fl/flLyzM‐Cre−/− mice served as controls with an intact Bmal1 gene. Animals were housed in 12 hr : 12 hr light : dark conditions (~70 Lux at times of illumination), in rooms accessible under red lights during the dark period. Studies were conducted using male and female mice and no differences were apparent between sexes.
To control for technical variation, a reverse‐light‐room was used in some experiments in which time‐points that were 12 hr apart were compared. The light schedule in this room was anti‐phasic to the regular mouse holding room, allowing ZT0 versus ZT12 experiments to be performed simultaneously. Mice were acclimatized for at least 3 weeks in the reverse‐light‐room before they participated in any study to allow full recovery of the circadian clock, whereas mice from conventional rooms were acclimatized for at least 1 week.
All animal procedures have been approved by the appropriate regulatory body.
Peritoneal lavage
Mice were killed and decapitated at the indicated time‐points. After skinning the abdomen to expose the peritoneum, 5 ml of ice‐cold phosphate‐buffered saline (PBS), together with 1 ml of air were rapidly injected into the peritoneum with a 21‐gauge needle. Then, the liquid was retrieved back to the needle and the cell suspension was kept on ice until it was centrifuged at 863 g at 4°. The cell pellet, which contained mainly B cells and macrophages, was then used for further experiments.
Bone‐marrow‐derived macrophages
Mice were killed using CO2 and the rear leg bones were dissected from surrounding tissue. The bone marrow was flushed into a 50‐ml Falcon tube using a G25 needle until the bone appeared white. The cell suspension was centrifuged for 5 min at 486 g and the cell pellet was resuspended in 3 ml ACK Lysis buffer for 3 min. Then, 17 ml Dulbecco's modified Eagle's medium (DMEM) was added to stop the reaction and the suspension was strained through a 100‐μm cell strainer and subsequently pelleted by centrifugation for 5 min at 486 g. The cell pellet was resuspended in 30 ml DMEM supplemented with 1% penicillin/streptomycin, 10% fetal calf serum (FCS) and 20% L929 conditioned medium and distributed to three 10‐cm Petri dishes to allow macrophage differentiation for 7 days at 37°, 5% CO2 in a tissue‐culture incubator. On day 4, 1 ml L929 conditioned medium was added to each plate. On day 7, the cells were washed with 5 ml PBS before they were scraped in 5 ml ice‐cold PBS from the culture plate using a cell scraper and transferred into a Falcon tube. After centrifugation for 5 min at 486 g, the cell pellet was resuspended at 1 million cells per ml in DMEM with 10% L929 conditioned medium, 10% FCS, 1% penicillin/streptomycin and plated for use on day 8. L929 conditioned medium was made by culturing previously confluent L929 cells at 0·5 × 106 cells/ml RPMI‐1640 with 10% FCS, 1% penicillin/streptomycin for 7 days. The supernatant was then filtered and stored at −20° until use.
LPS stimulation
Peritoneal cells (0·5 × 106) were stimulated with 100 ng/ml Escherichia coli O111:B4 LPS (Sigma, St Louis, MO; Cat# L2630 Lot# 014M4018V) in DMEM (with 1% penicillin/streptomycin) for 1 hr or 24 hr before the supernatant was collected and stored at −20° until analysis. Cells were lyzed in RLT buffer (Qiagen, Venlo, Netherlands, Cat# 79216) and stored at −80° for subsequent RNA extraction. LPS solutions were freshly prepared and sonicated before use.
In vivo uptake
Heat‐inactivated, fluorescent Staphylococcus aureus [0·4 × 106 or 20 × 106 cells; multiplicity of stimulation (MOS) 0·1 or 5, respectively, assuming four million macrophages per peritoneum based on previous peritoneal lavage counts] were injected intraperitoneally at the indicated time‐points in 200 μl sterile PBS. After 1 hr, peritoneal cells were harvested and vigorously washed three times before they were stained for subsequent flow cytometry or microscopy analysis.
Ex vivo uptake
Peritoneal leukocytes (0·5 × 106) were treated with 2·5 × 106 fluorescent, heat‐inactivated S. aureus particles, for an MOS of 5 (Life Technologies, Carlsbad, CA; Staphylococcus aureus BioParticles Alexa Fluor 488 or 594 conjugate, Cat# S23371 or S23372), or 5 × 10⁶ fluorescent, heat‐inactivated E. coli particles (MOS 10) (Life Technologies; Escherichia coli BioParticles Alexa Fluor 488 or 594 conjugate, Cat# E13231), or Vybrant (Life Technologies; Vybrant Phagocytosis Assay Kit, Cat# V6694), or 2·5 × 108 latex beads (MOS 500) (Life Technologies; Beads FluoSpheres polystyrene, 1·0 μm, yellow green, Cat# F13081, Lot# 1421042), or 2·5 × 108 living green fluorescent protein‐expressing E. coli (kind gift from Jay Hinton) (multiplicity of infection 500) for 1 hr if not indicated otherwise. For uptake inhibition studies, indicated concentrations of Latrunculin A (Invitrogen, Carlsbad, CA; Cat# L12370 Lot# 796178) were added to the cells 10 min before the addition of the particles and remained in the cell medium until the end of the study (1 hr for uptake measurements and 4 hr for cytokine measurements). Deviating particle concentrations are indicated in the figure legends. Cells were vigorously washed three times for subsequent quantification of fluorescence by flow cytometry, microplate reader or microscopy.
Flow cytometry
Cells were vigorously washed three times with PBS to remove bacterial particles from the cell surface, before they were treated with Fc‐block (BioXCell, West Lebanon, NH; Cat# CUS‐HB‐197‐A02) for 10 min at 4° and stained for F4/80 PE‐Cy7 (BioLegend, San Diego, CA; Cat# 123114) and Live/Dead blue fixable stain (Life Technologies; Cat# L23105) for 30 min at 4°. Following two additional washes, the cells were fixed with 3% Paraformaldehyde for 10 min at room temperature, washed once more and subsequently analyzed on an LSR Fortessa (BD Bioscience, Franklin Lakes, NJ, USA). The gating strategy is shown in the Supplementary material (Fig. S1).
Fluorescence plate reader
Following adherence of 0·1 × 106 cells to a flat‐bottom 96‐well plate overnight (bone‐marrow‐derived macrophages) or for 30 min (peritoneal cells), cells were stimulated with 5 × 10⁷ living green fluorescent protein‐labeled E. coli, or 5 × 10⁷ latex beads, or with Vybrant (commercially available phagocytosis kit including inactivated E. coli) particles according to the manufacturer's instructions. Extracellular signal was quenched with Trypan Blue for 1 min at room temperature immediately before fluorescence was determined by a FLUOstar OPTIMA fluorescent plate reader (BMG Labtech, Ortenberg, Germany). Data are presented as relative fluorescence intensity.
Confocal microscopy
Cells were vigorously washed three times with PBS to remove bacteria from the cell surface and allowed to adhere to Poly‐L‐Lysin‐coated cover glasses for 30 min at room temperature. After 10 min Fc‐blockage (50 μl, 60 μg/ml) at 4°, the cells were stained with a fluorescein isothiocyanate‐conjugated anti‐S. aureus antibody (50 μl, 1:200) (Abcam, Cambridge, UK; Cat# ab68950) for 30 min at 4°, followed by a wash and subsequent incubation with CellMask 1:1000 (Invitrogen; Cat# C10046) and Hoechst 33342 1:200 (Sigma; Cat# 14533) for 5 min at room temperature. The cells were then washed twice and fixed with 3% PFA for 10 min at room temperature. Mounted cells (Mounting medium Vectashield; Vector Laboratories, Burlingame, CA; Cat # H‐ 1000)) were sealed with nail polish and stored at 4° until visualized using a Leica SP5 NLO confocal system. Three‐dimensional analysis was performed using imaris software (Bitplane, Zurich, Switzerland). Permeabilized samples were similarly prepared, except that cells were permeabilized in 200 μl freshly prepared 0·1% Triton X‐100 in PBS for 6 min at room temperature and washed once with warm DMEM before the fluorescein isothiocyanate‐conjugated anti‐S. aureus antibody was added for staining.
FACS purification
Peritoneal macrophages were isolated and stained for F4/80 and propidium iodide to discriminate dead cells and were then sorted on a MoFlow cell sorter according to F4/80 positivity or negativity in two separate, RLT‐containing tubes. Only propidium‐iodide‐negative, single cells were considered and sorted cells were kept on ice until further processing.
RNA isolation
RNA from cell cultures was isolated using the commercially available RNeasy Mini Kit (Qiagen, Venlo, Netherlands; Cat# 74106). Cells were washed with PBS before 350 μl RLT buffer was added to the cells. To improve cell lysis, the cell suspension was then placed at −80° for at least 1 day and vigorously pipetted up and down several times after being defrosted. The RNA was precipitated by addition of 525 μl (1·5 volumes) of 100% pure ethanol and loaded onto an RNeasy spin column. During a 15‐second spin at 8000 g the RNA was enriched within the column and washed twice with 500 μl RPE buffer. The column was centrifuged at 8000 g for 15 seconds during the first, and 2 min during the second wash, and the flow through was discarded after each spin. Remaining ethanol was removed by an additional centrifugation at full speed for 1 min, while using a fresh collection tube. Lastly, the column was placed into an RNase‐free Eppendorf tube and the RNA was eluted in 25 μl RNase‐free H2O during a 1‐min centrifugation at 8000 g. The eluted RNA was re‐loaded onto the column for a second elution step to maximize the yield of recovered RNA.
Reverse transcription PCR and quantitative PCR
Complementary DNA was prepared from RNA using the commercially available kit iScript (BioRad, Hercules, CA; Cat# 170‐8841) according to the manufacturer's instructions using 500 ng RNA. Following reverse transcription, the cDNA was stored at −20°. Before use in a quantitative polymerase chain reaction (PCR), the cDNA was diluted in the range of 1 : 2 to 1 : 10 in ultra‐pure water. During the procedure, the RNA and resulting cDNA were kept on ice.
Real‐time PCR was performed using TaqMan Primer/Probe sets purchased from ThermoFisher (Waltham, MA) and Sso Advanced Universal Probes Supermix (BioRad; Cat# 172‐5284) in a CFX384 Touch Real‐Time PCR Detection System (BioRad; Cat# 1855485). The cycle number that resulted in a fluorescence signal above threshold (CT) was recorded and data were normalized to the average CT of three housekeeping genes that have previously been validated in a circadian setting (RPS18, Actin and GAPDH) (data not shown). To generate more useful axis ranges, mRNA abundance was normalized to the average of all data points of the gene of interest in a given experiment.
Cytokine measurement
In vivo cytokines were measured at the indicated time‐points by terminal blood collection following decapitation. Serum was separated in Z‐gel micro tubes (Sarstedt, Nümbrecht, Germany; Cat# 41.1500.005) after a 30‐min incubation and centrifugation at 10 000 g for 5 min. Serum was stored at −20° until use. Supernatants from ex vivo stimulations were separated from the cells by centrifugation for 5 min at 863 g at 4° and stored at −20° until further use. Cytokines were measured using the Bio‐Plex system (BioRad) in a multiplex assay according to the manufacturer's instructions. In short, appropriate magnetic capture beads were washed twice with wash buffer in a magnetic plate washer, before the samples and standards were added to the plate and incubated for 30 min while shaking. Following three washes, the respective biotinylated detection antibodies were added for 30 min while shaking, before the plate was washed three times. Lastly, phycoerythrin‐conjugated streptavidin was added for 10 min before the magnetic beads were washed three times and resuspended in 125 μl assay buffer. The conjugates were then analyzed using a Bio‐Plex MagPix Multiplex Reader (BioRad).
Statistics
Error bars represent the standard error of the mean. For pairwise, non‐parametric statistical analysis, Mann–Whitney U‐test was performed using prism6 (www.graphpad.com). For comparing multiple variables, analysis of variance and post hoc test were used as appropriate, with the P‐value of main interaction given, unless indicated otherwise. To identify rhythmic data sets, JKT Cycle (Freeware provided by the Hughes Laboratory)33 was used.
Results
Ingestion of heat‐inactivated bacterial particles is affected by the time of the day ex vivo and phagocytosis is required for cytokine production
To investigate uptake capacity of tissue‐resident macrophages across the daily cycle, cells were isolated from the peritoneum of mice at zeitgeber time 0 (ZT0, the beginning of the light phase) or ZT12 (start of the dark phase) and incubated for 1 hr with fluorescently labeled, heat‐inactivated bacteria. Both Gram‐positive (S. aureus), and Gram‐negative (E. coli) bacteria were tested. Strikingly, the mean fluorescence intensity (MFI) per cell for both bacterial species was increased in macrophages harvested at ZT12 compared with ZT0 (Fig. 1a,b). The percentage of peritoneal macrophages that were able to ingest one or more particles was thereby similar between those two time‐points (Fig. 1c,d). These data show increased efficiency of particle uptake by F4/80‐positive macrophages at ZT12 compared with ZT0.
Figure 1.
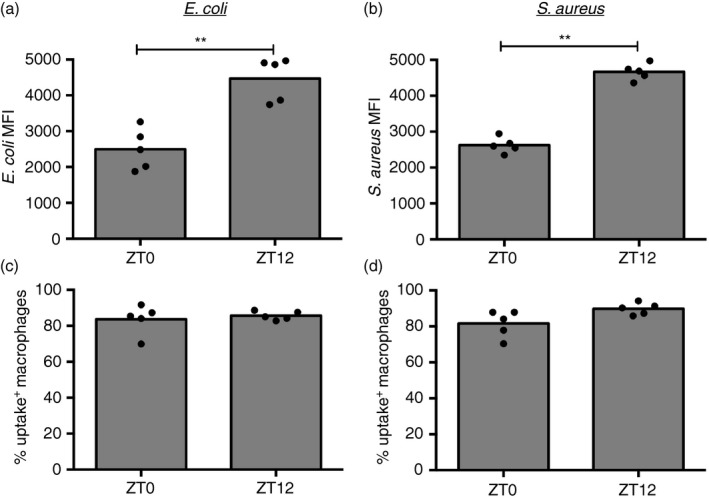
Efficiency of ex vivo Escherichia coli and Staphylococcus aureus bioparticle uptake in peritoneal macrophages is increased at ZT12. Mean fluorescence intensity in uptake‐positive macrophages (a, b) and percentage of uptake‐positive cells (c, d) following exposure of peritoneal cells to fluorescently labeled E. coli (a, c) (5 × 10⁶, multiplicity of stimulation 10) or S. aureus (b, d) (2·5 × 106, multiplicity of stimulation 5) for 1 hr. Cells were isolated at the indicated times from mice housed in anti‐phasic light cycle rooms, so that ZT0 and ZT12 harvests could be performed in parallel. Significance of the differences between ZT0 and ZT12 is shown using Mann–Whitney, **P < 0·01.
Among cells in the peritoneal fluid, macrophages (identified by F4/80; see Supplementary material, Fig. S1) accounted for most of the particle uptake (Fig. 2a,b), whereas their abundance, as well as the overall basal composition of cell subsets in the peritoneal cavity, such as B cells, eosinophils, small/large peritoneal macrophages and dendritic cells, remained steady over the course of the day (see Supplementary material, Fig. S1b). To determine whether the temporal variation seen with bacterial phagocytosis is seen with non‐bacterial stimuli, peritoneal cells were incubated for 1 hr with a variety of particles, including inert latex beads (~1 μm in diameter) and the percentage of uptake‐positive cells was recorded. As with bacteria, uptake of fluorescently labeled Vybrant particles (heat‐inactivated E. coli) and latex beads was also predominantly seen in F4/80‐positive cells (Fig. 2c,d), and analysis of the MFI showed that these particles were also ingested to a greater extent by peritoneal macrophages at ZT12 compared with ZT0, with ZT6 being intermediate (Fig. 2e,f).
Figure 2.
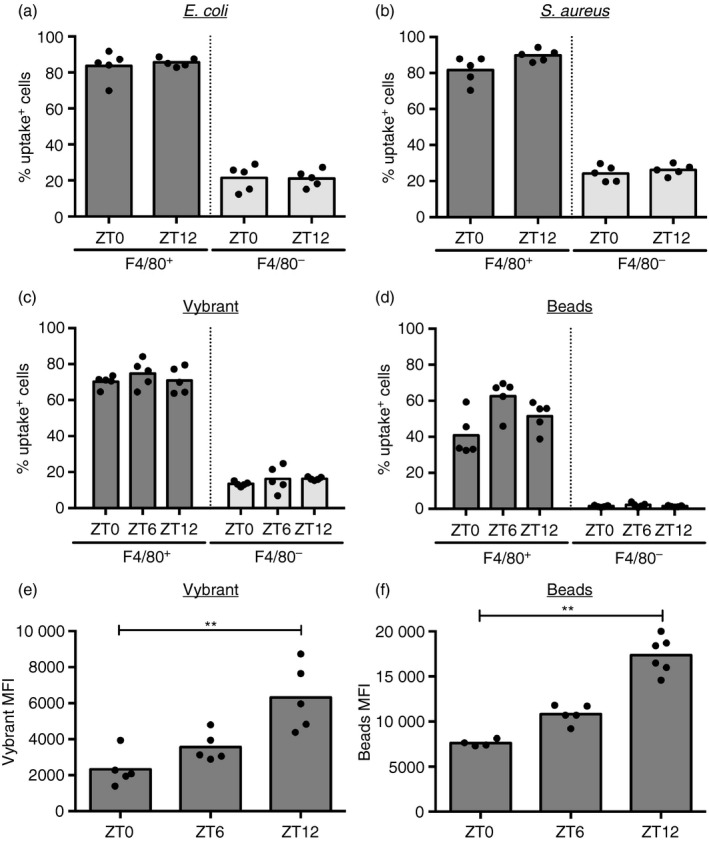
F4/80+ macrophages, but not other cell types, account for particle uptake over 12 hr. Percentage of uptake‐positive cells in the F4/80+ and F4/80− population upon stimulation of the peritoneal lavage extracted at indicated times with Escherichia coli bioparticles [5 × 10⁶, multiplicity of stimulation (MOS) 50] (F 1,16 = 0763, P < 0·0001) (a), Staphylococcus aureus bioparticles (2·5 × 106, MOS 5) (F 1,16 = 544, P < 0·0001) (b), Vybrant (F 1,24 = 831·8, P < 0·0001) (c), or fluorescent latex beads (5 × 10⁶, MOS 10) (F 1,24 = 378·3, P < 0·0001) (d) for 1 hr ex vivo. Statistical analysis of the population factor (F4/80+ versus F4/80−) using two‐way analysis of variance. (e) Mean fluorescence intensity in uptake positive macrophages (P = 0·0003) isolated at the indicated times and stimulated with Vybrant for 1 hr. (f) Mean fluorescence intensity of uptake positive peritoneal cells (P < 0·0001) isolated at the indicated times and stimulated with latex beads (1 × 10⁷, MOS 50) for 1 hr. Statistical analysis using Kruskal–Wallis one‐way analysis of variance and Dunn's post‐hoc multiple comparison, ** P < 0·01.
To confirm that the signal detected by cellular fluorescence was indeed derived from internalized as opposed to surface‐bound bacterial particles, we visualized macrophages after particle uptake by confocal microscopy. The majority of particles were internalized relative to the plasma membrane as visualized with the membrane stain CellMask and were inaccessible to an anti‐S. aureus antibody (Fig. 3a,b, and in a three‐dimensional rendering, see Supplementary material, Video S1). Permeabilization of the cells before the addition of the anti‐S. aureus antibody confirmed the ability of this antibody to label intracellular S. aureus particles (Fig. 3c). These data show that the MFI of bacterial particles measured by flow cytometry does indeed reflect phagocytosis.
Figure 3.
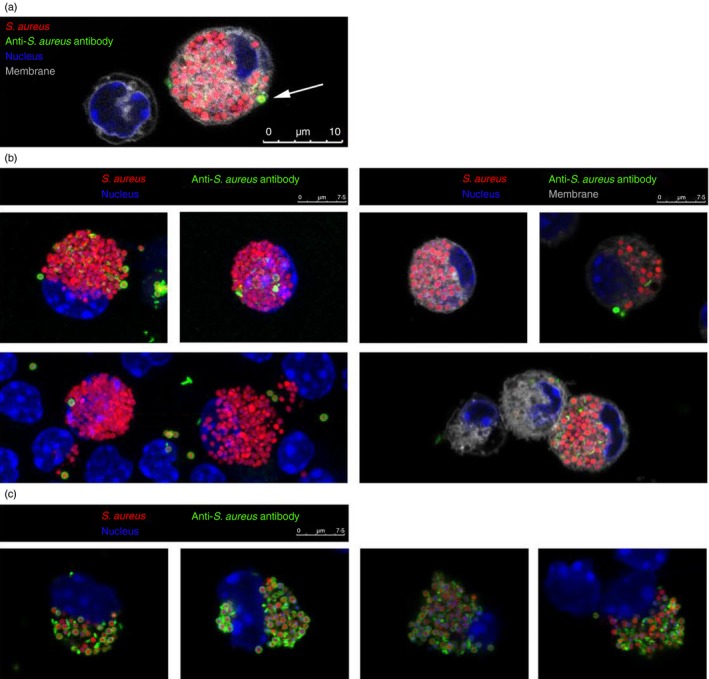
Confocal microscopy demonstrating internalization, rather than surface binding of particles. Microscopy analysis of mouse peritoneal macrophages stimulated for 1 hr with fluorescent Staphylococcus aureus bioparticles (red) and stained with a cell‐membrane‐impermeable anti‐S. aureus antibody (green) as well as membrane (grey) and nuclear (blue) dyes. (a) Representation of an S. aureus‐loaded cell. Arrow: particle within a phagocytic cup, as identifiable by the membrane stain (grey), is accessible to an anti‐S. aureus antibody (green). (b) Analysis of cells with (right) or without (left) membrane stain. (c) Co‐localization of S. aureus particles (red) and anti‐S. aureus stain (green) in cells permeabilized before anti‐S. aureus staining.
Similar to particle uptake, macrophages stimulated with bacteria or bacterial products such as LPS secrete cytokines in a manner dependent on the circadian time, with more cytokines secreted at the end of the light phase (see Supplementary material, Fig. S2a,b).20, 22, 23 To confirm that cytokine production is dependent on phagocytosis, peritoneal cells were pre‐incubated with increasing concentrations of Latrunculin A, which inhibits actin polymerization and phagocytosis. Both the efficiency of S. aureus uptake and production of IL‐6, IL‐10 and tumor necrosis factor were reduced by Latrunculin A in a dose‐dependent manner (Fig. 4a,b), confirming that functional phagocytosis at least partly contributes to the magnitude of cytokine release. Induction of mRNA for these cytokines was also inhibited by Latrunculin A, showing that reduction in cytokine production is affected at the level of transcription when phagocytosis is inhibited (Fig. 4c). This result underscores the possibility that oscillations in particle uptake may regulate oscillations in cytokine production by peritoneal macrophages ex vivo.
Figure 4.
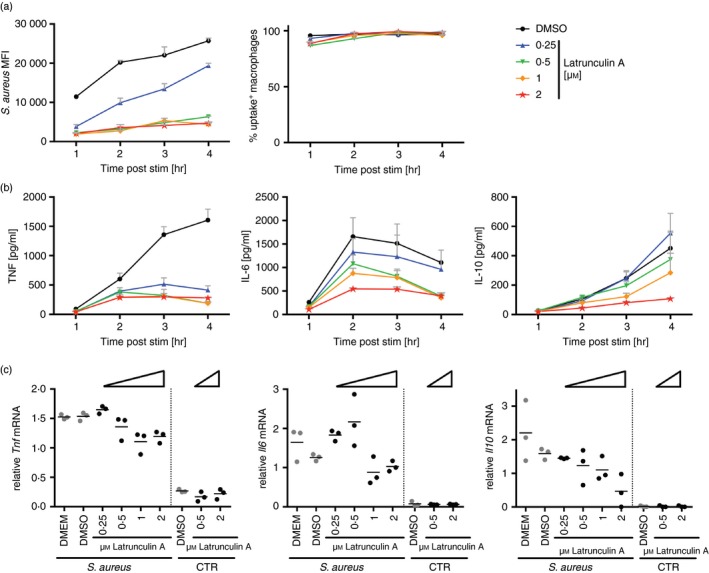
Cytokine secretion depends on uptake of bacterial particles. Time response of Staphylococcus aureus bioparticle‐stimulated peritoneal cells pre‐incubated with increasing amounts of Latrunculin A for 10 min. (a) Flow cytometry analysis of S. aureus uptake (left) (F 4,40 = 378·6, P < 0·0001) and percentage of uptake‐positive cells (right) (F 4,40 = 5·831, P = 0·0009) in the F4/80‐positive population. (b) Tumor necrosis factor (TNF) (F 4,40 = 68·62, P < 0·0001), interleukin‐6 (IL‐6) (F 4,40 = 7·462, P = 0·0001) and IL‐10 (F 4,40 = 3·983, P = 0·0082) protein abundance in the supernatant. (c) Tnf (P = 0·013), Il6 (P = 0·0068) and Il10 (P = 0·0235) mRNA abundance following 3 hr of incubation. Statistical analysis was performed using two‐way analysis of variance, with significance given for the treatment effect (a, b), or ordinary one‐way analysis of variance of S. aureus‐treated samples (c).
Uptake capacity ex vivo over 12 hr is independent of the cell‐autonomous circadian clock and the scavenger receptor CD36
Daily changes in phenotypes observed in a particular cell type may be controlled by the cell‐intrinsic clock, but extrinsic, systemic signals also have the potential to program cells for different responses at certain times of the day. Peritoneal lavage cells exhibit diurnal variation in gene expression of Bmal1 (Fig. 5a), and most of this oscillation originates from macrophages, as only F4/80‐positive cells display significant variation in Bmal1 over 12 hr (Fig. 5b). This is also seen for Reverba, another central component of the clock, which fluctuates out of phase from Bmal1 (Fig. 5c).
Figure 5.
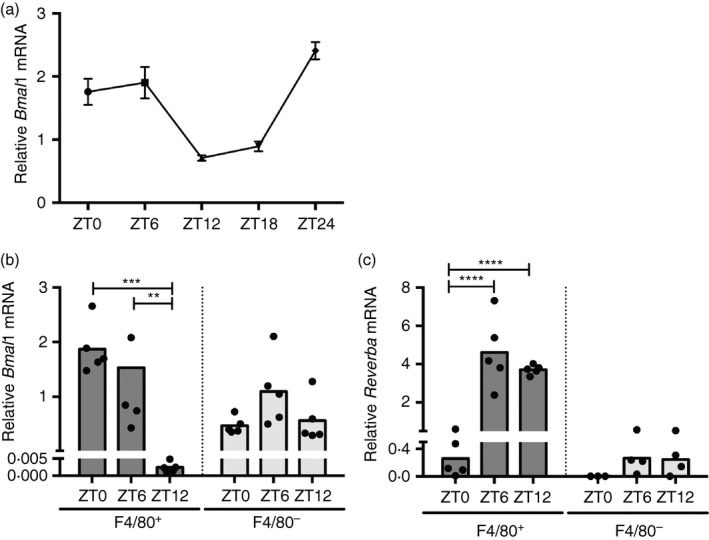
A functional molecular clock exists in peritoneal macrophages. (a) Rhythmic expression of Bmal1 in peritoneal cells over the course of a day as measured by quantitative polymerase chain reaction. Adjusted P‐value according to JKT Cycle analysis: P < 0·000001. (b, c) Bmal1 (F 2,24 = 5·766, P = 0·009) (b) and Reverba (F 2,20 = 12·72, P = 0·0003) (c) mRNA expression in F4/80+ and F4/80− FACS‐sorted peritoneal cells isolated at the indicated time‐points. Statistical analysis using two‐way analysis of variance and Sidak's multiple comparison test, **P < 0·01, ***P < 0·001, ****P < 0·0001.
To further investigate the role of the macrophage clock in particle uptake across 12 hr, we used mice where the circadian clock is specifically disrupted in the myeloid lineage (BMAL1fl/flLyzM‐Cre+/+). As expected, deletion of Bmal1, as previously confirmed on protein and transcriptional level throughout the day,23 abrogated fluctuations in Reverba (Fig. 6a,b), indicating successful disruption of the molecular clock. Bmal1 mRNA remained detectable at steady levels in knockout samples, as transcription was measured in the entire peritoneal washout, which includes non‐myeloid cells that continue Bmal1 expression in BMAL1fl/flLyzM‐Cre+/+ animals (Fig. 6a).
Figure 6.
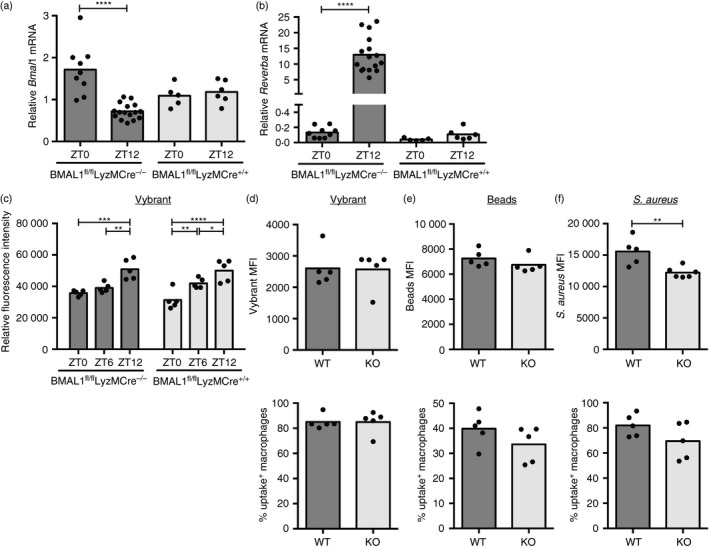
The molecular clock in macrophages is dispensable for ex vivo uptake of various particles. Bmal1 (a) and Reverba (b) mRNA expression at ZT0 and ZT12 in Bmal1‐deficient BMAL1fl/flLyzMCre+/+ mice and Bmal1‐sufficient BMAL1fl/flLyzMCre−/− control animals. Data shown are compiled from two independent experiments. (c) Uptake capacity as measured by fluorescence intensity in peritoneal cells isolated from BMAL1fl/flLyzM‐Cre+/+ or BMAL1fl/flLyzM‐Cre−/− control mice at the indicated times and stimulated for 1 hr with fluorescent latex beads (multiplicity of stimulation 500) (genotype effect: F 1,24 = 0·196, P = 0·662). Statistical analysis using two‐way analysis of variance and Sidak's multiple comparisons test comparing ZT0 and ZT12 within the genotype, *P < 0·05, **P < 0·01, ***P < 0·001, ****P < 0·0001. (d–f) Mean fluorescence intensity (MFI) (top) and percentage of uptake‐positive cells (bottom) in the F4/80‐positive fraction of peritoneal cells isolated from BMAL1fl/flLyzM‐Cre+/+ (knockout; KO) or BMAL1fl/flLyzM‐Cre−/− (wild‐type; WT) control mice at ZT6 and stimulated for 1 hr with indicated fluorescent particles. No statistical significance according to Mann–Whitney, if not indicated otherwise.
When we analyzed particle and bacterial uptake in peritoneal cells from Bmal1 conditional knockout mice, they displayed similar levels in the amount of ingested material, as well as the percentage of uptake‐positive macrophages compared with controls, with more efficient uptake at ZT12, despite lacking cell‐intrinsic clock function (Fig. 6c). We found similar uptake of Vybrant and latex particles as well as S. aureus in Bmal1‐deficient macrophages, confirming that this was not unique to a particular type of particle (Fig. 6d–f). Kinetics of phagocytosis were similar between control and Bmal1 knockout peritoneal as well as bone‐marrow‐derived macrophages, further supporting that uptake is independent of the cell‐intrinsic molecular clock (see Supplementary material, Fig. S3a–c). Notably, ex vivo uptake kinetics in peritoneal macrophages display continuously low uptake over the first 30 min, arguing for a defect rather than a delay in ZT0 compared with ZT12 stimulated cells (Fig. 4d). As comparable percentages of the F4/80+ macrophages were found in the peritoneal washout of BMAL1fl/flLysM‐Cre+/+ and BMAL1fl/flLysM‐Cre−/− animals (see Supplementary material, Fig. S3e), uptake capacity between wild‐type and knockout samples also did not appear to be affected by population heterogeneity.
Recently, the class B scavenger receptor CD36, which was originally identified as mediating ingestion of modified low‐density lipoprotein34 has been implicated in uptake of bacteria35 and regulation of inflammatory pathways,36 making CD36 a potential candidate to mediate daily oscillations in phagocytosis and cytokine response. CD36 was highly expressed in F4/80+ peritoneal macrophages and although CD36 mRNA was modestly increased at ZT6, surface levels of CD36 were significantly elevated at ZT12 over other time‐points (Fig. 7a,b), correlating with the time where we observed increased particle phagocytosis. However, phagocytic uptake of E. coli and S. aureus bioparticles was similar in CD36 wild‐type and knockout peritoneal macrophages ex vivo, as well as in vivo (Fig. 7c,d), with the absence of CD36 confirmed by flow cytometry (Fig. 7e). Hence, these data do not support a role for CD36 in phagocytosis of these bacterial particles.
Figure 7.
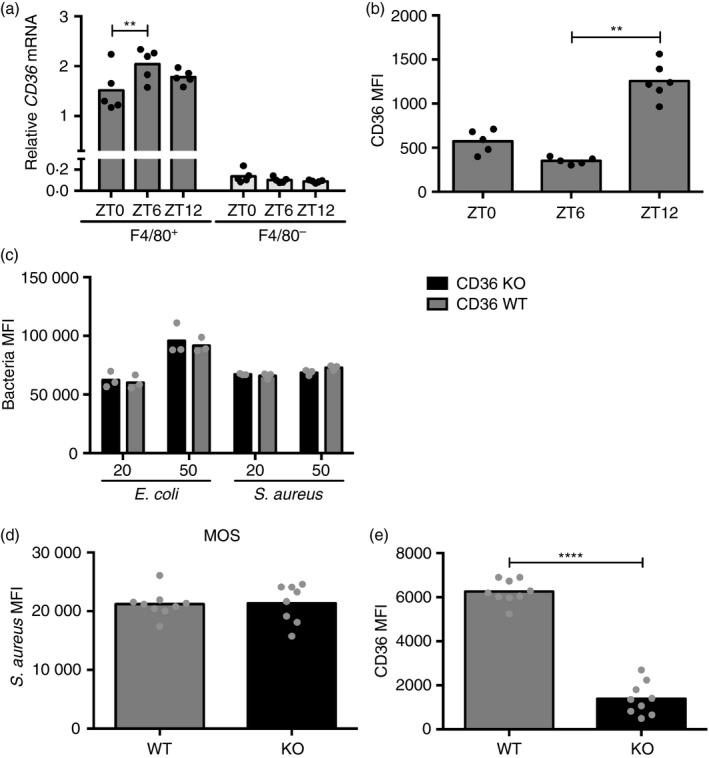
CD36 surface abundance is time‐of‐day‐dependent, but does not regulate uptake of Escherichia coli or Staphylococcus aureus. (a) Expression profile of Cd36 in F4/80+ and F4/80− FACS‐sorted peritoneal cells isolated at the indicated time‐points. Statistical analysis using two‐way analysis of variance (anova) (F 2,24 = 3·56, P = 0·0443) and Sidak's multiple comparison test within the populations (**P < 0·01). (b) CD36 surface abundance in F4/80+ peritoneal macrophages extracted at the indicated times (P < 0·0001). Statistical analysis using Kruskal–Wallis one‐way anova and Dunn's post‐hoc multiple comparison. **P < 0·01. (c) Flow cytometry analysis of fluorescence in F4/80+ peritoneal Cd36 wild‐type (WT) or knockout (KO) cells incubated with fluorescent E. coli or S. aureus particles for 1 hr at a multiplicity of stimulation of 20 or 50 as indicated. Statistical analysis of genotype effect with two‐way anova and Sidak's post‐hoc test (E. coli: F 1,8 = 0·4028, P = 0·5434; S. aureus: F 1,8 = 1·639, P = 0·2363). (d, e) One hour in vivo stimulation of CD36 WT and KO mice with 2 × 10⁶ fluorescent S. aureus particles intraperitoneally followed by peritoneal cell extraction and analysis of S. aureus uptake (P = 0·6730) (d) and CD36 surface abundance (****P<0·0001) (e) in F4/80+ cells by flow cytometry. Compiled data from two independent experiments. Statistical analysis according to Mann–Whitney test.
Particle ingestion in vivo is independent of the time of day and the molecular clock
To investigate how these findings applied to in vivo uptake of bacteria more generally, we injected S. aureus bioparticles intraperitoneally at concentrations comparable to ex vivo studies at different times of the day, and measured uptake by peritoneal macrophages harvested 1 hr later. Unexpectedly, macrophages in the peritoneum did not recapitulate the variations in particle uptake that we observed ex vivo between ZT0 and ZT12. Even over a time course with data‐points every 3 hr over the course of a day, uptake was similar at these time‐points (Fig. 8a). As the percentage of uptake‐positive macrophages was almost 100% (Fig. 8a), and therefore significantly higher compared with the previous ex vivo studies (Figs 1d, 2b, 6f), we titrated the amount of injected bioparticles to find a dose recapitulating the initial percentage of uptake‐positive macrophages (see Supplementary material, Fig. S4b). At the optimized lower dose of 0·4 × 106 particles per injection these experiments also failed to yield time‐of‐day variation in particle uptake (Fig. 8b), and this lack of variation did not appear to be related to differences in peritoneal cell subsets at different times of the day, as the percentage of selected immune cell populations following intraperitoneal stimulation with bacterial particles was similar independent of time of day (see Supplementary material, Fig. S4c–e).
Figure 8.
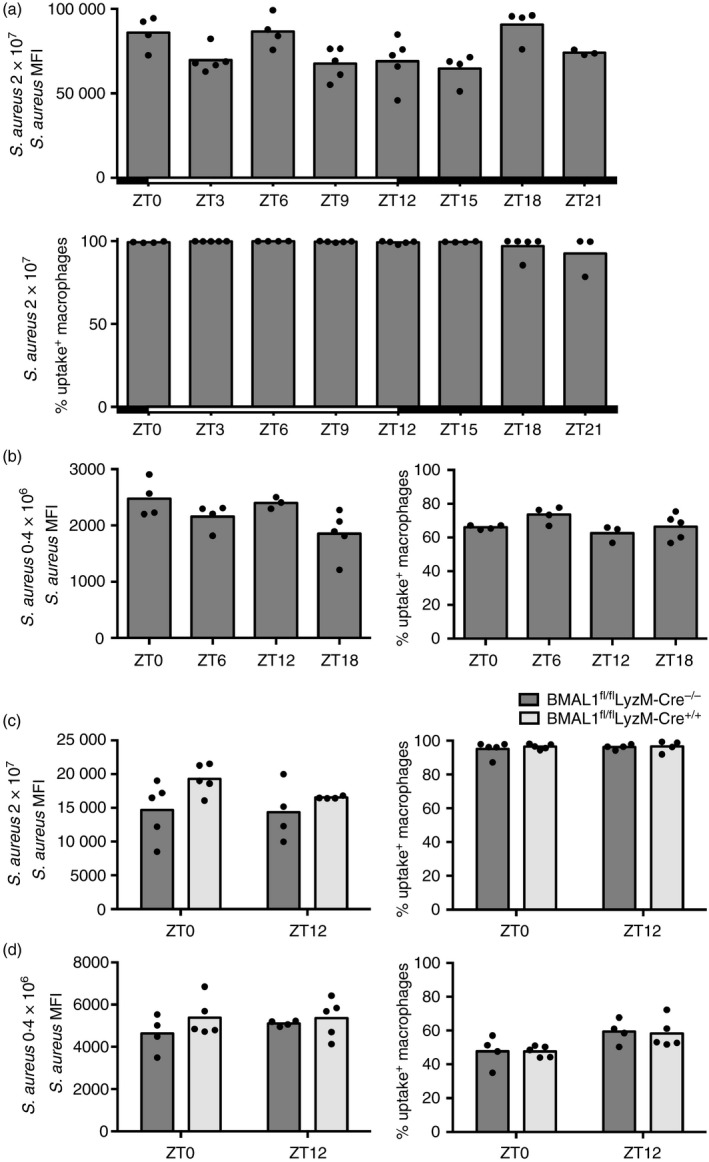
Staphylococcus aureus ingestion by peritoneal macrophages is steady over the course of a day in vivo. Uptake capacity of F4/80+ peritoneal cells isolated 1 hr after intraperitoneal delivery of indicated amounts of fluorescent S. aureus particles. (a) Mean fluorescence intensity (MFI) (top) (P = 0·0121) and percentage of uptake positive cells (bottom) (P = 0·0474) following in vivo stimulation of wild‐type (WT) mice with 2 × 10⁷ S. aureus particles. (b) MFI (P = 0·038) (left) and percentage of uptake‐positive cells (P = 0·1129) (right) following in vivo stimulation of WT mice with 0·4 × 106 S. aureus particles. Statistical analysis using Kruskal–Wallis one‐way analysis of variance (anova) and Dunn's post‐hoc multiple comparison. No significant differences were found between any time‐points by post‐hoc comparisons. Mice stimulated between ZT12 and ZT21 were housed in reverse‐light‐cycle rooms, while ZT0 to ZT9 stimulated animals remained in a conventional‐light‐cycle environment. (c) MFI (F 1,14 = 0·619, P = 0·4445) (left) and percentage of uptake positive cells (F 1,14 = 0·1436, P = 0·7078) (right) following in vivo stimulation of BMAL1fl/flLyzM‐Cre+/+ or BMAL1fl/flLyzM‐Cre−/− control animals with 2 × 10⁷ S. aureus particles for 2 hr. (d) MFI (F 1,14 = 0·4288, P = 0·5232) (left) and percentage of uptake‐positive cells (F 1,14 = 0·02332, P = 0·8808) (right) following in vivo stimulation of BMAL1fl/flLyzM‐Cre+/+ or BMAL1fl/flLyzM‐Cre−/− control animals with 0·4 × 106 S. aureus particles. Statistical analysis was performed using two‐way anova and Sidak's post‐hoc test. No significant differences were found by post‐hoc comparisons.
Congruent with our ex vivo findings, the cell‐autonomous macrophage clock also did not affect uptake capacity of bacteria in vivo as S. aureus was phagocytosed similarly in BMAL1fl/flLyzM‐Cre+/+ and control mice (Fig. 8c,d). Together these data demonstrate that particle uptake in vivo – in contrast to ex vivo – is not dependent on time of day and the molecular clock.
Macrophage cytokine production in response to bacteria is dependent on time‐of‐day in vivo
Although macrophage phagocytic capacity did not display time‐of‐day variation in vivo, we investigated whether cytokine production in response to bacterial particle stimulation in the peritoneum was still dependent on time‐of‐day. Consistent with previous studies with LPS,20, 22, 23 induction of serum IL‐6, tumor necrosis factor and IL‐10 was increased after intraperitoneal stimulation with heat‐inactivated S. aureus at ZT12 compared with ZT0 (Fig. 9a). Transcript levels of these cytokines in peritoneal cells were similarly increased at ZT12 compared with ZT0, paralleled by the expected circadian expression of the clock genes Dbp and Reverba without bacterial stimulation (Fig. 9b,c). Furthermore, following in vivo stimulation with heat‐inactivated S. aureus at ZT0, when Bmal1 expression is elevated in wild‐type animals, mRNA levels of Il6, Tnf, Il10 and Il1b in peritoneal cells extracted from BMAL1‐deficient BMAL1fl/flLyzM‐Cre+/+ mice were increased compared with BMAL1‐sufficient BMAL1fl/flLyzM‐Cre−/− control animals (Fig. 9d). Taken together with the data showing that phagocytic capacity of Bmal1 wild‐type and knockout cells are similar (Fig. 8c,d), this provides compelling evidence that cytokine production is dissociated from macrophage phagocytic capacity in vivo.
Figure 9.
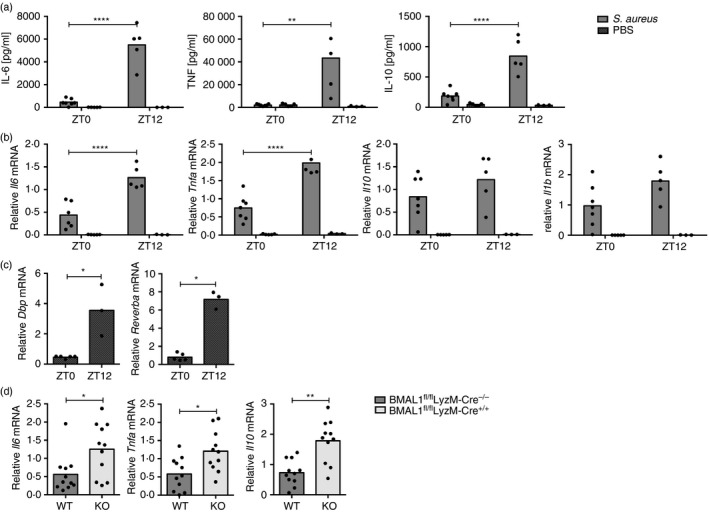
In vivo cytokine production is dependent on time of day and an intact molecular clock. Cytokine abundance 1·5 hr after intraperitoneal stimulation with 2 × 10⁷ Staphylococcus aureus particles or phosphate‐buffered saline (PBS) control at the indicated times. (a) Serum cytokines in wild‐type (WT) mice. Interleukin‐6 (IL‐6), tumor necrosis factor (TNF), IL‐10. (b) mRNA expression levels in peritoneal cells of WT mice. Il6, Tnf, Il10, Il1b. Statistical analysis using two‐way analysis of variance (anova) and Sidak's multiple comparisons test. (c) Dbp (left) and Reverba (right) mRNA expression in peritoneal cells isolated from control PBS‐stimulated WT mice. (d) mRNA abundance in peritoneal cells from BMAL1fl/flLyzM‐Cre+/+ or BMAL1fl/flLyzM‐Cre−/− control animals stimulated at ZT0. Compiled data from two independent experiments 1.5–2 hr post stimulation. Statistical analysis was performed using Mann–Whitney test, *P < 0·05, **P < 0·01, ***P < 0·001, ****P < 0·0001).
Discussion
Here we investigated the influence of the circadian system on phagocytosis by peritoneal macrophages and the consequences for production of pro‐inflammatory cytokines. We found that phagocytic ingestion of bacterial particles by peritoneal macrophages is independent of the cell‐intrinsic molecular clock, and shows time‐of‐day variation ex vivo, but not in vivo, whereas temporal changes in the cytokine response are seen in both situations. This suggests that mechanisms other than phagocytic uptake regulate time‐dependent variation in cytokine responses. This dissociation of phagocytosis and cytokine response has already been identified in other models26 and considering the abundance of distinct macrophage subsets in the peritoneal cavity,37 such as large and small macrophages, this may be further pronounced in peritoneal exudate cells.
A multitude of circadian outputs, from gene regulation to post‐transcriptional modification, are mediated directly by the cell‐intrinsic molecular clock.38, 39, 40 However, systemic signals that are used to synchronize pacemakers within an organism may also directly induce circadian outputs independently of a functional cell‐autonomous clock. Such signals may range from temperature cycles to metabolites and could target the phagocytic machinery, actin‐dependent membrane changes or the presence of uptake receptors on the surface. CD36, a scavenger receptor that has been implicated in uptake of Gram‐positive and Gram‐negative bacteria,35 did not display variation on mRNA level across 12 hr, but was increased at the cell surface at times when mice appear most susceptible to inflammatory stimulation.8, 9 Protein levels may be regulated by systemic cues, such as the feeding cycle, and indeed protein abundance and subcellular localization of CD36 have previously been demonstrated to be modulated by nutritional cues.41, 42, 43 However, we did not find phagocytosis of the bacterial particles tested to be dependent on CD36, arguing against the possibility that CD36 mediates changes in the phagocytic capacity of peritoneal macrophages at different times of the day.
Although the independence of bacterial uptake of CD36 was consistent between in vivo and ex vivo studies, we found that uptake capacity by peritoneal macrophages was only variable at different times of the day ex vivo but not in vivo. A number of possibilities may explain this discrepancy. The process of cell extraction may affect the cell state differently at different times of the day (altering poising of the cell), or, mechanisms that are only in place in an in vivo environment, such as temperature fluctuations, autocrine or humoral and neuronal signals, may mask the differences that are seen ex vivo.44, 45 The trauma of injection may also induce an inflammatory response that can potentially intensify uptake in vivo and overcome changes seen ex vivo. Notably, a possible role for melatonin was eliminated as all mice we used carry a naturally occurring deletion in the serotonin N‐acetyltransferase (arylalkylamine N‐acetyltransferase, AANAT) gene, causing a defect in the production of melatonin.46
Another mechanism that may potentially explain differences between in vivo and ex vivo results would be Fc‐receptor47 and complement‐mediated ingestion.48, 49 Natural antibodies and opsonins are present in the serum and can bind material to enhance clearance by phagocytes. In the serum‐free conditions that we used in the ex vivo assays throughout this study, these factors are not present to prevent Fc‐ receptor and complement‐mediated uptake, and it is possible that Fc‐ or complement‐mediated uptake in vivo masks cell‐intrinsic diurnal variation in macrophage phagocytic capacity. Genetic deletion of Fc‐receptors on phagocytes or core complement factors in vivo could be used to investigate these possibilities. Whatever the explanation for the divergence between diurnal variation in macrophage phagocytosis ex vivo and in vivo, our findings demonstrate that in the context of infection, ex vivo studies may not recapitulate the in vivo state to allow translation of findings to an intact animal or human, and suggests that chrono‐immunological findings obtained ex vivo should be confirmed with in vivo experiments.
As this study is limited to peritoneal macrophages, it should be noted that it is possible that macrophages from other tissues or other cell types may act differently in terms of circadian control of phagocytosis, and in vivo daily oscillations in phagocytosis have indeed been previously described in Drosophila.28 Further, F4/80 was used as the identifier of macrophages although other cell types, such as eosinophils and dendritic cells, can also express this marker. Considering the very low abundance of these cell types in the peritoneum at all circadian times (see Supplementary material, Fig. S1b), these cell types do not appear to be contributory. In some experiments, treatments at the different ZTs were not performed simultaneously, but at different times of the day. However, as experiments using mice harvested simultaneously from reverse and conventional light cycle rooms (Figs 1 and 8) generated similar results compared with sequential testing throughout the day, the differences that were seen in ex vivo uptake studies cannot solely be accounted for by this technical variation.
Although in vivo uptake in the wild‐type state was investigated thoroughly with 3‐hr time‐points over a full diurnal cycle, the remainder of the study focused on two to three time‐points over a 24‐hr interval. Although this limited sampling substantiates the existence of temporal variation in phagocytosis, it cannot confirm a diurnal or circadian phenotype. Two complete 24 hr cycles with several sampling times would be necessary to conclude diurnal rhythmicity, and only a similar approach under constant conditions would suffice for circadian oscillations.
It is clear that the circadian system regulates many aspects of physiology on multiple levels, ranging from epigenetic modifications and metabolic state, to post‐transcriptional and post‐translational regulation of specific proteins.50, 51, 52 In recent years, much progress has been made understanding different aspects of this in the immune system, and a multitude of phenotypes, such as cytokine production19, 23, 53, 54 were attributed to the cell‐autonomous clock. Our data suggest that phagocytosis is regulated independently of the molecular clock and does not necessarily translate into variation in cytokine production. The diurnal, molecular clock‐dependent cytokine production in vivo as well as ex vivo 13, 19, 20, 21, 22, 23 paralleled by significantly different patterns in uptake capacity between these two models additionally underscores that cytokine production can be regulated independently of phagocytic particle ingestion and argues that other pathways, such as Toll‐like receptor signaling,55 may be of greater importance for rhythmic cytokine response than phagocytic capacity. Considering that the response to bacterial infection is a balancing act between immune suppression to limit tissue damage and the benefits of promoting clearance of the infectious agent as well as cell corpses from apoptotic cells, the differential regulation of cytokine response and phagocytic capacity we have found may provide a strategy to target the cell‐intrinsic myeloid clock to inhibit pro‐inflammatory function, while maintaining the beneficial properties of phagocytosis in bacterial clearance. More generally, this study accentuates the importance of considering the circadian clock in future macrophage research.
Disclosures
RMS has been an employee of Novartis since June 2018.
Supporting information
Figure S1. Immune cell subsets within the peritoneal cavity display similar abundance over the course of a day.
Figure S2. Ex vivo cytokine production is dependent on time of day.
Figure S3. Kinetics of bacterial particle uptake in macrophages and the abundance of F4/80+ cells in the peritoneum is not impacted by Bmal1 deletion.
Figure S4 Staphylococcus aureus in vivo titration and immune cell abundance in the peritoneum post stimulation.
Video S1 Uptake three‐dimensional model.
Acknowledgements
We thank Katie Fairhurst for assistance with RNA preparation; Evelyn Ralston, Kristina Zaal and the NIAMS Light Microscopy Core for assistance with the confocal microscopy; Barry Moran and Jim Simone for flow cytometry support; Tom Barr for cell sorting, Jay Hinton for providing the fluorescent E. coli strain; NEI for mouse support and for sharing animal space; as well as Karen Hartmann and Michelle Ploch for their contributions as trainees in the laboratory. SSG designed and executed experiments and prepared the manuscript, AMC designed experiments and prepared the manuscript, RMS and LAJO designed experiments, supervised the project, and prepared the manuscript. This work was supported by the intramural research program of NIAMS. SSG was supported by the Wellcome Trust‐ NIH PhD Scholars Program.
This article has been contributed to by US Government employees and their work is in the public domain in the USA
References
- 1. Moore RY, Eichler VB. Loss of a circadian adrenal corticosterone rhythm following suprachiasmatic lesions in the rat. Brain Res 1972; 42:201–6. [DOI] [PubMed] [Google Scholar]
- 2. Stephan FK, Zucker I. Circadian rhythms in drinking behavior and locomotor activity of rats are eliminated by hypothalamic lesions. Proc Natl Acad Sci USA 1972; 69:1583–6. [DOI] [PMC free article] [PubMed] [Google Scholar]
- 3. Gekakis N, Staknis D, Nguyen HB, Davis FC, Wilsbacher LD, King DP et al Role of the CLOCK protein in the mammalian circadian mechanism. Science 1998; 280:1564–9. [DOI] [PubMed] [Google Scholar]
- 4. Hao H, Allen DL, Hardin PE. A circadian enhancer mediates PER‐dependent mRNA cycling in Drosophila melanogaster . Mol Cell Biol 1997; 17:3687–93. [DOI] [PMC free article] [PubMed] [Google Scholar]
- 5. Reppert SM, Weaver DR. Coordination of circadian timing in mammals. Nature 2002; 418:935–41. [DOI] [PubMed] [Google Scholar]
- 6. Bunger MK, Wilsbacher LD, Moran SM, Clendenin C, Radcliffe LA, Hogenesch JB et al Mop3 is an essential component of the master circadian pacemaker in mammals. Cell 2000; 103:1009–17. [DOI] [PMC free article] [PubMed] [Google Scholar]
- 7. Zhang R, Lahens NF, Ballance HI, Hughes ME, Hogenesch JB. A circadian gene expression atlas in mammals: implications for biology and medicine. Proc Natl Acad Sci USA 2014; 111:16219–24. [DOI] [PMC free article] [PubMed] [Google Scholar]
- 8. Halberg F, Johnson EA, Brown BW, Bittner JJ. Susceptibility rhythm to E. coli endotoxin and bioassay. Proc Soc Exp Biol Med, 1960; 103:142–4. [DOI] [PubMed] [Google Scholar]
- 9. Hrushesky WJ, Langevin T, Kim YJ, Wood PA. Circadian dynamics of tumor necrosis factor α (cachectin) lethality. J Exp Med 1994; 180:1059–65. [DOI] [PMC free article] [PubMed] [Google Scholar]
- 10. Feigin RD, Middelkamp JN, Reed C. Circadian rhythmicity in susceptibility of mice to sublethal Coxsackie B3 infection. Nat New Biol 1972; 240:57–8. [DOI] [PubMed] [Google Scholar]
- 11. Born J, Lange T, Hansen K, Mölle M, Fehm HL. Effects of sleep and circadian rhythm on human circulating immune cells. J Immunol 1997; 158:4454–64. [PubMed] [Google Scholar]
- 12. Adams KL, Castanon‐Cervantes O, Evans JA, Davidson AJ. Environmental circadian disruption elevates the IL‐6 response to lipopolysaccharide in blood. J Biol Rhythms 2013; 28:272–7. [DOI] [PMC free article] [PubMed] [Google Scholar]
- 13. Nguyen KD, Fentress SJ, Qiu Y, Yun K, Cox JS, Chawla A. Circadian gene Bmal1 regulates diurnal oscillations of Ly6Chi inflammatory monocytes. Science 2013; 341:1483–8. [DOI] [PMC free article] [PubMed] [Google Scholar]
- 14. Pelegrí C, Vilaplana J, Castellote C. Circadian rhythms in surface molecules of rat blood lymphocytes. Am J Physiol Cell Physiol, 2003; 284:p. [DOI] [PubMed] [Google Scholar]
- 15. Haus E, Smolensky MH. Biologic rhythms in the immune system. Chronobiol Int 1999; 16:581–622. [DOI] [PubMed] [Google Scholar]
- 16. Scheiermann C, Kunisaki Y, Lucas D, Chow A, Jang JE, Zhang D et al Adrenergic nerves govern circadian leukocyte recruitment to tissues. Immunity 2012; 37:290–301. [DOI] [PMC free article] [PubMed] [Google Scholar]
- 17. Dimitrov S, Benedict C, Heutling D, Westermann J, Born J, Lange T. Cortisol and epinephrine control opposing circadian rhythms in T cell subsets. Blood 2009; 113:5134–43. [DOI] [PMC free article] [PubMed] [Google Scholar]
- 18. Hoffman AE, Zheng T, Stevens RG, Ba Y, Zhang Y, Leaderer D et al Clock–cancer connection in non‐Hodgkin's lymphoma: a genetic association study and pathway analysis of the circadian gene cryptochrome 2. Can Res 2009; 69:3605–13. [DOI] [PMC free article] [PubMed] [Google Scholar]
- 19. Gibbs JE, Blaikley J, Beesley S, Matthews L, Simpson KD, Boyce SH et al The nuclear receptor REV‐ERBα mediates circadian regulation of innate immunity through selective regulation of inflammatory cytokines. Proc Natl Acad Sci U S A 2012; 109:582–7. [DOI] [PMC free article] [PubMed] [Google Scholar]
- 20. Petrovsky N, McNair P, Harrison LC. Diurnal rhythms of pro‐inflammatory cytokines: regulation by plasma cortisol and therapeutic implications. Cytokine 1998; 10:307–12. [DOI] [PubMed] [Google Scholar]
- 21. Alamili M, Bendtzen K, Lykkesfeldt J, Rosenberg J, Gögenur I. Pronounced inflammatory response to endotoxaemia during nighttime: a randomised cross‐over trial. PLoS ONE 2014; 9:e87413. [DOI] [PMC free article] [PubMed] [Google Scholar]
- 22. Marpegan L, Leone MJ, Katz ME, Sobrero PM, Bekinstein TA, Golombek DA. Diurnal variation in endotoxin‐induced mortality in mice: correlation with proinflammatory factors. Chronobiol Int 2009; 26:1430–42. [DOI] [PubMed] [Google Scholar]
- 23. Curtis AM, Fagundes CT, Yang G, Palsson‐McDermott EM, Wochal P, McGettrick AF et al Circadian control of innate immunity in macrophages by miR‐155 targeting Bmal1. Proc Natl Acad Sci U S A 2015; 112:7231–6. [DOI] [PMC free article] [PubMed] [Google Scholar]
- 24. Underhill DM, Ozinsky A. Phagocytosis of microbes: complexity in action. Annu Rev Immunol 2002; 20:825–52. [DOI] [PubMed] [Google Scholar]
- 25. Underhill DM, Goodridge HS. Information processing during phagocytosis. Nat Rev Immunol 2012; 12:492–502. [DOI] [PMC free article] [PubMed] [Google Scholar]
- 26. Gold ES, Underhill DM, Morrissette NS, Guo J, McNiven MA, Aderem A. Dynamin 2 is required for phagocytosis in macrophages. J Exp Med 1999; 190:1849–56. [DOI] [PMC free article] [PubMed] [Google Scholar]
- 27. Hayashi M, Shimba S, Tezuka M. Characterization of the molecular clock in mouse peritoneal macrophages. Biol Pharm Bull 2007; 30:621–6. [DOI] [PubMed] [Google Scholar]
- 28. Stone EF, Fulton BO, Ayres JS, Pham LN, Ziauddin J, Shirasu‐Hiza MM. The circadian clock protein timeless regulates phagocytosis of bacteria in Drosophila . PLoS Pathog 2012; 8:e1002445. [DOI] [PMC free article] [PubMed] [Google Scholar]
- 29. Oliva‐Ramírez J, Moreno‐Altamirano MM, Pineda‐Olvera B, Cauich‐Sánchez P, Sánchez‐García FJ. Crosstalk between circadian rhythmicity, mitochondrial dynamics and macrophage bactericidal activity. Immunology 2014; 143:490–7. [DOI] [PMC free article] [PubMed] [Google Scholar]
- 30. Rodríguez AB, Marchena JM, Nogales G, Durán J, Barriga C. Correlation between the circadian rhythm of melatonin, phagocytosis, and superoxide anion levels in ring dove heterophils. J Pineal Res 1999; 26:35–42. [DOI] [PubMed] [Google Scholar]
- 31. Hriscu ML. Modulatory factors of circadian phagocytic activity. Ann N Y Acad Sci 2005; 1057:403–30. [DOI] [PubMed] [Google Scholar]
- 32. Pires‐Lapa MA, Tamura EK, Salustiano EM, Markus RP. Melatonin synthesis in human colostrum mononuclear cells enhances dectin‐1‐mediated phagocytosis by mononuclear cells. J Pineal Res 2013; 55:240–6. [DOI] [PubMed] [Google Scholar]
- 33. Hughes ME, Hogenesch JB, Kornacker K. JTK_CYCLE: an efficient nonparametric algorithm for detecting rhythmic components in genome‐scale data sets. J Biol Rhythms 2010; 25:372–80. [DOI] [PMC free article] [PubMed] [Google Scholar]
- 34. Endemann G, Stanton LW, Madden KS, Bryant CM, White RT, Protter AA. CD36 is a receptor for oxidized low density lipoprotein. J Biol Chem 1993; 268:11811–6. [PubMed] [Google Scholar]
- 35. Stuart LM, Deng J, Silver JM, Takahashi K, Tseng AA, Hennessy EJ et al Response to Staphylococcus aureus requires CD36‐mediated phagocytosis triggered by the COOH‐terminal cytoplasmic domain. J Cell Biol 2005; 170:477–85. [DOI] [PMC free article] [PubMed] [Google Scholar]
- 36. Sheedy FJ, Grebe A, Rayner KJ, Kalantari P, Ramkhelawon B, Carpenter SB et al CD36 coordinates NLRP3 inflammasome activation by facilitating intracellular nucleation of soluble ligands into particulate ligands in sterile inflammation. Nat Immunol 2013; 14:812–20. [DOI] [PMC free article] [PubMed] [Google Scholar]
- 37. Cassado Ados A, D'Imperio Lima MR, Bortoluci KR. Revisiting mouse peritoneal macrophages: heterogeneity, development, and function. Front Immunol, 2015; 6:225. [DOI] [PMC free article] [PubMed] [Google Scholar]
- 38. Ripperger JA, Schibler U. Rhythmic CLOCK‐BMAL1 binding to multiple E‐box motifs drives circadian Dbp transcription and chromatin transitions. Nat Genet 2006; 38:369–74. [DOI] [PubMed] [Google Scholar]
- 39. Peek CB, Affinati AH, Ramsey KM, Kuo HY, Yu W, Sena LA et al Circadian clock NAD+ cycle drives mitochondrial oxidative metabolism in mice. Science 2013; 342:1243417. [DOI] [PMC free article] [PubMed] [Google Scholar]
- 40. Doi M, Hirayama J, Sassone‐Corsi P. Circadian regulator CLOCK is a histone acetyltransferase. Cell 2006; 125:497–508. [DOI] [PubMed] [Google Scholar]
- 41. Cameron‐Smith D, Burke LM, Angus DJ, Tunstall RJ, Cox GR, Bonen A et al A short‐term, high‐fat diet up‐regulates lipid metabolism and gene expression in human skeletal muscle. Am J Clin Nutr 2003; 77:313–18. [DOI] [PubMed] [Google Scholar]
- 42. Greenwalt DE, Scheck SH, Rhinehart‐Jones T. Heart CD36 expression is increased in murine models of diabetes and in mice fed a high fat diet. J Clin Invest 1995; 96:1382–8. [DOI] [PMC free article] [PubMed] [Google Scholar]
- 43. Khalifeh‐Soltani A, McKleroy W, Sakuma S, Cheung YY, Tharp K, Qiu Y et al Mfge8 promotes obesity by mediating the uptake of dietary fats and serum fatty acids. Nat Med 2014; 20:175–83. [DOI] [PMC free article] [PubMed] [Google Scholar]
- 44. Aschoff J. Exogenous and endogenous components in circadian rhythms. Cold Spring Harb Symp Quant Biol 1960; 25:11–28. [DOI] [PubMed] [Google Scholar]
- 45. Rietveld WJ, Minors DS, Waterhouse JM. Circadian rhythms and masking: an overview. Chronobiol Int 1993; 10:306–12. [DOI] [PubMed] [Google Scholar]
- 46. Roseboom PH, Namboodiri MA, Zimonjic DB, Popescu NC, Rodriguez IR, Gastel JA et al Natural melatonin ‘knockdown’ in C57BL/6J mice: rare mechanism truncates serotonin N‐acetyltransferase. Brain Res Mol Brain Res 1998; 63:189–97. [DOI] [PubMed] [Google Scholar]
- 47. Swanson JA, Hoppe AD. The coordination of signaling during Fc receptor‐mediated phagocytosis. J Leukoc Biol 2004; 76:1093–103. [DOI] [PubMed] [Google Scholar]
- 48. Frank MM, Fries LF. The role of complement in inflammation and phagocytosis. Immunol Today 1991; 12:322–6. [DOI] [PubMed] [Google Scholar]
- 49. Kolev M, Le Friec G, Kemper C. Complement–tapping into new sites and effector systems. Nat Rev Immunol 2014; 14:811–20. [DOI] [PubMed] [Google Scholar]
- 50. Takahashi JS. Transcriptional architecture of the mammalian circadian clock. Nat Rev Genet, 2016; 18:164–79. [DOI] [PMC free article] [PubMed] [Google Scholar]
- 51. Roenneberg T, Merrow M. The circadian clock and human health. Curr Biol 2016; 26:R432–43. [DOI] [PubMed] [Google Scholar]
- 52. Roenneberg T, Allebrandt KV, Merrow M, Vetter C. Social jetlag and obesity. Curr Biol 2012; 22:939–43. [DOI] [PubMed] [Google Scholar]
- 53. Bellet MM, Deriu E, Liu JZ, Grimaldi B, Blaschitz C, Zeller M et al Circadian clock regulates the host response to Salmonella . Proc Natl Acad Sci U S A 2013; 110:9897–902. [DOI] [PMC free article] [PubMed] [Google Scholar]
- 54. Keller M, Mazuch J, Abraham U, Eom GD, Herzog ED, Volk HD et al A circadian clock in macrophages controls inflammatory immune responses. Proc Natl Acad Sci U S A 2009; 106:21407–12. [DOI] [PMC free article] [PubMed] [Google Scholar]
- 55. Silver AC, Arjona A, Walker WE, Fikrig E. The circadian clock controls toll‐like receptor 9‐mediated innate and adaptive immunity. Immunity 2012; 36:251–61. [DOI] [PMC free article] [PubMed] [Google Scholar]
Associated Data
This section collects any data citations, data availability statements, or supplementary materials included in this article.
Supplementary Materials
Figure S1. Immune cell subsets within the peritoneal cavity display similar abundance over the course of a day.
Figure S2. Ex vivo cytokine production is dependent on time of day.
Figure S3. Kinetics of bacterial particle uptake in macrophages and the abundance of F4/80+ cells in the peritoneum is not impacted by Bmal1 deletion.
Figure S4 Staphylococcus aureus in vivo titration and immune cell abundance in the peritoneum post stimulation.
Video S1 Uptake three‐dimensional model.