Abstract
Intensive study of the metabolome during the Douchi fermentation can provide new knowledge for optimizing the fermentation process. In this work, the metabolic characterization throughout the fermentation of Mucor racemosus Douchi was investigated using gas chromatography with time‐of‐flight mass spectrometry. A total of 511 peaks were found, and 114 metabolites were identified. The fermentation process was clearly distinguished into two main phases by principal components analysis and orthogonal partial least squares‐discriminant analysis. All the samples in the score plots were within the 95% Hotelling T 2 ellipse. Two separated clusters can be seen clearly in the score plot, which represents the two stages of fermentation: koji‐making (within 48 hr) and postfermentation (after 48 hr). Besides, clear separation and discrimination by both methods were found among different fermentation time within 15 days, while the discrimination cannot be found with more than 15 days of fermentation, indicating that the fermentation of Douchi was finished in 15 days. Due to the synergistic effect of protease and hydrolase accumulated in the early stage, proteins and other big molecular substances are rapidly hydrolyzed into a large number of small molecule components. However, the activity of enzymes decreased with the further fermentation, and some free amino acids were consumed in Maillard reaction. Therefore, there was no significant change in the content of small molecular substances after 15 days of fermentation. Furthermore, the levels of some metabolites such as alanine and lysine involved in the fermentation varied significantly throughout the processes. This study provides new insights for the metabolomics characteristics of Douchi fermentation.
Keywords: Douchi fermentation, GC‐TOF/MS, metabolic characterization, orthogonal partial least squares‐discriminant analysis, principal components analysis
1. INTRODUCTION
Douchi, as a large class of fermented soybean food, has played an important role in the diet of Asian countries and is becoming increasingly popular in the world. A number of functional factors in Douchi have been reported, such as effects of antioxidation, antihypertensive, and antidiabetic (Chen, Cheng, Yamaki, & Li, 2007; Chen, Wang, et al., 2011; Lu, Zhang, & Wu, 2010; Zhang, Eizo, Fan, & Li, 2010). According to different microorganisms, Chinese Douchi can be divided into three categories: bacteria type, Mucor‐type, and Aspergillus‐type. Natto is a famous bacteria‐type Douchi, and the market output value was at 3 billion US dollars every year. As a famous Mucor‐type Douchi, Mucor racemosus Douchi has become a famous health food and is gaining ever‐increasing popularity in China. However, M. racemosus Douchi has a longer production cycle and less production data. Much attention has been focused on the study of the Douchi fermentation (Chen, Xu, Wu, Xu, & Pan, 2011; He, Huang, Liang, Wu, & Zhou, 2016; Jiang, 2013). In the previous work, the optimal postfermentation condition for Mucor‐type Douchi was obtained with the help of the sensory evaluation and physicochemical indexes (Yang, Li, Chen, & Jiang, 2015). Besides, hyphenated techniques combined with electronic tongue by solid‐phase microextraction (SPME) followed by gas chromatography–mass spectrometry (GC‐MS) were used to compare the difference among three different drying methods of Douchi samples (Xie et al., 2016). In addition, the bioactive substances and overall antioxidant capacities of commercially fermented soy products were studied (Xu, Du, & Xu, 2015). The results show that phenolic profiles increased significantly after fermentation. The Douchi and fermented black bean sauce have the highest detected antioxidant profiles.
The fermentation of Douchi is very complicated. In the fermentation process, there are different kinds of microorganisms and enzymes, while the activities of each enzyme are different. The metabolites are complex, and the fermentation cycle is different. The fermentation of Douchi production was usually optimized according to the value of acidity and content of amino acid nitrogen, which are obviously not sufficient to characterize the complex process. To efficiently manipulate the fermentation process, it is necessary to give insights into the responses of the robust Mucor throughout the industrial process at the system level, especially at the metabolome level (Ding, Cheng, Xiao, Qiao, & Yuan, 2009). Intensive study of the metabolome during the Douchi fermentation can provide new knowledge for optimizing the fermentation process (Khakimov et al., 2017).
Changes in metabolic levels can be considered as the final response of biological systems to environmental changes (de Godoy Alves Filho et al., 2017; Ding et al., 2009; Ng'ong'ola‐Manani, Østlie, Mwangwela, & Wicklund, 2014; Shao, Zhou, & McGarvey, 2012). Metabolomics is a research field that can quantitatively measure small molecule metabolites in complex samples (He et al., 2009; Nicholson & Lindon, 2008; Spínola, Perestrelo, Câmara, & Castilho, 2015; Sun et al., 2015). For the Douchi fermentation, metabolomics focuses on comprehensive and quantitative analysis of metabolites during fermentation. A large number of high‐throughput technologies have been applied to the analysis of metabolites, such as GC‐MS (Khakimov et al., 2017; Li et al., 2019; Shao et al., 2012), liquid chromatography–mass spectrometry (LC‐MS) (Chalet, Hollebrands, Janssen, Augustijns, & Duchateau, 2018), nuclear magnetic resonance (NMR) (Marti et al., 2014; Velázquez Ríos et al., 2019; Zhu, Wang, & Chen, 2017), and capillary electrophoresis–mass spectrometry (Soga et al., 2003). Among the technologies in metabolomics, gas chromatography with time‐of‐flight mass spectrometry (GC‐TOF/MS) has been widely used due to the advantages of high resolution and sensitivity (Adebo et al., 2018; Ding et al., 2009; Salvatore, Gyong, Tobias, Cataldi, & Oliver, 2010; Sun et al., 2015; Tobias et al., 2009). With the help of the effective method, comprehensive and quantitative analysis of metabolites can be achieved, which can be used to characterize metabolic mechanism at molecular level (Zhang et al., 2017). However, the comprehensive research and optimization of the Douchi fermentation with GC‐TOF/MS technology are rarely reported so far.
The aim of the present study was to evaluate dynamics of the metabolome of the Douchi fermentation by using untargeted GC‐TOF/MS metabolomics. The metabolites of the M. racemosus Douchi in different fermentation time were compared with the help of principal components analysis (PCA) and orthogonal partial least squares‐discriminant analysis (OPLS‐DA).
2. EXPERIMENTAL
2.1. Materials
Mucor racemosus was obtained from the strain CGMCC8700 kept in China General Microbiological Culture Collection Center. Soya beans, distilled wine (alcohol content 45%), and sodium chloride were purchased from the local markets.
Douchi was prepared as previously described (Yang et al., 2015). (a) Cleaned soybean was soaked in water and then steamed for 20 min at 115°C. (b) The soybeans were cooled down to 35°C and then inoculated with M. racemosus rapidly, which incubated at 25°C for 48 hr. (c) The product was processed with 1% distilled wine and 8% sodium chloride, and then aged for several days (10, 15, 20, and 25 days) at 25°C. In this study, six batches of soybeans were used, while different fermentation time (0 hr, 24 hr, 48 hr, 5 days, 10 days, 15 days, 20 days, and 25 days, respectively) were investigated. So there were 48 samples in total.
2.2. Metabolites extraction
Sample (60 mg) was added into 0.4 ml methanol/water (3:1, v/v), and then, 20 μl of adonitol solution (1 mg/ml stock in dH2O) was added as internal standard. The solution was mixed in the vortex for 30 s and ultrasound treated for 5 min. Then, the solution was centrifuged for 15 min at 9810 g, 4°C. The supernatant (0.3 ml) was transferred into a glass vial and dried by vacuum drying. Methoxyammonium chloride solution (80 μl, 20 mg/ml in pyridine) was added into the sample and incubated for 30 min at 80°C. About 100 μl N,O‐bis(trimethylsilyl)trifluoroacetamide w/1% trimethylchlorosilane was added into the sample and incubated for 90 min at 70°C.
2.3. GC‐TOF/MS analysis
Gas chromatography with time‐of‐flight mass spectrometry system consisting of Agilent 7890 GC system with weak polar capillary column, DB‐5MS (30 m × 250 μm inner diameter, 0.25 μm film thickness), and a Pegasus 4D TOFMS (LECO Corp.) with an electron impact ionization source was employed. Only one‐dimensional GC was used in this study. In the experiment, the electron impact ionization was tuned at 70 eV and helium was used as carrier gas with an average linear velocity of 1.0 ml/min. The mass spectrometer was operated with a transfer line temperature of 270°C, ion source 220°C, and mass range from 50 to 500 amu at a rate of 20 spectra/s after a solvent delay of 370 s. The injection volume was 1 μl, and the temperature of injection was 280°C. The following oven temperature program: set the initial temperature at 50°C with 1 min, then increased to 310°C at a rate of 10°C/min, and hold 8 min (Lisec, Schauer, Kopka, Willmitzer, & Fernie, 2006).
2.4. Data analysis
Peak extraction, baseline correction, peak alignment, deconvolution analysis, and peak identification were achieved with the Chroma TOF4.3X software (LECO Corp.) and LECO‐Fiehn Rtx5 database. Simulation of the missing value and noise removal was achieved as previously described (Sun et al., 2015). Besides, the internal standard normalization method was used to standardize the data (Sun et al., 2015). Both of mass spectrum match and retention index match were considered in metabolites identification. LECO/Fiehn Metabolomics Library was used for the metabolite identification, and a similarity above 700 was adopted for giving the positive answer of the existence of the metabolite. Besides, the compound with the similarity <200 is defined as an “analyte,” while the compound with a similarity between 200 and 700 is considered as a putative annotation.
Principal components analysis and OPLS‐DA methods were used to display the similarity and difference with the help of the SIMCA14.1 software package (Umetrics). This software has the advantage of displaying Hotelling T 2 95% confidence limit ellipse in the score plot to show the presence of outliers. Furthermore, the first principal component of variable importance in the projection (VIP) value above 1.0 was adopted for giving the positive answer of the existence of the changed metabolite. The remaining variables were then assessed using Student's t test (t test) method. Variable was discarded when the value of p was above 0.05.
3. RESULTS AND DISCUSSION
3.1. Identification of GC‐TOF/MS compounds
In this work, silylation reactions with N,O‐bis(trimethylsilyl)trifluoroacetamide was used. In silylation reactions, a labile hydrogen from acids, alcohols, thiols, amines, amides or enolizable ketones, and aldehydes is replaced by a trimethylsilyl group. The products are generally more volatile and thermally stable, and the major metabolites of interest may be observed by GC‐TOF/MS. The GC‐TOF/MS total ion chromatographs (TICs) with different fermentation time were obtained. In order to verify the performance of the method, the retention time and peak area of internal standard in different samples were compared. The retention times of the internal standard in different samples are stable, and the variation of peak areas of the internal standard is small (the relative standard deviation is no >5.0%). It shows that the accuracy and stability of the instrument are good. Therefore, the data of metabolites can be compared with each other in different samples. In total, 511 peaks were found and 114 metabolites were identified. The information of 511 peaks and metabolite mapping was attached as a Data S1 and S2. Besides, a clear discrimination can also be observed among the samples with different fermentation time. There were various differences in the shape and quantity of peaks among the samples with different fermentation time. Thus, these TICs identified by GC‐TOF/MS could directly reflect the differences in metabolites with different fermentation time.
3.2. Global analysis of metabolites with PCA and OPLS‐DA
In order to discriminate the metabolites of Douchi samples with different fermentation time, PCA was performed. Figure 1 displays the classification effect of Douchi samples of different fermentation time with PCA. Ellipse represents Hotelling T 2 with 95% confidence in the score plots. All the samples in the score plots were within the 95% Hotelling T 2 ellipse. As shown in Figure 1, there was no significant difference among different batches of samples in the same fermentation time. Furthermore, the PCA analysis of GC‐TOF/MS metabolites showed significantly two separated clusters, which represent the two stages of fermentation: koji‐making (within 48 hr) and postfermentation (after 48 hr). In starter‐making stage, microorganisms can grow and multiply rapidly, produce spores, and secrete enzymes such as protease, lipase, and cellulase. In the postfermentation stage, complex biochemical reactions are carried out in anaerobic conditions with the help of the enzymes, thus forming the special flavor of Mucor‐type soybean sauce. After 48 hr of fermentation, a large number of metabolites were produced in the postfermentation.
Figure 1.
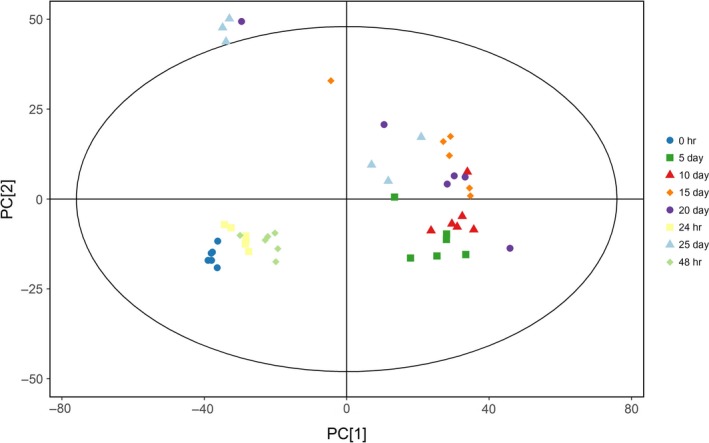
Classifications of samples with different fermentation time by principal components analysis methods
Orthogonal partial least squares‐discriminant analysis is a commonly used technique to improve the effect of classification. The parameter for the assessment of the OPLS‐DA model quality could be represented by the validation plots, as shown in Figure 2a. The corresponding Q2Y value of OPLS‐DA models was 0.916, and the R2Y values of the model that represent explained variance were 0.950, indicating a satisfactory effectiveness of the model. The robustness and predictive ability of the model were estimated by sevenfold cross‐validation method. In order to further validate the model, the permutation test was used. The low values of Q2 intercept indicate the robustness of the models and thus show a low risk of over fitting. Figure 2b displays results by the score map of OPLS method, which represents the trend in metabolic data over fermentation time. All the samples in the score plot were inside the 95% Hotelling T 2 ellipse, whereas only two samples in 25 days of fermentation was not inside the ellipse. Separation and discrimination were clearly indicating that the OPLS‐DA model can be used to identify the difference within and after 48 hr fermentation. The levels of amino acids such as threonine, valine, glycine, phenylalanine, l‐cysteine, and alanine involved in the fermentation varied significantly. In addition, the levels of uracil and xanthine were dramatically increased. The results showed that the proteins and other big molecular substances are hydrolyzed into a large number of small molecule components with the help of enzymes in the postfermentation stage.
Figure 2.
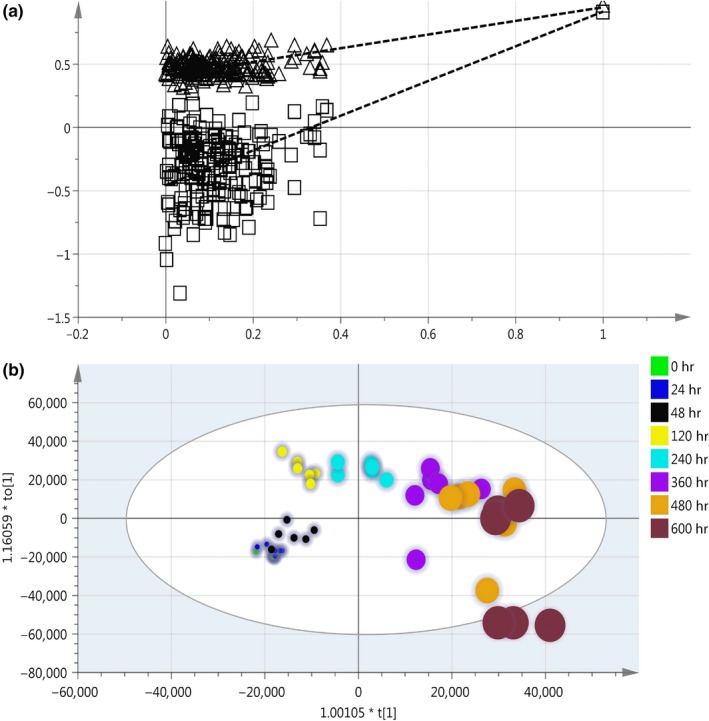
Classification of samples with different fermentation time by orthogonal partial least squares‐discriminant analysis (OPLS‐DA) method: (a) Validation plots of OPLS‐DA and (b) OPLS‐DA score plots
3.3. Optimization of the fermentation time
The PCA analysis of GC‐TOF/MS metabolites showed significantly separated clusters between the samples of 0 and 24 hr, 48 hr, and 5 days of fermentation, respectively, in the PCA score plots (Figure 3a,b). However, the two groups are merged together between the samples of 15 days and 20 days, 20 days and 25 days, respectively (Figure 4a,b). The results showed that after 15 days of fermentation, there was no significant change for the metabolites in Douchi, indicating that the fermentation of Douchi was finished in 15 days. Due to the synergistic effect of protease and hydrolase accumulated in the early stage, proteins and other big molecular substances are rapidly hydrolyzed into a large number of small molecule components. However, the activity of enzymes decreased with the further fermentation, and some free amino acids were consumed in Maillard reaction. Therefore, there was no significant change in the content of small molecular substances after 15 days of fermentation.
Figure 3.
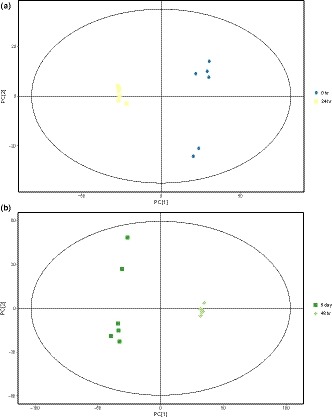
(a) Principal components analysis (PCA) score plot of the samples with 0 and 24 hr fermentation; (b) PCA score plot of the samples with 48 hr and 5 days of fermentation
Figure 4.
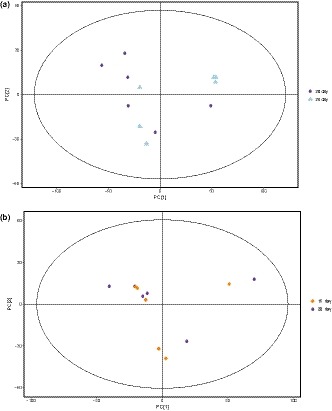
(a) Principal components analysis (PCA) score plot of the samples with 15 and 20 days of fermentation; (b) PCA score plot of the samples with 20 and 25 days of fermentation
With OPLS‐DA method, similar results can also be found and significantly separated clusters between the samples of 0 and 24 hr, 48 hr and 5 days of fermentation can be found. The corresponding Q2Y values of PLS‐DA models was 0.930 and 0.941, respectively, while the R2Y values of the model that represent explained variance were 0.993 and 0.998, respectively, indicating satisfactory effectiveness of the models. However, significantly separated clusters between the samples of 15 days and 20 days, 20 days and 25 days can also be found (Figure 5a,b). The corresponding Q2Y values of PLS‐DA models was 0.099 and 0.331, respectively, indicating the classifications of OPLS‐DA method between the samples of 15 days and 20 days, 20 days and 25 days are incorrect. Therefore, it can be concluded that after 15 days of fermentation, there was no significant change for the metabolites in Douchi sample, indicating that the fermentation was finished in 15 days.
Figure 5.
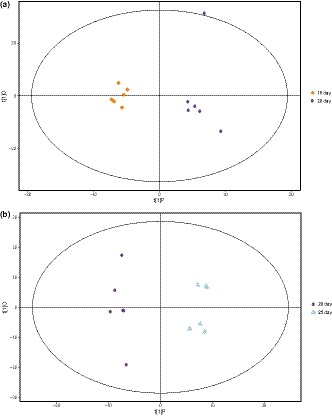
(a) Orthogonal partial least squares‐discriminant analysis (OPLS‐DA) score plot of the samples with 15 and 20 days of fermentation; (b) OPLS‐DA score plot of the samples with 20 and 25 days of fermentation
Relationship between the TICs and fermentation time with OPLS‐DA can be found in Figure 6a. R2 is 0.9567, while the root mean square error of prediction (RMSEP) is 49 hr, and the root mean square error of cross‐validation (RMSECV) is 70 hr. The results show that the model can extract the relationship of the TICs and the fermentation time with strong prediction ability.
Figure 6.
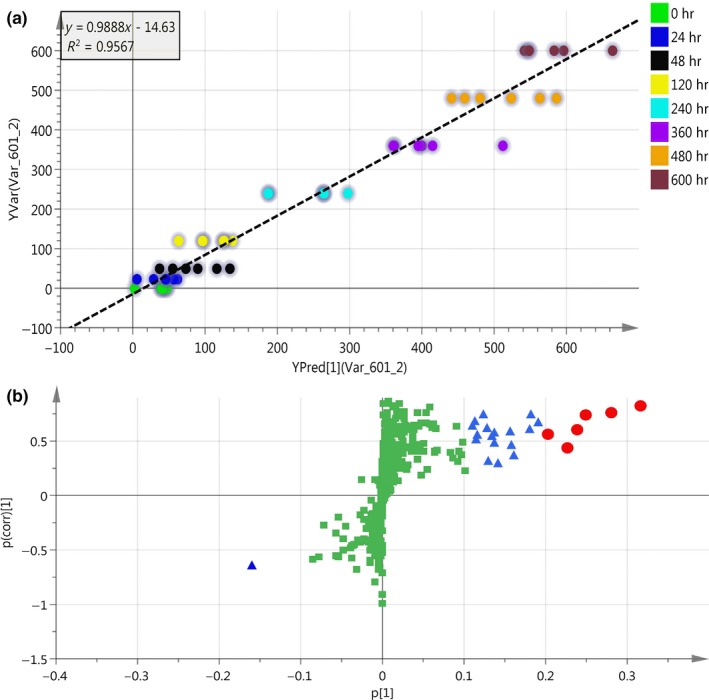
(a) Relationship of the TICs and the fermentation time with OPLS‐DA Classification of different fermentation time with OPLS‐DA; (b) S‐plot for finding the important significantly different metabolites. The blue squares represent the very significantly increased metabolites, and the red triangles represent significantly increased metabolites during the whole fermentation course. The yellow triangles represent significantly decreased metabolites during the whole fermentation course. OPLS‐DA, orthogonal partial least squares‐discriminant analysis; TICs, total ion chromatographs
3.4. Significantly different metabolites
For the established OPLS model, the first principal component is related to fermentation time, and thus, S‐plot was used to find the important significantly different metabolites (Lee et al., 2016). As shown in Figure 6b, blue squares represent the very significantly increased metabolites, and the red triangles represent significantly increased metabolites during the whole fermentation course. The yellow triangles represent significantly decreased metabolites during the whole fermentation course. Table 1 is the identification of significantly different metabolites. The levels of some metabolites such as alanine and lysine involved in the fermentation varied significantly throughout the processes. In addition, the levels of putrescine and myo‐inositol were dramatically increased, while the level of l‐Malic acid was decreased. In the fermentation processing of Douchi, the active phytase produced by microorganism can hydrolyze the phytic acid to the inositol and phosphate (Quan, Fan, & Ohta, 2003). Besides, the trypsin inhibitor was destroyed in the fermentation and soy protein is easier to be hydrolyzed by protease, producing a series of intermediate products, such as soy peptides and amino acids. Application of untargeted metabolomics enables unbiased analysis of metabolites which may result in discoveries that were not anticipated by production engineers and thus may lead to provide new insights into the metabolomics characteristics during the Douchi fermentation process.
Table 1.
Identification of significantly different metabolites
| Metabolites | VIPs |
|---|---|
| Significantly increased metabolites | |
| Myo‐inositol | 7.73959 |
| Putrescine | 6.86263 |
| Lysine | 6.09263 |
| Alanine | 5.5559 |
| Glycine | 4.6789 |
| 2,6‐Diaminopimelic acid | 4.43965 |
| Valine | 3.9587 |
| Tyrosine | 3.87751 |
| Aspartic acid | 3.81571 |
| Proline | 3.47342 |
| Phenylethylamine | 3.35048 |
| Phenylalanine | 3.3394 |
| Uracil | 3.29461 |
| Isoleucine | 3.17923 |
| Ethanolamine | 3.13255 |
| Succinic acid | 3.04202 |
| Glutamic acid | 2.8248 |
| Threonine | 2.35432 |
| Isopropyl‐β‐d‐thiogalactopyranoside | 1.58043 |
| Glutaraldehyde | 1.54461 |
| O‐methylthreonine | 1.50684 |
| 4‐Hydroxybutyrate | 1.40658 |
| Xanthine | 1.40406 |
| Serine | 1.36458 |
| 3‐Hydroxybutyric acid | 1.31852 |
| N(α),N(α)‐dimethyl‐l‐histidine | 1.22074 |
| Malonic acid | 1.11671 |
| Maleimide | 1.10606 |
| Glycolic acid | 1.08785 |
| β‐Mannosylglycerate | 1.05031 |
| 2‐Butyne‐1,4‐diol | 1.04057 |
| Significantly decreased metabolites | |
| l‐Malic acid | 3.93109 |
| Sucrose | 2.0699 |
| Lactose | 1.89751 |
| Ribose | 1.77267 |
| Glycerol | 1.3957 |
| Mannose | 1.38651 |
| Xylose | 1.32129 |
Abbreviation: VIPs, variable importance in the projection.
4. CONCLUSION
The metabolic characterization throughout the fermentation of M. racemosus Douchi was investigated using GC‐TOF/MS. A total of 511 peaks were found, and 114 metabolites were identified. Clear separation and discrimination were found within 15 days of fermentation, while the discrimination cannot be found with more than 15 days of fermentation, indicating that the fermentation of Douchi was finished in 15 days. The levels of some metabolites such as alanine and lysine involved in the fermentation varied significantly throughout the processes. In addition, the levels of putrescine and myo‐inositol were dramatically increased, while the level of l‐Malic acid was decreased. Application of untargeted metabolomics enables unbiased analysis of metabolites which may result in discoveries that were not anticipated by production engineers and provides new insights into the metabolomics characteristics during the Douchi fermentation process.
CONFLICT OF INTEREST
The authors notify that there are no conflicts of interest.
ETHICAL APPROVAL
This study does not involve any human or animal testing.
Supporting information
ACKNOWLEDGMENTS
This study was supported by National Natural Science Foundation of China (No. 31371828, 31571819, 31601551, and 31671931) and the “1515 Talent Project” of Hunan Agricultural University.
Li P, Tang H, Shi C, et al. Untargeted metabolomics analysis of Mucor racemosus Douchi fermentation process by gas chromatography with time‐of‐flight mass spectrometry. Food Sci Nutr. 2019;7:1865–1874. 10.1002/fsn3.1042
REFERENCES
- Adebo, O. A. , Njobeh, P. B. , Desobgo, S. C. Z. , Pieterse, M. , Kayitesi, E. , & Ndinteh, D. T. (2018). Profiling of volatile flavor compounds in nkui (a Cameroonian food) by solid phase extraction and 2D gas chromatography time of flight mass spectrometry (SPME‐GC×GC‐TOF‐MS). Food Science & Nutrition, 6, 2028–2035. [DOI] [PMC free article] [PubMed] [Google Scholar]
- Chalet, C. , Hollebrands, B. , Janssen, H. G. , Augustijns, P. , & Duchateau, G. (2018). Identification of phase‐II metabolites of flavonoids by liquid chromatography–ion‐mobility spectrometry–mass spectrometry. Analytical & Bioanalytical Chemistry, 410, 471–482. 10.1007/s00216-017-0737-4 [DOI] [PubMed] [Google Scholar]
- Chen, J. , Cheng, Y. Q. , Yamaki, K. , & Li, L. T. (2007). Anti‐α‐glucosidase activity of Chinese traditionally fermented soybean (douchi). Food Chemistry, 103, 1091–1096. 10.1016/j.foodchem.2006.10.003 [DOI] [Google Scholar]
- Chen, Q. C. , Xu, Y. X. , Wu, P. , Xu, X. Y. , & Pan, S. Y. (2011). Aroma impact compounds in Liuyang douchi, a Chinese traditional fermented soya bean product. International Journal of Food Science & Technology, 46, 1823–1829. [Google Scholar]
- Chen, T. , Wang, M. , Jiang, S. , Xiong, S. , Zhu, D. , & Wei, H. (2011). Investigation of the microbial changes during koji‐making process of Douchi by culture‐dependent techniques and PCR‐DGGE. International Journal of Food Science & Technology, 46, 1878–1883. [Google Scholar]
- de Godoy Alves Filho, E. , Rodrigues, T. H. S. , Fernandes, F. A. N. , Pereira, A. L. F. , Narain, N. , de Brito, E. S. , & Rodrigues, S. (2017). Chemometric evaluation of the volatile profile of probiotic melon and probiotic cashew juice. Food Research International, 99, 461–468. 10.1016/j.foodres.2017.05.030 [DOI] [PubMed] [Google Scholar]
- Ding, M. Z. , Cheng, J. S. , Xiao, W. H. , Qiao, B. , & Yuan, Y. J. (2009). Comparative metabolomic analysis on industrial continuous and batch ethanol fermentation processes by GC‐TOF‐MS. Metabolomics, 5, 229–238. 10.1007/s11306-008-0145-z [DOI] [Google Scholar]
- He, G. , Huang, J. , Liang, R. , Wu, C. , & Zhou, R. (2016). Comparing the differences of characteristic flavour between natural maturation and starter culture for Mucor‐type Douchi. International Journal of Food Science & Technology, 51, 1252–1259. [Google Scholar]
- He, Q. H. , Kong, X. F. , Wu, G. Y. , Ren, P. P. , Tang, H. R. , Hao, F. H. , … Wu, Y. N. (2009). Metabolomic analysis of the response of growing pigs to dietary L‐arginine supplementation. Amino Acids, 37, 199–208. 10.1007/s00726-008-0192-9 [DOI] [PubMed] [Google Scholar]
- Jiang, L. W. (2013). Research progress of Douchi fermentation. Journal of Food Safety & Quality, 33, 274–277. [Google Scholar]
- Khakimov, B. , Christiansen, L. D. , Heins, A. L. , Sørensen, K. M. , Schöller, C. , Clausen, A. , … Engelsen, S. B. (2017). Untargeted GC‐MS metabolomics reveals changes in the metabolite dynamics of industrial scale batch fermentations of Streptoccoccus thermophilus broth. Biotechnology Journal, 12, 1700400. [DOI] [PubMed] [Google Scholar]
- Lee, D. E. , Lee, S. , Jang, E. S. , Shin, H. W. , Moon, B. S. , & Lee, C. H. (2016). Metabolomic profiles of Aspergillus oryzae and Bacillus amyloliquefaciens during rice koji fermentation. Molecules, 21(6), e773. [DOI] [PMC free article] [PubMed] [Google Scholar]
- Li, P. , Xie, J. , Tang, H. , Shi, C. , Xie, Y. , He, J. , … Jiang, L. (2019). Fingerprints of volatile flavor compounds from southern stinky tofu brine with headspace solid‐phase microextraction/gas chromatography–mass spectrometry and chemometric methods. Food Science & Nutrition, 7, 890–896. 10.1002/fsn3.943 [DOI] [PMC free article] [PubMed] [Google Scholar]
- Lisec, J. , Schauer, N. , Kopka, J. , Willmitzer, L. , & Fernie, A. R. (2006). Gas chromatography mass spectrometry‐based metabolite profiling in plants. Nature Protocols, 1, 387–396. 10.1038/nprot.2006.59 [DOI] [PubMed] [Google Scholar]
- Lu, H. , Zhang, B. B. , & Wu, Z. H. (2010). Studies on Mucor racemosus fermentation to manufacture gamma‐linolenic acid functional food Douchi. Food Science and Technology International, 16, 543–548. 10.3136/fstr.16.543 21339170 [DOI] [Google Scholar]
- Marti, G. , Boccard, J. , Mehl, F. , Debrus, B. , Marcourt, L. , Merle, P. , … Wolfender, J.‐L. (2014). Comprehensive profiling and marker identification in non‐volatile citrus oil residues by mass spectrometry and nuclear magnetic resonance. Food Chemistry, 150, 235–245. 10.1016/j.foodchem.2013.10.103 [DOI] [PubMed] [Google Scholar]
- Ng'ong'ola‐Manani, T. A. , Østlie, H. M. , Mwangwela, A. M. , & Wicklund, T. (2014). Metabolite changes during natural and lactic acid bacteria fermentations in pastes of soybeans and soybean–maize blends. Food Science & Nutrition, 2, 768–785. 10.1002/fsn3.171 [DOI] [PMC free article] [PubMed] [Google Scholar]
- Nicholson, J. K. , & Lindon, J. C. (2008). Metabonomics. Nature, 455, 1054. [DOI] [PubMed] [Google Scholar]
- Quan, C. S. , Fan, S. D. , & Ohta, Y. (2003). Immobilization of Candida krusei cells producing phytase in alginate gel beads: An application of the preparation of myo‐inositol phosphates. Applied Microbiology and Biotechnology, 62, 41–47. 10.1007/s00253-003-1247-1 [DOI] [PubMed] [Google Scholar]
- Salvatore, A. , Gyong, A. Y. , Tobias, K. , Cataldi, T. R. I. , & Oliver, F. (2010). Determination of elemental compositions by gas chromatography/time‐of‐flight mass spectrometry using chemical and electron ionization. Rapid Communications in Mass Spectrometry: RCM, 24, 1172–1180. [DOI] [PMC free article] [PubMed] [Google Scholar]
- Shao, S. , Zhou, T. , & McGarvey, B. D. (2012). Comparative metabolomic analysis of Saccharomyces cerevisiae during the degradation of patulin using gas chromatography‐mass spectrometry. Applied Microbiology and Biotechnology, 94, 789–797. 10.1007/s00253-011-3739-8 [DOI] [PubMed] [Google Scholar]
- Soga, T. , Ohashi, Y. , Ueno, Y. , Naraoka, H. , Tomita, M. , & Nishioka, T. (2003). Quantitative metabolome analysis using capillary electrophoresis mass spectrometry. Journal of Proteome Research, 2, 488–494. 10.1021/pr034020m [DOI] [PubMed] [Google Scholar]
- Spínola, V. , Perestrelo, R. , Câmara, J. S. , & Castilho, P. C. (2015). Establishment of Monstera deliciosa fruit volatile metabolomic profile at different ripening stages using solid‐phase microextraction combined with gas chromatography–mass spectrometry. Food Research International, 67, 409–417. 10.1016/j.foodres.2014.11.055 [DOI] [Google Scholar]
- Sun, H. Z. , Wang, D. M. , Wang, B. , Wang, J. K. , Liu, H. Y. , Guan, L. L. , & Liu, J. X. (2015). Metabolomics of four biofluids from dairy cows: Potential biomarkers for milk production and quality. Journal of Proteome Research, 14, 1287–1298. 10.1021/pr501305g [DOI] [PubMed] [Google Scholar]
- Tobias, K. , Gert, W. , Do Yup, L. , Yun, L. , Mine, P. , Sevini, S. , & Oliver, F. (2009). FiehnLib: Mass spectral and retention index libraries for metabolomics based on quadrupole and time‐of‐flight gas chromatography/mass spectrometry. Analytical Chemistry, 81, 10038–10048. 10.1021/ac9019522 [DOI] [PMC free article] [PubMed] [Google Scholar]
- Velázquez Ríos, I. O. , González‐García, G. , Mellado‐Mojica, E. , Veloz García, R. A. , Dzul Cauich, J. G. , López, M. G. , & García‐Vieyra, M. I. (2019). Phytochemical profiles and classification of Agave syrups using 1H‐NMR and chemometrics. Food Science & Nutrition, 7, 3–13. [DOI] [PMC free article] [PubMed] [Google Scholar]
- Xie, J. , Jiang, L. W. , Bin, T. , Chen, M. F. , Liao, L. Y. , Liu, D. M. , & Zhou, H. (2016). Comparison of the effects of three different drying methods on the quality of Liuyang Douchi as analyzed by electronic tongue and SPME‐GC‐MS. Food Science, 37, 92–98. [Google Scholar]
- Xu, L. , Du, B. , & Xu, B. J. (2015). A systematic, comparative study on the beneficial health components and antioxidant activities of commercially fermented soy products marketed in China. Food Chemistry, 174, 202–213. 10.1016/j.foodchem.2014.11.014 [DOI] [PubMed] [Google Scholar]
- Yang, Y. L. , Li, M. D. , Chen, L. L. , & Jiang, L. W. (2015). Optimization of post‐fermentation process for Mucor‐type Douchi. China Brewing, 34, 23–26. [Google Scholar]
- Zhang, J. H. , Eizo, T. , Fan, J. F. , & Li, L. T. (2010). Chemical components of Aspergillus‐type Douchi, a Chinese traditional fermented soybean product, change during the fermentation process. International Journal of Food Science & Technology, 42, 263–268. [Google Scholar]
- Zhang, J. , Shi, H. , Wang, Y. , Li, S. , Cao, Z. , Ji, S. , … Zhang, H. (2017). Effect of dietary forage to concentrate ratios on dynamic profile changes and interactions of ruminal microbiota and metabolites in Holstein heifers. Frontiers in Microbiology, 8, 2206. [DOI] [PMC free article] [PubMed] [Google Scholar]
- Zhu, W. R. , Wang, X. , & Chen, L. H. (2017). Rapid detection of peanut oil adulteration using low‐field nuclear magnetic resonance and chemometrics. Food Chemistry, 216, 268–274. 10.1016/j.foodchem.2016.08.051 [DOI] [PubMed] [Google Scholar]
Associated Data
This section collects any data citations, data availability statements, or supplementary materials included in this article.
Supplementary Materials


