

Abstract
To determine how different components affect the structure of pulmonary surfactant, we measured X-ray scattering by samples derived from calf surfactant. The surfactant phospholipids demonstrated the essential characteristics of the Lγ phase: a unit cell with a lattice constant appropriate for two bilayers; crystalline chains detected by wide angle X-ray scattering (WAXS). The electron density profile, obtained from scattering by oriented films at different relative humidities (70–97%), showed that the two bilayers, arranged as mirror images, each contain two distinct leaflets with different thicknesses and profiles. The detailed structures suggest one ordered leaflet that would contain crystalline chains, and one disordered monolayer likely to contain the anionic compounds, which constitute ~10% of the surfactant phospholipids. The spacing and temperature-dependence detected by WAXS fit with an ordered leaflet composed of dipalmitoyl phosphatidylcholine. Physiological levels of cholesterol had no effect on this structure. Removing the anionic phospholipids prevented formation of the Lγ phase. The cationic surfactant proteins inhibited Lγ structures, but at levels unlikely related to charge. Because the Lγ phase, if arranged properly, could produce a self-assembled ordered interfacial monolayer, the structure could have important functional consequences. Physiological levels of the proteins, however, inhibit formation of the Lγ structures at high relative humidities, making their physiological significance uncertain.
Keywords: asymmetric bilayer, lipid polymorphism, lung, surface tension, X-ray diffraction
INTRODUCTION
Alveolar films must undergo a transformation. Vesicles of pulmonary surfactant adsorb to the surface of the thin liquid layer that lines the alveolar air sacks. During the initial stages of adsorption in vitro, the vesicles deliver their complete set of constituents to form a monomolecular film.1 When compressed in vitro, these initial adsorbed monolayers undergo a phase transition from the two-dimensional film to their three-dimensional bulk structure.2 They collapse from the interface at the equilibrium spreading tension of ~25 mN/m.3 Further decreases in area convert additional monolayer to the collapsed structure with minimal effect on surface tension. The alveolar film in situ, however, resists collapse. Compression by the shrinking alveolar surface area during exhalation reduces surface tension to levels well below the equilibrium values.4–8 The nature of this transformation from the readily collapsing initial monolayer to a structure that avoids collapse and sustains low surface tensions represents perhaps the most fundamental question concerning how pulmonary surfactant functions in the lung.
Two earlier models proposed that the transformation occurs during an initial change in area. The classical model of pulmonary surfactant has long contended that the functional alveolar film is a tilted-condensed (TC) monolayer, in which the acyl chains pack into a two-dimensional crystalline array.9–10 Conversion of the initial adsorbed monolayer to a TC film would require a substantial change in composition. TC domains that form in monolayers of the surfactant phospholipids, surrounded by a liquid-expanded (LE) film, contain essentially pure dipalmitoyl phosphatidylcholine (DPPC).11 That compound constitutes ~35–40% of surfactant from most animals. Achieving a TC film from the initial monolayer would require some process that greatly enriches the interfacial content of DPPC. Differential collapse of coexisting LE and TC regions during the initial stages of compression would yield the compositional refinement necessary to produce the crystalline structure, but the film would resist collapse only after substantial initial compression.
The alternative supercompressed-fluid model would require no change in composition. LE films become persistently resistant to collapse if they reach low surface tensions.12–13 Like the traditional version of the classical model, these initially fluid films would replicate the behavior of the alveolar film, but only after a change in area, in this case to reach the low surface tensions at which they transform.
Physiological data argue that initial compression may be unnecessary to achieve the functional alveolar film. The mechanical behavior of excised lungs suggests that the alveolar film resists collapse from the beginning of the first exhalation.14–15 Experiments in vitro can replicate that behavior.16–17 Films of pulmonary surfactant that adsorb to completion collapse more slowly than the initial monolayer by two orders of magnitude.18 Rather than transforming during the initial stage of compression, the functional film may self-assemble during adsorption.
The classical model predicts that the self-assembled structure would include a TC monolayer at the interface. One structure which might contain that essential ordered element is the Lγ phase. Small angle X-ray scattering (SAXS) indicates that the Lγ unit cell contains two lamellar bilayers.19 Wide angle X-ray scattering (WAXS) shows that the acyl chains coexist in crystalline, hexagonal arrays and disordered structures.19–20 Two configurations of the different leaflets most easily explain these results. In each, the two bilayers of the unit cell contain two disordered (α) and two ordered (β) leaflets. The bilayers could be either symmetric and different (α-α β-β), or asymmetric and identical, arranged as mirror images (α-β β-α). Uncertainty persists concerning which configuration represents the Lγ structure. The best available evidence21 is based on analysis of the lower order moments from Patterson mapping of neutron scattering. Those data favor the asymmetric bilayers (α-β). With either arrangement, however, self-assembly of Lγ films could yield an interfacial leaflet that is effectively TC.
Prior studies have found the Lγ phase in preparations of mitochondrial components,19–21 myelin,22 extracts of material washed from slices of lungs,23–24 and extracts of homogenized lung stripped of cholesterol.25 The last two materials presumably contain significant amounts of pulmonary surfactant or its components, and raise the possibility that the alveolar film could consist of Lγ structures.23 The studies reported here provide strong evidence that the phospholipids from calf surfactant form the Lγ phase. Those results provided the detailed structure of that phase. Our experiments then tested hypotheses suggested by that structure concerning the role of specific constituents in generating the Lγ phase.
EXPERIMENTAL
Materials:
The hydrophobic constituents of pulmonary surfactant (calf lung surfactant extract, CLSE), provided by ONY, Inc. (Amherst, NY), were obtained by lavaging calf lungs, collecting large particles by centrifugation from the recovered fluid, and extracting the pelleted particles.26 Gel permeation chromatography with a solvent of acidified chloroform:methanol (0.1 N HCl:CHCl3:CH3OH, 10:95:95 (v:v:v)) separates CLSE into fractions of the hydrophobic surfactant proteins, the phospholipids, and cholesterol.27–28 Pooling appropriate fractions provides the physiological mixture of the proteins (surfactant protein, SP), the complete set of purified phospholipids (PPL), and cholesterol with the phospholipids (neutral and phospholipids, N&PL).28 Elution with solvent that contains no acid (chloroform:methanol, 1:1 (v:v)) provides a modified PPL (mPPL) that lacks the anionic phospholipids, which stick to the column.28
Silicon wafers of {100} orientation were obtained from Semiconductor Processing, Inc. (Boston, MA). Sigma-Aldrich (St. Louis, MO) provided the solvents. A NANOpure Diamond ultra-pure system (Dubuque, IA) further purified deionized water.
Methods:
Most experiments measured small angle X-ray scattering (SAXS) from oriented films. The chamber used to rotate and control the hydration of the films precluded measurements of wide angle X-ray scattering (WAXS). We therefore determined WAXS from dispersed samples in capillaries.
Supported films:
Multilayered films were formed on silicon wafers by spin-coating (Single Wafer Spin Station WS-400–6TFM LITE, Laurell Technologies Corp., North Wales, PA). The wafers were first cut to 1 × 3 cm before cleaning by sonication in dichloromethane for 15 min, followed by heating in a solution of H2O2:NH4OH:water (1:1:2, v:v:v) for 1 hr at 65°C. After 3–4 rinses with water and drying with a stream of N2, spin-coating at 1500 rpm for 2 min deposited the samples on the slides.
Measurements of scattering from the supported films used a chamber constructed for beamline 4–2 at the Stanford Synchrotron Radiation Lightsource (SSRL). The chamber maintained temperature at 30°C, regulated humidity, and rotated the slide through 20° relative to the incident beam. Aluminum attenuators reduced the intensity of the lower order peaks to extend the dynamic range of the detected signal. The measurements recorded the scattered intensities with a CCD camera (Rayonix 225 HE, Rayonix LLC, Evanston IL, USA), and calibrated the angles with silver behenate to obtain values of q, the momentum transfer vector, given by . The angle 2θ separates the incident and scattered beams, and λ is the wavelength of the X-ray. Analysis of the two dimensional images to obtain the variation of intensity with qz in the specular plane used the program Fit2D.29
These data provided the basis for calculating the variation of electron density perpendicular to the film. After correction of the measured intensities for background, attenuation, adsorption, the Lorentz factor, and Blaurock scaling,30 integration of the diffracted peaks using the program PEAK31 provided values proportional to , where F is the scattering amplitude, also known as the form factor or structure factor, and for the hth order of diffraction. We used the swelling method32 to establish the sign of each Fh. Changing the relative humidity (Rh) can swell the film, shift the lamellar lattice-constant, ao, and sample F at different values of q. The trend of increasing or decreasing intensities over a range of q can establish the sign of each Fh relative to the preceding value. The amplitude is then given as
where sinc ψ = sin ψ/ψ. The relative electron density, Δρ, along the distance, z, normal to the bilayer is given by
Dispersed samples:
For measurements on dispersed samples, capillaries (boron-rich glass, 2.00 mm diameter, 0.01 mm wall thickness; Charles Supper, Natick, MA) contained 4–8 mg phospholipid, delivered as solutions of the appropriate constituents in chloroform. Incubation at 2 mbar removed solvent until the weight of the tube stabilized. Adding appropriate weights of 10 mM Hepes pH 7.0, 2 μM EDTA with 0.002% NaN3 (w:w) (HE) achieved the desired water-content (ϕw), defined as ϕw = (wt. water)/(wt. lipid + wt. water). After sealing the tubes by flame, the samples were cycled between −20 and 4°C several times to promote mixing, and then stored at 4°C.
Measurements with the dispersed samples used beamline 1–4 at the SSRL. Different separations of sample and detector allowed separate measurements of SAXS and WAXS. A circulating water bath controlled the temperature of the rack that supported the capillaries. Visual observations on materials with known melting points determined the correspondence between temperatures in the capillaries and the bath. Measurements were conducted at sequentially higher temperatures following equilibration during an initial 10 minute incubation at each new temperature. A charged coupled device (CCD) camera recorded the spatial distribution of the scattered intensities. Angular calibration again used silver behenate for both SAXS and WAXS, with radial integration of the imaged intensities by the program Fit2D.29
RESULTS
Oriented films of the surfactant phospholipids (purified phospholipids, PPL) produced lamellar diffraction (Fig. 1). The values of q for the diffracted intensities indicated a large lattice-constant (ao), consistent with a unit cell that contained two bilayers (Fig. 1B). A first-order peak was undetectable at any humidity, either with our standard configuration (Fig. 1A) or with a larger drift-tube to reduce the minimum accessible value of q. Distinct peaks persisted to as much as 18th order. Increasing the relative humidity (Rh) to 97% reduced the intensity of the higher order peaks (Fig. 1A) and induced faint diffraction that indicated a coexisting lamellar phase with the lattice-constant of a single bilayer (5.2 nm) (Fig. 1A,B). The major pattern of a lamellar structure in a large unit cell, however, remained evident. The lattice-constant of 11.7 ± 0.02 nm at Rh = 97%, roughly twice the value for a standard lamellar phase with a single bilayer, strongly suggested the Lγ phase.
1.

SAXS from oriented films of PPL. A. Angular variation of the intensity in the specular plane, I(qz). Traces at relative humidities (Rh) above 70% are shifted vertically without change in scale for clarity of presentation. Temperature = 30°C. B. Diagnostic plot for determining the structural phases present.54–55 Horizontal lines give the measured values of qz for the diffraction peaks determined in panel A. Vertical lines give values of , where h, k, and l are the Miller indices allowed for lamellar phases. The two symbols correspond to coexisting Lγ and standard lamellar phases (L, undifferentiated between Lα and Lβ’) that explain the data. The slope of the line fit through the symbols provides ao for the structure producing diffraction at these qz.
The characteristics of the Lγ phase also include ordered chains, detectable from diffraction in measurements of WAXS.19 The constraints of our chamber prevented measurements of WAXS on oriented films. We therefore instead measured WAXS along with SAXS from dispersed samples.
SAXS detected two structures in these samples (Fig. 2). At all conditions, PPL produced diffraction in a lamellar pattern consistent with a large unit cell (Fig. 3). At low hydrations and temperatures, this structure occurred alone (Supporting Information, Fig. S1). In contrast to the oriented films, diffraction included a faint first-order peak (Figs. 2, S1), providing assurance that no major intensity was missing from the pattern for the films. For higher hydrations, between 0.7 ≥ ϕw ≥ 0.13, the samples also contained a coexisting lamellar structure with a standard ao, appropriate for a single bilayer (Figs. 2,3). Comparison of ao for the two coexisting structures provided confidence that the larger unit cell could contain two bilayers, consistent with the Lγ phase. Samples at the highest ϕw = 0.91 (Figs. 3,4) contained only a single structure with an exceptionally large ao, up to 30 nm (Fig. 3). Although the absence of a well defined ao for a single bilayer limited certainty, the large unit cell fit with the paired bilayers of the Lγ phase.
2.

SAXS from dispersed samples of PPL in capillaries. A. I(q) at ϕw = 0.35. Vertically positioned tags indicate assignment of the different peaks according to the diagnostic plots in panel B. B. Diagnostic plots from data in panel A, analogous to Fig. 1B.
3.

Lattice constants, ao, from SAXS for dispersed samples of PPL. Symbols indicate values for the following structures: Lγ; L, indicating a standard lamellar phase, with no distinction between Lα and Lβ’; Lω, for values at conditions for which ao was unavailable for the standard lamellar phase formed by these constituents.
4.

SAXS for dispersed PPL at ϕw = 0.912. Traces at temperatures above 11°C are shifted vertically without change in scale for clarity of presentation.
WAXS for dispersed samples up to at least ϕw = 0.50 showed a broad peak with superimposed sharp diffraction (Fig. 5). The value of q for the diffraction peak (15.0 nm−1 at ϕw = 0.50) closely approximated a previously reported value for DPPC (14.8 nm−1),33 and changed minimally with ϕw (at 30°C, for ϕw=.095-.495, q = 15.1 ± 0.1 nm−1). The pattern of WAXS for the single structure at ϕw < 0.130 (Fig. S1.C) was unchanged by coexistence at higher ϕw (Fig. 5). The sharp diffraction at wide angles diminished with heating, and then vanished (Fig. 5). Hydration affected the temperature at which the diffraction was no longer evident. For ϕw = 0.50, diffraction at wide angles disappeared between 39 and 48°C, and corresponded well to the melting temperature for Lβ’ DPPC. Both the spacing and the temperature fit with a Lγ phase in which DPPC contributed the ordered chains.
5.

I(q) for WAXS at ϕw = 0.344 and different temperatures achieved during heating. The traces at temperatures above 11°C are shifted vertically without change in scale for clarity of presentation.
Electron-density profile:
The diffraction patterns from the oriented films at different Rh allowed determination of the Lγ structure. For hydration that leaves a centrosymmetric structure unaltered, and only swells an intervening aqueous layer, the variation of I with small changes in q can solve the phase-problem by determining how the sign of F, the scattering amplitude, changes between sequential values of h, the order of diffraction.32,34 For the surfactant lipids, the change in q at different hydrations for the first detectable peak (h = 2) was small (Fig. 1A, 6A). The variation of q for subsequent peaks, however, was sufficient to establish whether the sign of F changed between sequential qh (Fig. 6A). The initial choice of the sign for the first non-zero F(qh) is arbitrary, with selection of the correct value determined by which yields the most reasonable physical structure. Changing the sign of F(qh=2) simply inverted the electron-density profile (Fig. S2). An initial negative sign yielded a prominent local maximum of the electron density that would correspond to the location of the terminal methylene groups. The profile also lacked minima that would correspond to aqueous layers between the bilayers (Fig. S2). This structure was physically unreasonable, and supported a positive sign for F(qh=2).
6.
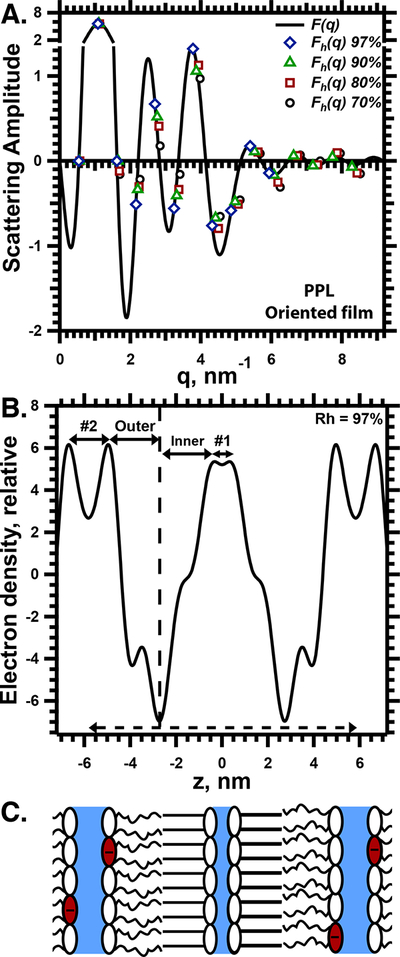
Structural analysis of PPL in oriented films. A. Variation of the calculated scattering amplitude, F(q). The y-axis is broken to display the full range of values while emphasizing lower amplitudes. The symbols give F(qh) for diffraction at different Rh, used to vary the lattice-constant and the angles of diffraction. The trend of F with increasing q establishes whether the sign of F changes between sequential values of h. The continuous curve of F(q), calculated for Rh = 97%, assumes a positive sign for F(qh=2). B. The electron density profile for Rh = 97%. z is the distance perpendicular to the bilayers, centered at the plane of symmetry. The calculations used the signs for F(qh) determined in panel A. The dashed vertical line indicates the middle of a bilayer. The solid horizontal lines with arrows indicate the width of the two aqueous layers (#1 and #2) and the two leaflets of the bilayer (inner and outer). The dashed horizontal line with arrows indicates the dimension of the unit cell. C. Proposed diagram of the unit cell, in register with the electron density profile in panel B. The schematic indicates the location of the ordered and disordered monolayers, and the two aqueous layers (blue), as well as the speculative location of the anionic headgroups (red).
The resulting electron density profile (Fig. 6B for the profile at Rh = 97%) agreed qualitatively with the predictions of the prior study that used neutron scattering.21 The two low density regions that would represent the bilayers were asymmetric, with features that distinguished the two halves of the membranes (Fig. 6B). The two bilayers were equivalent, arranged as mirror images (Fig. 6B,C).
The leaflets in each bilayer had distinguishing characteristics that suggested their structure. The thicknesses, defined by the distance between the central minimum and the adjacent maxima in the density-profile, were different (Fig. 6B,7A). The greater thickness of the “inner” leaflet (Fig. 6B,7A) suggested a more ordered structure with extended chains. The electron density profile of the thinner, “outer” leaflet (Fig. 6B) included a prominent local minimum that resembled the similar feature in the profile for dioleoyl phosphatidylcholine.35 These characteristics suggested that the inner layer would represent the ordered structures responsible for the sharp diffraction detected by WAXS (Fig. 5), and that the outer leaflet would be disordered.
7.

The thickness for components of the Lγ phase formed by PPL. A. Thickness of the two leaflets in the bilayer, determined from the distance between the minimum density at the center of the bilayer and the adjacent maxima (Fig. 6B). B. Thickness of the aqueous layers, determined from the distance between adjacent maxima in the electron density profile (Fig. 6B). The y-axis is split to optimize display of the variation with Rh.
Two local minima in the electron density, corresponding to aqueous layers, separated each bilayer from its neighbors (Fig. 6B,C). The thickness of these two aqueous layers differed by more than a factor of two (Fig. 7B). The thicker layer (#2 in Fig. 6B), adjacent to the leaflet that should be more disordered, expanded with increasing Rh, while the layer adjoining the ordered leaflet (#1) retained a relatively constant thickness (Fig. 7B).
Cholesterol:
In addition to the phospholipids, pulmonary surfactant contains cholesterol. This compound tends to insert into phospholipids with crystalline chains and disrupt their packing.33 If the crystalline structure is an essential component of the Lγ phase, cholesterol might prevent its formation. We therefore measured scattering from samples containing the complete set of neutral and phospholipids (N&PL) to determine how physiological levels of cholesterol affected the structures formed by the phospholipids.
N&PL formed structures with the essential characteristics of the Lγ phase. Oriented films produced lamellar diffraction (Fig. 8A) that persisted to the highest Rh of 99% (data not shown at that Rh). The lattice constant was large (ao = 11.9 nm at Rh = 99% and 30°C). WAXS from dispersed samples again showed a broad peak with superimposed diffraction (Fig. 8B). The values of q for the diffracted peak that indicates ordered chains were indistinguishable for PPL and N&PL. The electron density profile determined from SAXS for the oriented films showed two asymmetric regions of low density, corresponding to asymmetric bilayers arranged as mirror images (Fig. 8C). The bilayers were again separated by local density minima, corresponding to aqueous layers that differed substantially in thickness. Both SAXS from the oriented films and WAXS from the dispersed samples indicated that physiological levels of cholesterol had minimal effect on formation of the Lγ phase.
8.

X-ray scattering from N&PL. A. Diagnostic plot, based on I(q) measured by SAXS from oriented films, for Rh = 97%. B. WAXS from dispersed samples at ϕw = 0.508. Traces at temperatures above 11°C are shifted vertically without change in scale. C. Electron density profile, calculated from the diffracted intensities obtained by SAXS from oriented films.
Anionic phospholipids:
Differential sorting of the phospholipids between the two leaflets presumably caused their different structures. That process might also account for the different thicknesses of the aqueous layers (Fig. 6B,7B,8C). Approximately 10% of the phospholipids in pulmonary surfactant are anionic, with the rest zwitterionic (e.g.,36 for calf surfactant). Partitioning of the anionic phospholipids into different leaflets would produce different charge on the two surfaces of the bilayer. Differences in hydration of those structures would cause the different aqueous thicknesses. We speculated that if the large aqueous layer represents an important element of the Lγ phase, the anionic lipids might be essential for its formation.
To test the importance of the anionic phospholipids, we removed those components chromatographically.28 Supported films of modified PPL (mPPL), without the anionic compounds, formed only standard lamellar structures, with values of ao appropriate for a single bilayer, at all Rh from 70–97% (Fig. 9A, open symbols, at protein = 0%). Without the anionic lipids, the Lγ structure was absent.
9.

Structural effects of the anionic phospholipids and surfactant proteins on supported films containing the surfactant phospholipids. Oriented films at 30°C contained the physiological mixture of the two hydrophobic surfactant proteins, in amounts expressed as % (w:w), combined with phospholipids. Diagnostic plots (Fig. 1B) determined the structural phases and lattice constants, ao, for: Lγ (only present in panel B); and standard lamellar structures (L), with no distinction between Lα and Lβ’. The legend applies to both panels. A. mPPL, containing PPL modified by removal of anionic compounds. B. PPL.
Hydrophobic surfactant proteins:
Complete extracts of pulmonary surfactant contain two cationic proteins that might counteract the anionic lipids. The hydrophobic proteins, SP-B and SP-C, have net charges in bovine surfactant of +12 and +2/molecule, respectively.37 To establish whether the proteins affect formation of the Lγ phase, we formed oriented films of the surfactant lipids mixed with progressively larger amounts of the two proteins in their physiological ratio. Initial experiments determined how the proteins affected PPL (Fig. 9B). Comparable samples with mPPL, without the anionic compounds, served as controls (Fig. 9A).
As much as 1% (w:w) protein, just below the physiological level of 1.5%, had minimal effect on the structures formed by PPL (Fig. 9B). The oriented films continued to form the Lγ and coexisting standard lamellar phases. The lattice-constants were unchanged. Increasing the protein further to 3% substantially reduced ao and restricted Lγ to Rh ≤ 80% (Fig. 9B). Samples with 10% protein contained only the standard lamellar structures, without evidence for the Lγ phase (Fig. 9B). These results indicated that sufficient amounts of the proteins suppressed the ability of the anionic phospholipids to induce the Lγ phase.
Our studies also considered whether the proteins could eliminate formation of the Lγ phase by the complete set of surfactant lipids, including cholesterol as well as the phospholipids. N&PL and CLSE combined in different ratios, expressed as XCLSE, the mol fraction of phospholipid from CLSE, varied the content of the proteins in combination with the same surfactant lipids. Increasing amounts of the proteins produced essentially no effect on the lattice-constant of the Lγ phase or the coexisting standard lamellar structures (Fig. 10). The proteins did, however, restrict formation of the Lγ phase. At XCLSE = 0.7, the samples contained large lamellar structures only at and below a Rh of 80% (Fig. 10). Samples with XCLSE of 0.9 and 1.0 formed two standard lamellar phases, with no evidence for the Lγ structures at any humidity (Fig. 10). The experiments with PPL (Fig. 9B) had left open the possibility that the proteins might prevent formation of the Lγ phase only at supraphysiological levels above 3%. With the N&PL-CLSE mixtures, physiological levels of the proteins were more than adequate to suppress the Lγ structures.
10.

Structural effects of the hydrophobic surfactant proteins on supported films containing the complete set of surfactant lipids. Samples contained the complete surfactant extract, CLSE, with both the lipids and the proteins, combined with different amounts of the surfactant lipids without the proteins, N&PL. The mol fraction of phospholipid from CLSE (XCLSE) expressed the relative amounts of the two preparations present. Several samples contained more than one coexisting lamellar phase (L) with a standard ao, indicated by distinct symbols.
DISCUSSION
Structure:
A series of characteristics classically identifies the Lγ phase.19 SAXS should indicate diffraction with spacing that fits the pm space group of lamellar structures. The lattice constant of that structure should be large enough to accommodate two bilayers. WAXS should show sharp diffraction, indicating that the structure includes a crystalline array of acyl chains. WAXS may also show a broad peak from disordered chains, but the diffraction often obscures that signal. SAXS should ideally also indicate the absence of coexisting phases, eliminating any possibility that the important characteristics of SAXS and WAXS originate from different structures. Although our measurements include each of these criteria separately at different conditions, we are unable to demonstrate all characteristics in a single set of measurements. Our evidence for the Lγ phase rests instead most conclusively on the electron density profile.
The original studies of the Lγ phase used lipids that complicated analysis of the detailed structure. Lipids from mitochondria and myelin form the Lγ structures without a coexisting bulk aqueous phase only over a narrow range of low hydrations.19–20,22 ao for any Lγ phase occurring at higher hydrations, in the region of coexistence, remained relatively constant. Measurements during swelling provided minimal insight concerning how the scattered intensity varied with q, or how the sign of the scattering amplitude changed among the different peaks. The standard approach for solving the electron density profile was therefore unavailable. Analyzing the lower order moments of the Patterson maps from neutron scattering provided structures, but with uncertainty introduced by necessary assumptions.21
Lipids obtained from the lungs behave differently from these initial materials. The extracted samples from washed lung slices23 and the surfactant lipids studied here both expand significantly over a broad range of hydrations. This swelling allows phasing of the scattering amplitude, and determination of the electron density profile (Fig. 6,8).
Those profiles, together with the diffraction observed by WAXS, demonstrate unequivocally that the surfactant phospholipids, with or without cholesterol, form the Lγ phase (Fig. 6,8). The unit cell contains two bilayers. The leaflets of each bilayer are distinct. WAXS indicates that one leaflet contains crystalline chains. The greater thickness argues that the “inner” leaflet (Fig. 6B) contains the extended, ordered chains. The local minimum in the electron density profile for the “outer” leaflet, which resembles the similar feature observed for dioleoyl phosphatidylcholine,35 suggests a disordered structure. The density profile argues strongly for two bilayers that contain between them two ordered and two disordered leaflets. These features are the essential characteristics of the Lγ phase.
The profile distinguishes between the two possible arrangements of the leaflets within the bilayers. The bilayers are asymmetric and identical, arranged as mirror images (Fig. 6B,8C). The asymmetry is evident if the analysis is restricted to intensities at q < 4 nm−1. This observation reduces concern that incorrect signs of the scattering amplitude for weaker, higher order diffraction could explain the asymmetry. Our results confirm the asymmetric, identical bilayers suggested previously by neutron scattering.21
The detailed structure points out a feature not emphasized previously. The thicknesses of the two aqueous layers between the two bilayers are significantly different. The layer between the two disordered leaflets (#2 in Fig. 6B) is much larger and more variable than the aqueous region between the ordered monolayers (#1 in Fig. 6B).
Differences in the surface of the two leaflets would explain the different thicknesses. The leaflet with the crystalline chains should contain mostly DPPC. That constituent is the only major component of the lipids in calf surfactant that by itself can form crystalline chains at 30°C.36,38 In monomolecular films of PPL, the ordered domains that separate from the surrounding disordered regions contain essentially pure DPPC.11 The diffraction from crystalline chains observed here by WAXS has both the spacing and the temperature-dependence of DPPC. An ordered leaflet of DPPC would have a hydrophilic surface of zwitterionic phosphatidylcholine headgroups that is net neutral. In contrast, the surface of the disordered monolayer should be charged. Essentially all of the anionic phospholipids in pulmonary surfactant should have low melting transitions38 and a preference for disordered structures. Partitioning of these constituents into the disordered layer would give that surface a net negative charge, resulting in greater hydration and a thicker adjacent aqueous layer (Fig. 6C). The well known ability of anionic phospholipids to swell considerably beyond the limited expansion of zwitterionic lipids39 supports this possibility.
Constituents:
Anionic phospholipids:
These structural observations suggest that the anionic lipids might be essential for forming the Lγ phase. Lipids shown previously to form Lγ structures are either known19–24 or likely25 to contain anionic compounds. Removal of the anionic compounds from the surfactant phospholipids prevents formation of the Lγ structure (Fig. 9). Along with phospholipids capable of having crystalline chains, the Lγ phase requires anionic phospholipids.
Hydrophobic proteins:
Sufficient amounts of the hydrophobic proteins, both of which are cationic, prevent formation of the Lγ structures. The simple explanation, however, that the proteins neutralize the essential charge of the anionic phospholipids is unlikely. In mixtures with PPL, the proteins significantly restrict formation of the Lγ phase when levels reach 3% (w:w). The net charge per phospholipid at that point falls only from −0.100 for the lipids alone to −0.086 (Table S1.A). For mixtures of N&PL and CLSE, the Lγ phase begins to disappear at XCLSE = 0.7, when the net molecular charge has fallen only by 5% to −0.095 (Table S1.B). In addition to their electrostatic effect, the proteins induce large changes in the spontaneous curvature of the lipids;40 they may also alter flexibility of the leaflets. These effects seem more likely to explain the inhibition of the Lγ phase than a reduction in net charge.
Cholesterol:
Pulmonary surfactant contains cholesterol in amounts that are fairly small, ~8% (mol:mol),28 but important. The cholesterol converts the coexisting phases from solid-fluid to fluid-fluid. In monomolecular films of PPL, solid domains retain their irregular shapes for hours.11 With the additional presence of cholesterol in N&PL, the domains instead have circular shapes that can change quickly.41 Similar effects occur in the corresponding bilayers.42–43 Cholesterol achieves these effects by inserting between the extended chains of the crystalline structure and disrupting packing.33 We fully expected that cholesterol would prevent formation of the Lγ phase.
Cholesterol, in fact, had minimal effect. WAXS specifically continues to detect crystalline packing of the acyl chains. These results suggest three possible explanations. The cholesterol could imbed in the ordered leaflet, but the amount could be insufficient to disrupt the crystalline packing. Cholesterol could instead partition into the disordered leaflet, leaving the crystalline structure unaffected. Finally, the coexisting standard lamellar phases, which occur for films of N&PL over the full range of hydrations tested, could absorb the cholesterol. Our results provide no basis for distinguishing among these possibilities.
Oriented films and dispersed samples:
The two kinds of samples contain qualitatively similar structures. SAXS from both structures demonstrates two coexisting lamellar phases with lattice constants that differ roughly by a factor of two. There are, however, significant differences, particularly with larger amounts of water. At high ϕw, the scattering peaks for the dispersed samples become quite broad (Fig. 4), suggesting bilayers that fluctuate widely. The lattice-constant also becomes much larger for the dispersed samples than for the oriented films. Although unconfirmed, the simplest explanation for this disparity is that the solid support restricts fluctuations of the oriented films. The unrestricted fluctuations in the dispersed samples would cause greater separation of adjacent bilayers, resulting in the larger lattice constant.
Physiology:
The original report of the Lγ phase in material obtained from the lungs23 suggested that the structure could address both aspects of a fundamental challenge for pulmonary surfactant. Constituents must adsorb rapidly to form an interfacial film, but then desorb slowly during compression to the high densities that achieve low surface tensions.9 Before the discovery of the hydrophobic surfactant proteins, this problem was considered strictly in terms of the phospholipids.44 Compounds with lower melting transitions form disordered, fluid structures that might adsorb rapidly. DPPC, with its higher transition, forms solid structures that resist collapse. The spontaneous formation in the Lγ phase of leaflets with each characteristic might explain both rapid adsorption and slow desorption.
The proteins in pulmonary surfactant, however, and particularly SP-B, cause the rapid adsorption rather than the lower melting lipids.45–47 Disordered phospholipids by themselves adsorb slowly and incompletely.48 Our interest in the Lγ phase has therefore focused on whether the structure provides a mechanism by which a functional alveolar film capable of reaching low surface tensions would form by self-assembly.
The two distinct structural aspects of the Lγ phase, the crystalline chains and the multiple bilayers, might each contribute to the stability of the alveolar film. Individual monolayers with crystalline chains, formed by DPPC, replicate the performance of the alveolar films.49 An Lγ phase at the air/water interface, oriented with an ordered leaflet at the surface, should contribute that essential element which resists collapse at low surface tensions.
The multiple layers of a Lγ film might also resist collapse. Microscopic studies show that at least portions of the alveolar films are multilamellar rather than monomolecular.50–51 Although unconfirmed by experimental evidence,3 this observation has led to speculation that the additional layers might slow collapse. To explain the stability of the initial film, this view requires that the multilayer forms during adsorption rather than collapse. Self-assembly of the Lγ phase would explain how such a structure would form.
Several aspects of our studies complicate assessment of whether the Lγ phase should form under physiological conditions.
Our results show that the structure occurs in interfacial films as well as in dispersed samples. The solid/water interface studied here, however, differs significantly from the air/water interface.
The Lγ phase apparently requires anionic phospholipids. That finding suggests that the ionic strength of the medium may be influential. That variable is at least difficult to control in experiments with oriented films, which form from solutions of nonpolar solvents.
The Lγ phase forms in samples containing all of the surfactant constituents. With the complete set of surfactant lipids, however, the proteins just below physiological levels prevent its formation.
The surfactant proteins inhibit formation of the Lγ phase only at high hydrations. That result allows the possibility that conditions in situ might be conducive to forming the Lγ phase. Prior reports have suggested that both a specific therapeutic surfactant52 and intracellular lamellar bodies53 have reduced hydrations. Most therapeutic surfactants, however, are administered as fluid dispersions, suggesting that their water-content is not greatly restricted. A requirement for reduced hydrations, and the Lγ phase, to achieve functional surfactant is unconfirmed.
Although the Lγ phase represents a structure with potentially profound functional implications, whether that structure should occur in the alveolus remains uncertain.
CONCLUSIONS
X-ray scattering at small and wide angles show that the surfactant lipids form the Lγ phase. This structure persists in oriented films at Rh = 99%. The electron density profile confirms that the two bilayers of the unit cell are identical, arranged as mirror images, and provide structural details that suggest the likely location of the anionic phospholipids. Compositional variation shows that, in addition to both low- and high-melting phospholipids, the Lγ phase requires anionic phospholipids. The cationic proteins inhibit formation of the Lγ structures, although not by affecting net charge. Cholesterol in physiological amounts has surprisingly little effect.
Supplementary Material
Figure S1: SAXS and WAXS from PPL under conditions that produce only the Lγ phase, without coexistence.
Figure S2: Electron density profiles for PPL obtained with opposite assignments of sign for the scattering amplitude of the initial scattering peak.
Table S1: Calculations of the effect by added protein on net charge of the samples.
ACKNOWLEDGEMENTS
Dr. Edmund Egan, ONY, Inc. (Amherst, NY) provided the extracted calf surfactant from which all samples were obtained. Leonard E. Schulwitz, Jr. and Hamed Khoojinian contributed programs that greatly facilitated analysis of structural data. Maayan Dagan participated in analyzing the patterns of diffraction.
Funding Sources
These studies were supported by funds from the National Institutes of Health (HL54209, HL130130, HL136734). Measurements of X-ray scattering were performed at the Stanford Synchrotron Radiation Lightsource (SSRL), a Directorate of SLAC National Accelerator Laboratory and an Office of Science User Facility operated for the U.S. Department of Energy Office of Science by Stanford University. The SSRL Structural Molecular Biology Program is supported by the DOE Office of Biological and Environmental Research, and by the National Institutes of Health, National Institute of General Medical Sciences (including P41GM103393).
REFERENCES
- 1.Nag K; Perez-Gil J; Ruano ML; Worthman LA; Stewart J; Casals C; Keough KM Phase transitions in films of lung surfactant at the air-water interface. Biophys. J 1998, 74 (6), 2983–95. [DOI] [PMC free article] [PubMed] [Google Scholar]
- 2.Gaines GL Insoluble Monolayers at Liquid-Gas Interfaces. Interscience Publishers: New York, 1966, pp 144–151. [Google Scholar]
- 3.Schief WR; Antia M; Discher BM; Hall SB; Vogel V Liquid-crystalline collapse of pulmonary surfactant monolayers. Biophys. J 2003, 84 (6), 3792–3806. [DOI] [PMC free article] [PubMed] [Google Scholar]
- 4.Horie T; Hildebrandt J Dynamic compliance, limit cycles, and static equilibria of excised cat lung. J. Appl. Physiol 1971, 31 (3), 423–30. [DOI] [PubMed] [Google Scholar]
- 5.Valberg PA; Brain JD Lung surface tension and air space dimensions from multiple pressure-volume curves. J. Appl. Physiol 1977, 43 (4), 730–8. [DOI] [PubMed] [Google Scholar]
- 6.Schürch S Surface tension at low lung volumes: dependence on time and alveolar size. Respir. Physiol 1982, 48 (3), 339–355. [DOI] [PubMed] [Google Scholar]
- 7.Wilson TA Relations among recoil pressure, surface area, and surface tension in the lung. J. Appl. Physiol 1981, 50 (5), 921–30. [DOI] [PubMed] [Google Scholar]
- 8.Smith JC; Stamenovic D Surface forces in lungs. I. Alveolar surface tension-lung volume relationships. J. Appl. Physiol 1986, 60 (4), 1341–50. [DOI] [PubMed] [Google Scholar]
- 9.Clements JA Functions of the alveolar lining. Am. Rev. Respir. Dis 1977, 115 (6 part 2), 67–71. [DOI] [PubMed] [Google Scholar]
- 10.Bangham AD; Morley CJ; Phillips MC The physical properties of an effective lung surfactant. Biochim. Biophys. Acta 1979, 573 (3), 552–6. [DOI] [PubMed] [Google Scholar]
- 11.Discher BM; Schief WR; Vogel V; Hall SB Phase separation in monolayers of pulmonary surfactant phospholipids at the air-water interface: composition and structure. Biophys. J 1999, 77 (4), 2051–61. [DOI] [PMC free article] [PubMed] [Google Scholar]
- 12.Crane JM; Hall SB Rapid compression transforms interfacial monolayers of pulmonary surfactant. Biophys. J 2001, 80 (4), 1863–1872. [DOI] [PMC free article] [PubMed] [Google Scholar]
- 13.Smith EC; Crane JM; Laderas TG; Hall SB Metastability of a supercompressed fluid monolayer. Biophys. J 2003, 85 (5), 3048–3057. [DOI] [PMC free article] [PubMed] [Google Scholar]
- 14.Bermel MS; McBride JT; Notter RH Lavaged excised rat lungs as a model of surfactant deficiency. Lung 1984, 162 (2), 99–113. [DOI] [PubMed] [Google Scholar]
- 15.Bachofen H; Schürch S; Urbinelli M; Weibel ER Relations among alveolar surface tension, surface area, volume, and recoil pressure. J. Appl. Physiol 1987, 62 (5), 1878–87. [DOI] [PubMed] [Google Scholar]
- 16.Hu Q; Jiao B; Shi X; Valle RP; Zuo YY; Hu G Effects of graphene oxide nanosheets on the ultrastructure and biophysical properties of the pulmonary surfactant film. Nanoscale 2015, 7 (43), 18025–18029. [DOI] [PMC free article] [PubMed] [Google Scholar]
- 17.Zuo YY; Chen R; Wang X; Yang J; Policova Z; Neumann AW Phase transitions in dipalmitoylphosphatidylcholine monolayers. Langmuir 2016, 32 (33), 8501–8506. [DOI] [PMC free article] [PubMed] [Google Scholar]
- 18.Dagan MP; Hall SB The equilibrium spreading tension of pulmonary surfactant. Langmuir 2015, 31 (48), 13063–13067. [DOI] [PMC free article] [PubMed] [Google Scholar]
- 19.Gulik-Krzywicki T; Rivas E; Luzzati V Structure et polymorphisme des lipides: étude par diffraction des rayons X du système formé de lipides de mitochondries de coeur de boeuf et d’eau. J. Mol. Biol 1967, 27 (2), 303–322. [DOI] [PubMed] [Google Scholar]
- 20.Ranck JL; Mateu L; Sadler DM; Tardieu A; Gulik-Krzywicki T; Luzzati V Order-disorder conformational transitions of the hydrocarbon chains of lipids. J. Mol. Biol 1974, 85 (2), 249–277. [DOI] [PubMed] [Google Scholar]
- 21.Ranck JL; Zaccai G; Luzzati V The structure of a lipid-water lamellar phase containing two types of lipid monolayers. An X-ray and neutron scattering study. J. Appl. Crystallogr 1980, 13 (6), 505–512. [Google Scholar]
- 22.Mateu L; Luzzati V; London Y; Gould RM; Vosseberg FG X-ray diffraction and electron microscope study of the interactions of myelin components. The structure of a lamellar phase with a 150 to 180 A repeat distance containing basic proteins and acidic lipids. J. Mol. Biol 1973, 75 (4), 697–709. [DOI] [PubMed] [Google Scholar]
- 23.Gulik A; Tchoreloff P; Proust J A conformation transition of lung surfactant lipids probably involved in respiration. Biophys. J 1994, 67 (3), 1107–1112. [DOI] [PMC free article] [PubMed] [Google Scholar]
- 24.Bonanno LM; Denizot BA; Tchoreloff PC; Puisieux F; Cardot PJ Determination of phospholipids from pulmonary surfactant using an on-line coupled silica/reversed-phase high-performance liquid chromatography system. Analytical Chemistry 1992, 64 (4), 371–379. [DOI] [PubMed] [Google Scholar]
- 25.Larsson M; Haitsma JJ; Lachmann B; Larsson K; Nylander T; Wollmer P Enhanced efficacy of porcine lung surfactant extract by utilization of its aqueous swelling dynamics. Clin. Physiol. Funct. I 2002, 22 (1), 39–48. [DOI] [PubMed] [Google Scholar]
- 26.Bligh E; Dyer W A rapid method of total lipid extraction and purification. Can. J. Biochem 1959, 37, 911–917. [DOI] [PubMed] [Google Scholar]
- 27.Takahashi A; Fujiwara T Proteolipid in bovine lung surfactant: its role in surfactant function. Biochem. Biophys. Res. Comm 1986, 135 (2), 527–32. [DOI] [PubMed] [Google Scholar]
- 28.Hall SB; Wang Z; Notter RH Separation of subfractions of the hydrophobic components of calf lung surfactant. J. Lipid Res. 1994, 35 (8), 1386–94. [PubMed] [Google Scholar]
- 29.Hammersley AP; Svensson SO; Hanfland M; Fitch AN; Hausermann D Two-dimensional detector software: From real detector to idealised image or two-theta scan. High Pressure Res. 1996, 14 (4), 235–248. [Google Scholar]
- 30.Olah GA; Huang HW; Liu WH; Wu YL Location of ion-binding sites in the gramicidin channel by X-ray diffraction. J. Mol. Biol 1991, 218 (4), 847–58. [DOI] [PubMed] [Google Scholar]
- 31.Konarev PV; Volkov VV; Sokolova AV; Koch MHJ; Svergun DI PRIMUS: A Windows PC-based system for small-angle scattering data analysis. J. Appl. Crystallogr 2003, 36 (5), 1277–1282. [Google Scholar]
- 32.Perutz MF The Structure of Haemoglobin. III. Direct Determination of the Molecular Transform. Proc. Roy. Soc. A-Math. Phys 1954, 225 (1161), 264–286. [Google Scholar]
- 33.Mills TT; Huang J; Feigenson GW; Nagle JF Effects of cholesterol and unsaturated DOPC lipid on chain packing of saturated gel-phase DPPC bilayers. Gen. Physiol. Biophys 2009, 28 (2), 126–139. [DOI] [PMC free article] [PubMed] [Google Scholar]
- 34.Huang HW; Liu W; Olah GA; Wu Y Physical techniques of membrane studies -- Study of membrane active peptides in bilayers. Progress in Surface Science 1991, 38 (2), 145–199. [Google Scholar]
- 35.Tristram-Nagle S; Nagle JF Lipid bilayers: thermodynamics, structure, fluctuations, and interactions. Chem. Phys. Lipids 2004, 127 (1), 3–14. [DOI] [PMC free article] [PubMed] [Google Scholar]
- 36.Kahn MC; Anderson GJ; Anyan WR; Hall SB Phosphatidylcholine molecular species of calf lung surfactant. Am. J. Physiol 1995, 269 (513–5), L567–L573. [DOI] [PubMed] [Google Scholar]
- 37.Liu S; Zhao L; Manzanares D; Doherty-Kirby A; Zhang C; Possmayer F; Lajoie GA Characterization of bovine surfactant proteins B and C by electrospray ionization mass spectrometry. Rapid Commun. Mass Spectrom. 2008, 22 (2), 197–203. [DOI] [PubMed] [Google Scholar]
- 38.Markin CJ; Dick DL; Hall SB Complete compositional analysis of phospholipids in calf pulmonary surfactant. Am. J. Respir. Crit. Care Med. 1999, 161 (3), A896. [Google Scholar]
- 39.Hauser H Some aspects of the phase behaviour of charged lipids. Biochim. Biophys. Acta 1984, 772 (1), 37–50. [Google Scholar]
- 40.Chavarha M; Loney RW; Rananavare SB; Hall SB Hydrophobic surfactant proteins strongly induce negative curvature. Biophys. J 2016, 109 (1), 95–105. [DOI] [PMC free article] [PubMed] [Google Scholar]
- 41.Discher BM; Maloney KM; Grainger DW; Sousa CA; Hall SB Neutral lipids induce critical behavior in interfacial monolayers of pulmonary surfactant. Biochemistry 1999, 38 (1), 374–383. [DOI] [PMC free article] [PubMed] [Google Scholar]
- 42.Bernardino de la Serna J; Perez-Gil J; Simonsen AC; Bagatolli LA Cholesterol rules: direct observation of the coexistence of two fluid phases in native pulmonary surfactant membranes at physiological temperatures. J. Biol. Chem 2004, 279 (39), 40715–22. [DOI] [PubMed] [Google Scholar]
- 43.Andersson JM; Grey C; Larsson M; Ferreira TM; Sparr E Effect of cholesterol on the molecular structure and transitions in a clinical-grade lung surfactant extract. Proc. Natl. Acad. Sci. U.S.A. 2017, 114 (18), E3592–E3601. [DOI] [PMC free article] [PubMed] [Google Scholar]
- 44.Keough KMW Physical chemistry of pulmonary surfactant in the terminal air spaces In Pulmonary Surfactant : from molecular biology to clinical practice, Robertson B; van Golde LMG; Batenburg JJ, Eds.; Elsevier: Amsterdam; New York, 1992, pp 109–164. [Google Scholar]
- 45.Whitsett JA; Ohning BL; Ross G; Meuth J; Weaver T; Holm BA; Shapiro DL; Notter RH Hydrophobic surfactant-associated protein in whole lung surfactant and its importance for biophysical activity in lung surfactant extracts used for replacement therapy. Pediatr. Res 1986, 20 (5), 460–7. [DOI] [PubMed] [Google Scholar]
- 46.Wang Z; Gurel O; Baatz JE; Notter RH Differential activity and lack of synergy of lung surfactant proteins SP-B and SP-C in interactions with phospholipids. J. Lipid Res. 1996, 37 (8), 1749–60. [PubMed] [Google Scholar]
- 47.Klenz U; Saleem M; Meyer MC; Galla HJ Influence of lipid saturation grade and headgroup charge: a refined lung surfactant adsorption model. Biophys. J 2008, 95 (2), 699–709. [DOI] [PMC free article] [PubMed] [Google Scholar]
- 48.Biswas SC; Rananavare SB; Hall SB Effects of gramicidin-A on the adsorption of phospholipids to the air-water interface. Biochim. Biophys. Acta 2005, 1717 (1), 41–9. [DOI] [PMC free article] [PubMed] [Google Scholar]
- 49.Notter RH Surface chemistry of pulmonary surfactant: the role of individual components In Pulmonary Surfactant, Robertson B; van Golde LMG; Batenburg JJ, Eds.; Elsevier: Amsterdam, 1984, pp 17–64. [Google Scholar]
- 50.Ueda S; Kawamura K; Ishii N; Matsumoto S; Hayashi K; Okayasu M Morphological studies on lung surfactant. J. Jap. Med. Soc. Biol. Interface 1985, 16, 81–109. [Google Scholar]
- 51.Schürch S; Qanbar R; Bachofen H; Possmayer F The surface-associated surfactant reservoir in the alveolar lining. Biol. Neonate 1995, 67 (Suppl. 1) (61), 61–76. [DOI] [PubMed] [Google Scholar]
- 52.Morley CJ; Johnson P; Thorburn GD; Jenkin G; Bangham AD Physical and physiological properties of dry lung surfactant. Nature 1978, 271 (5641), 162–163. [DOI] [PubMed] [Google Scholar]
- 53.Cerrada A; Haller T; Cruz A; Pérez-Gil J Pneumocytes assemble lung surfactant as highly packed/dehydrated states with optimal surface activity. Biophys. J 2015, 109 (11), 2295–2306. [DOI] [PMC free article] [PubMed] [Google Scholar]
- 54.Sun RG; Zhang J The cubic phase of phosphatidylethanolamine film by small angle x-ray scattering. J. Phys. D: Appl. Phys 2004, 37 (3), 463–467. [Google Scholar]
- 55.Chavarha M; Khoojinian H; Schulwitz LE Jr.; Biswas SC; Rananavare SB; Hall SB Hydrophobic surfactant proteins induce a phosphatidylethanolamine to form cubic phases. Biophys. J 2010, 98 (8), 1549–57. [DOI] [PMC free article] [PubMed] [Google Scholar]
- 56.van Eijk M; De Haas CG; Haagsman HP Quantitative analysis of pulmonary surfactant proteins B and C. Anal. Biochem 1995, 232 (2), 231–7. [DOI] [PubMed] [Google Scholar]
Associated Data
This section collects any data citations, data availability statements, or supplementary materials included in this article.
Supplementary Materials
Figure S1: SAXS and WAXS from PPL under conditions that produce only the Lγ phase, without coexistence.
Figure S2: Electron density profiles for PPL obtained with opposite assignments of sign for the scattering amplitude of the initial scattering peak.
Table S1: Calculations of the effect by added protein on net charge of the samples.