

Summary
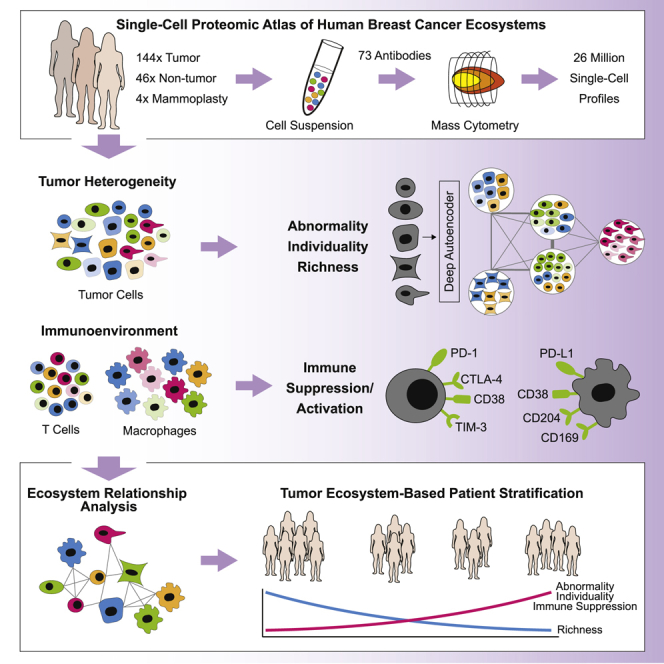
Breast cancer is a heterogeneous disease. Tumor cells and associated healthy cells form ecosystems that determine disease progression and response to therapy. To characterize features of breast cancer ecosystems and their associations with clinical data, we analyzed 144 human breast tumor and 50 non-tumor tissue samples using mass cytometry. The expression of 73 proteins in 26 million cells was evaluated using tumor and immune cell-centric antibody panels. Tumors displayed individuality in tumor cell composition, including phenotypic abnormalities and phenotype dominance. Relationship analyses between tumor and immune cells revealed characteristics of ecosystems related to immunosuppression and poor prognosis. High frequencies of PD-L1+ tumor-associated macrophages and exhausted T cells were found in high-grade ER+ and ER− tumors. This large-scale, single-cell atlas deepens our understanding of breast tumor ecosystems and suggests that ecosystem-based patient classification will facilitate identification of individuals for precision medicine approaches targeting the tumor and its immunoenvironment.
Keywords: breast cancer, tumor ecosystem, tumor heterogeneity, immunosuppression, T cell, macrophage, single-cell analysis, mass cytometry
Graphical Abstract
Highlights
-
•
Single-cell proteomics reveals tumor and immune cell diversity in tumor ecosystems
-
•
Breast cancer exhibits tumor cell phenotypic abnormalities and tumor individuality
-
•
PD-L1+ TAMs and exhausted T cells are abundant in high-grade ER− and ER+ tumors
-
•
Tumor-immune relationships in the tumor ecosystem are patient-stratifying
A single-cell atlas of cancer and immune cells reveals distinct tumor ecosystems across breast cancer patients, informing prognosis and, potentially, therapy selection.
Introduction
Breast cancer is the major cause of cancer death among women worldwide (Torre et al., 2017). A major obstacle for implementation of precision medicine is our lack of understanding of breast cancer ecosystems. Tumor ecosystems are comprised of cancer cells, infiltrating immune cells, stromal cells, and other cell types together with non-cellular tissue components (McAllister and Weinberg, 2010). Cancer cells and tumor-associated cells are phenotypically and functionally heterogeneous because of genetic and non-genetic sources. Targets of current therapies and therapies under development, including the estrogen receptor (ER), HER2, the phosphatidylinositol 3-kinase (PI3K), the AKT serine/threonine kinases (AKTs), the mammalian target of rapamycin (mTOR), the androgen receptor (AR), the epidermal growth factor receptor (EGFR), the poly (ADP-ribose) polymerase (PARP), BCL-2, Survivin, CDK4, CDK6, and methyltransferases, are heterogeneously expressed within and between patients (Marusyk et al., 2012). This heterogeneity equips cancer cells for proliferation, survival, and invasion and likely underlies differential treatment efficacies (Ramos and Bentires-Alj, 2015). Recent single-cell genomic and transcriptomic analyses of breast cancer provided insights into intratumor genomic diversity and intertumor differences in clonal composition, but very few cells and tumors were analyzed (Chung et al., 2017, Nik-Zainal et al., 2012). In the healthy mammary gland, phenotypes of luminal and myoepithelial (basal) cells are tightly controlled (Visvader and Stingl, 2014). Luminal cells heterogeneously express ER, the progesterone receptor (PR), and the cytokeratins K7, K8, and K18, whereas basal cells express K5, K14, and smooth muscle actin (SMA) for proper tissue function (Santagata et al., 2014).
Tumor ecosystems are further shaped by cellular relationships and strategies targeting relationships that promote tumor development hold considerable promise (McAllister and Weinberg, 2010). Examples are immune checkpoint inhibition therapies targeting exhausted and regulatory T cells (T-regs) (Wherry and Kurachi, 2015, Vargas et al., 2018). T cell exhaustion can be mediated by tumor cells, tumor-associated macrophages (TAMs), and stromal cells through activation of co-inhibitory receptors such as PD-1, CTLA-4, and TIM-3. T-regs can secrete immunosuppressive cytokines (Quail and Joyce, 2013). Ongoing clinical trials suggest that the response rates to checkpoint inhibition therapies in breast cancer are not comparable with those of melanoma or lung cancer patients, likely because of lower immunogenicity (Dieci et al., 2016). However, in cohorts selected for patients with PD-L1+ breast tumors, higher overall response rates have been reported (Wein et al., 2018). TAMs can modulate tumor ecosystems either through immunosuppressive actions (e.g., PD-L1 expression) or by promoting tumor growth, angiogenesis, and invasion (Cassetta and Pollard, 2018, Quail and Joyce, 2013) and are thus promising therapeutic targets.
Given the heterogeneity of cell phenotypes and cellular relationships in breast cancer, patient classification and treatment should ideally consider the entire tumor ecosystem. Recent single-cell RNA sequencing studies provided a glimpse into breast cancer immune cell phenotypic diversity and ecosystems (Azizi et al., 2018, Chung et al., 2017), laying a foundation for studies using large patient cohorts. Currently, however, breast tumors are stratified for clinical purposes based on tumor cell expression of ER, PR, HER2, and the proliferation marker Ki-67 (Coates et al., 2015). These biomarkers are used for treatment decisions, serve as surrogates for prognostic gene expression profiles, and categorize tumors as luminal A (ER+ and/or PR+, HER2−, Ki-67+ < 20%), luminal B (ER+ and/or PR+, HER2−, Ki-67+ ≥ 20%), luminal B-HER2+ (ER+ and/or PR+, HER2+), HER2+ (ER−PR−HER2+), and triple-negative (TN; ER−PR−HER2−) (Perou et al., 2000). Alternative classification schemes based on gene expression and genomic alterations have been proposed (Curtis et al., 2012). In addition, pathological tumor grading assesses morphological deviation of tumor tissue and cells from normal to predict patient prognosis (American Joint Committee on Cancer, 2017). Although these stratifications have improved therapy success, patient responses vary within each subtype, demanding better characterization of breast cancer ecosystems.
Here we applied single-cell mass cytometry (Bandura et al., 2009, Bendall et al., 2011) to millions of cells from 144 human breast tumor samples covering all clinical subtypes to elucidate the phenotypic diversity and tumor-immune cell relationships in breast cancer ecosystems. Non-tumor controls comprised 46 samples juxtaposed to tumor tissue (“juxta-tumoral”) and four mammoplasty samples from breast cancer-free individuals. Our data revealed vast phenotypic diversity among tumor and immune cells in breast cancer ecosystems. To quantify aspects of tumor heterogeneity, we introduced computational scores describing tumor phenotypic abnormality, individuality, and richness. Each tumor ecosystem was composed of tumor cells with varying phenotypic abnormalities, and tumor cell phenotypes associated with therapy resistance were abundant. We identified tumor and immune cell phenotypes and phenotype relationships linked to poor prognosis, immunosuppression, and response to checkpoint inhibitor immunotherapy in high-grade ER− tumors and in high-grade ER+ tumors, which are typically not associated with immunogenicity. This single-cell atlas provides a foundation for patient classification based on the breast cancer ecosystem.
Results
A Single-Cell Proteomic Atlas of Breast Cancer Ecosystems
We performed large-scale mass cytometry profiling of 144 prospectively collected tumor samples, including 54 luminal A, 71 luminal B, six luminal B-HER2+, one HER2+, and six TN tumors (Tables S1 and S2; Coates et al., 2015). Histopathology divided the samples into 106 invasive ductal, 15 invasive lobular, and 19 mixed or other tumors (Table S2). An automated system was used to generate single-cell suspensions from all tissue samples (STAR Methods). These samples and seven breast cancer cell lines were mass tag-barcoded (Zunder et al., 2015), pooled for antibody staining with 73 antibodies, and simultaneously analyzed by mass cytometry (Figures 1A and S1A; STAR Methods). An immune cell-centric antibody panel focused on immune phenotyping and was based on our recent immune cell atlas of clear cell renal cell carcinoma (ccRCC) (Chevrier et al., 2017; Table S3). A tumor cell-centric panel was built to quantify markers that identify mammary cell types, signaling, proliferation, and survival (Table S4). Application of our workflow yielded 26 million single-cell profiles with an average of 84.7% live, non-apoptotic cells per sample (Figures S1B and S1C).
Figure 1.

A Single-Cell Proteomic Atlas of Breast Cancer Ecosystems
(A) Experimental approach.
(B) t-SNE plots of EpCAM, CD45, CD31, and FAP expression in 58,000 cells from all samples using a 0 to 1 normalization.
(C) t-SNE as in (B), colored by cell type.
(D and E) Frequencies of live epithelial cells, immune cells, endothelial cells, and fibroblasts for (D) mammoplasty (M), juxta-tumoral (JT), and tumor (T) samples and (E) tumor subtypes.
Wilcoxon rank-sum test was used for statistical analysis. ∗p < 0.05, ∗∗p < 0.01, ∗∗∗p < 0.001. See also Figure S1.
Figure S1.

Cell Type Identification for a Single-Cell Atlas of Breast Cancer, Related to Figure 1
(A) Antibody staining strategy. (B) Viable cell frequencies of mammoplasty (M), juxta-tumoral (JT), and tumor (T) samples. (C) Gating strategy used to isolate live, non-apoptotic cells without gadolinium background staining. (D) Correlation of the intensity of measured markers in cell lines between barcoding plates. (E) Correlation of live cell and immune cell frequency of the same tumor samples between staining panels. (F and G) Correlations between principal components and F) marker abundances and G) possible experimental confounders. (H) Histograms showing the expression of ERα, PRB, and HER2 in breast cancer cell lines, single tumors, and cells from all tumors combined. (I and J) Comparison of the percentages of receptor-positive cells in tumors to pathological receptor status. (K) Gate for Ki-67+ cells. (L) Spearman correlation of the percentages of Ki-67+ cells determined by immunohistochemistry versus mass cytometry. (M) Heatmap showing normalized marker expression for the cell phenotype PhenoGraph clusters. (N) t-SNE plot colored by cluster. (O) Gating strategy to identify fibroblast subsets based on FAP and SMA. (P) Fibroblast subset frequencies in mammoplasty (M), juxta-tumoral (JT), and tumor (T) tissues (left) and by tumor subtype (right).
To ensure high data quality, we confirmed the similarity of marker expression of duplicate samples across barcoding plates and of live cell and immune cell frequencies across antibody panels (Figures S1D and S1E). Neither sample collection nor processing led to batch effects (Figures S1F and S1G; STAR Methods). Minimal spillover between mass detection channels was corrected using a bead-based compensation workflow (Chevrier et al., 2018). The frequencies of ER+, PR+, HER2+, and Ki-67+ tumor cells, determined by mass cytometry, were comparable with the matched pathological immunohistochemistry scores (Figures S1H–S1L; STAR Methods).
To visualize the diversity of tumor and non-tumor cells, we generated two-dimensional graphs using the dimensionality reduction algorithm t-distributed stochastic neighbor embedding (t-SNE; Van Der Maaten and Hinton, 2008; Figure 1B; STAR Methods). Most cells were epithelial (expressing the epithelial cell adhesion molecule [EpCAM], E-Cadherin, and epithelial cytokeratins) or immune (CD45+). Endothelial cells (CD31+) and fibroblasts (FAP+/−SMA+/−) were less abundant (Figure 1B). Additional fibroblast subsets (Costa et al., 2018) and adipocytes were likely among the cells described as “other” (Figure 1C). To compare cell type frequencies between tumor and non-tumor tissue, we applied the PhenoGraph algorithm (Levine et al., 2015), which partitioned our high-dimensional single-cell data into 42 clusters (Figures S1M and S1N; STAR Methods). Marker expression profiles reliably assigned these clusters to cell types (Figures 1C and S1M). Breast tumors were enriched for epithelial cells and contained fewer endothelial cells and fibroblasts than non-tumor tissues (Figure 1D). FAP+SMA+ fibroblasts were more abundant in tumors than in juxta-tumoral tissue (Figures S1O and S1P). The cell type frequencies varied among and between tumor subtypes, with a higher frequency of immune cells observed in TN and HER2+ samples than in other breast cancer types (Figures 1E and S1P).
The Immune Landscape of Breast Cancer
T cells and myeloid cells were the most abundant immune cell types in our study; fewer natural killer (NK) cells, B cells, granulocytes, plasma cells, basophils, and plasmacytoid dendritic cells were detected (Figures 2A and S2A–S2D). Breast tumors were enriched for T cells and B cells and contained a lower frequency of NK cells and granulocytes than juxta-tumoral tissue (Figure 2A). There was considerable inter-patient variation in tumor-associated immune cell frequencies (Figure 2A), as described previously (Azizi et al., 2018, Chevrier et al., 2017, Lavin et al., 2017).
Figure 2.

The Breast Cancer Immune Landscape
(A) Frequencies of selected immune cell types in juxta-tumoral and tumor samples.
(B) t-SNE plots of the normalized marker expression of 40,000 T cells from all samples.
(C) t-SNE of T cells colored by PhenoGraph cluster.
(D) Heatmap of normalized T cell marker expression for 20 T cell clusters. CM, central memory; Eff/Mem, effector and memory; Reg, regulatory; PD-1, PD-1+.
(E) Boxplots showing the frequencies of the CD4+ (left) and CD8+ T cell clusters (right) in juxta-tumoral and tumor samples.
(F) PD-1+ T cell frequency (top) and mean PD-1 expression (bottom) among tumor-derived CD4+ and CD8+ T cells.
(G) Comparison of the PD-1+ T cell frequency and mean PD-1 expression for CD8+ (top) and CD4+ T cells (bottom).
(H and I) Frequencies of selected T cell clusters in (H) ER+ and ER− tumors and (I) luminal A and B tumors.
(J) t-SNE plots of normalized marker expression of 40,000 myeloid cells from all samples.
(K) t-SNE of myeloid cells colored by PhenoGraph cluster.
(L) Heatmap of normalized myeloid marker expression for 19 myeloid clusters. Mono, monocyte; T.-res, tissue-resident; E. im., early immigrant; TAM, tumor-associated macrophage; MDSC, myeloid-derived suppressor cell.
(M) Frequencies of the myeloid clusters in juxta-tumoral and tumor samples.
(N and O) Frequencies of the indicated myeloid clusters in (N) ER+ and ER− tumors and (O) luminal A and B tumors.
Wilcoxon rank-sum test was used for statistical analysis. ∗p < 0.05, ∗∗p < 0.01, ∗∗∗p < 0.001. See also Figure S2.
Figure S2.

Immune Cell Phenotyping in Breast Tumor and Non-Tumor Tissue, Related to Figure 2
(A) Gate for immune cells. (B) t-SNE plots of normalized expression of markers used to identify the main immune cell types among 40,000 representative immune cells of all samples. (C) t-SNE plot of immune cells colored by cluster. (D) Heatmap of normalized marker expression for 27 clusters. NK cells, natural killer cells; pDCs, plasmacytoid dendritic cells. (E) Diffusion maps showing the CD4+ and CD8+ T cell clusters as a phenotypic continuum. T-regs were omitted. (F-I) PD-1+ T cell frequencies in F) juxta-tumoral and tumor samples, G) ER+ and ER- tumors, H) juxta-tumoral tissue and tumors by subtype, and I) tumors by grade. (J) T cell cluster frequencies in tumors by grade. (K-N) PD-L1+ TAM frequencies in K) juxta-tumoral and tumor samples, L) ER+ and ER- tumors, M) juxta-tumoral tissue and tumors by subtype, and N) tumors by grade. (O) Myeloid cluster frequencies in tumors by grade. Wilcoxon rank-sum test was used for statistical analysis. ∗ p < 0.05, ∗∗ p < 0.01, ∗∗∗ p < 0.001.
T cells and macrophages can exert pro-tumor or anti-tumor activities (Quail and Joyce, 2013). In-depth analyses of T cells by t-SNE and PhenoGraph identified ten CD4+ and ten CD8+ T cell clusters (T01–T20; Figures 2B–2D). Most T cell clusters had an effector memory phenotype (CD197low, CD45RAlow), and tumor-associated T cells existed as a phenotypic continuum across the CD4+ and CD8+ lineages (Figures 2D and S2E; Azizi et al., 2018, Egelston et al., 2018). Various levels of PD-1 and heterogeneous co-expression of co-inhibitory receptors and activation markers were detected among CD8+ (T11, T14, and T07) and CD4+ T cell clusters (T09, T13, and T18). An increase in PD-1 levels and receptor co-expression likely represent increasingly exhausted T cell states (Wherry and Kurachi, 2015). PD-1highCD8+ T cells (T11) expressed the co-inhibitory receptors TIM-3 and CTLA-4 and the activation markers HLA-DR and CD38 (Figure 2D). This phenotype was associated with T cell exhaustion and anti-PD-1 therapy response in melanoma (Daud et al., 2016, Sade-Feldman et al., 2018). PD-1highCD4+ T cells (T09 and T13) were positive for CTLA-4, CD38, and CD278 but negative for TIM-3 and HLA-DR. PD-1intCD8+ (T07 and T14) and PD-1intCD4+ T cells (T18) were negative for CTLA-4, TIM-3, HLA-DR, and CD38 (Figure 2D). T-regs (T01) were identified based on expression of CD4, FOXP3, CD25, and CTLA-4. T-regs and PD-1highCTLA-4+CD38+ T cells (T09, T11, and T13) were enriched in tumors compared with juxta-tumoral tissue (Figure 2E). The majority of patients showed PD-1+ T cells, which comprised up to 26.6% of total tumor-associated T cells but were rare in juxta-tumoral tissue (Figure S2F). Most PD-1+ T cells were found within the CD8+ compartment (Figure 2F, top). However, the mean expression level of PD-1 was higher in CD4+ than in CD8+ T cells (Figure 2F, bottom). The mean expression level of PD-1 and the PD-1+ T cell frequency correlated in the CD4+ and CD8+ compartments, supporting the hypothesis that these cells result from T cell expansion (Figure 2G; Keren et al., 2018, Li et al., 2019).
ER− breast cancer subtypes reportedly respond better to immune checkpoint blockade than ER+ subtypes (Dieci et al., 2016). We observed differences in the T cell landscapes of ER− and ER+ tumors, including a higher frequency of T-regs in ER− disease (Figure 2H). In more than half of ER− tumors (6 of 10) but only 12% of ER+ tumors (16 of 132), over 10% of T cells expressed PD-1 (Figure S2G). Distinct PD-1+ phenotypes were separately enriched: PD-1highCTLA-4+CD38+ T cells (T09, T11, and T13) were more frequent in ER− tumors, whereas PD-1intCTLA-4−CD38− T cells (T14) were enriched in ER+ tumors (Figure 2H). Many ER+ tumors did, however, show frequencies of PD-1highCTLA-4+CD38+ T cells and T-regs comparable with or higher than ER− tumors (Figure 2H). Therefore, our data support that patients with ER− tumors are candidates for immunotherapy (Dieci et al., 2016) and indicate that a subset of patients with ER+ tumors should benefit, too.
ER+ tumors can be divided into luminal A and luminal B based on low and high proliferation, respectively. More than 10% of T cells expressed PD-1 in 18% of luminal B tumors but only 7% of luminal A tumors (Figure S2H). PD-1intCTLA-4−CD38− T cells (T07) were more frequent in luminal A disease, and T-regs were enriched in luminal B tumors (Figure 2I). We also observed distinct T cell landscapes in tumors of different grades. PD-1+ T cells accounted for more than 10% of T cells in 28% of grade 3 tumors, 9% of grade 2 tumors, and 10% of grade 1 tumors (Figure S2I). Grade 3 tumors had more PD-1highCTLA-4+CD38+ T cells (T09 and T11) and fewer PD-1intCTLA-4−CD38− T cells (T07 and T14) than tumors of lower grades (Figure S2J). This demonstrates that an immunosuppressed T cell landscape is linked to poor-prognosis tumors, including ER−, high-proliferation, and high-grade tumors, but is also observed in a subset of ER+ tumors.
Breast Tumors Are Enriched for Immunosuppressive Macrophage Phenotypes
To characterize TAM populations, t-SNE and PhenoGraph were applied to all myeloid cells (Figures 2J and S2D), resulting in 19 myeloid clusters (M01–M19) of five categories: (1) CD14-expressing classic (M06, CD14+CD16−) and inflammatory monocytes (M15, CD14intCD16+), (2) early immigrant macrophages (M03, M11, M13, HLA-DRintCD192+), (3) tissue-resident macrophages (M08, M09, M16, CD206+HLA-DRint), (4) TAMs (M01, M02, M04, M14, M17, CD64highHLA-DRhigh), and (5) myeloid-derived suppressor cells (MDSC; M07, M10, M12, HLA-DR−/low) (Figures 2K and 2L). Consistent with previous reports (Azizi et al., 2018, Chevrier et al., 2017), the myeloid phenotypic space differed between tumor and juxta-tumoral regions (Figure 2M). In 80% of tumors, at least 10% of myeloid cells were PD-L1+ (Figure S2K; Cimino-Mathews et al., 2016). The PD-L1+ TAMs were phenotypically heterogeneous. TAMs in cluster M01 expressed CD38, the pro-tumor markers CD204, CD206, and CD163 and the anti-tumor marker CD169; TAMs in M02 expressed CD204, CD169, and intermediate levels of CD163 and CD38; and TAMs in M17 expressed CD169 and CD38 (Figure 2L). Expression of CD38 is associated with immunosuppressive macrophages in ccRCC patients and with MDSC-mediated T cell suppression in colorectal cancer (Chevrier et al., 2017, Karakasheva et al., 2018). Our results therefore link CD38 and PD-L1 and confirm co-expression of pro- and anti-inflammatory markers by tumor-associated myeloid cells, including PD-L1+ TAMs (Azizi et al., 2018, Chevrier et al., 2017). Tumors were enriched for TAMs and depleted of tissue-resident macrophages (M08 and M09), classical circulating (M06), and pro-inflammatory (M15) monocytes compared with juxta-tumoral tissue (Figure 2M).
Infiltration by TAMs is associated with aggressive disease (Quail and Joyce, 2013). ER− tumors contained higher frequencies of M01 and M17 PD-L1+ TAMs and fewer myeloid cells with M04, M05, M10, or M12 phenotypes compared with ER+ tumors (Figure 2N). A subset of ER+ tumors had M01 and M02 PD-L1+ TAMs at frequencies comparable with or higher than ER− tumors (Figures 2N and S2L). Luminal B tumors contained more myeloid cells with the M07 or M17 phenotype, less with the M04 phenotype, and more PD-L1+ TAMs compared with luminal A tumors (Figures 2O and S2M). PD-L1+ TAMs were enriched in grade 3 tumors compared with grade 2 tumors (Figure S2N). Grade 3 tumors contained fewer cells with the M04 or M05 phenotype but more classical monocytes (M06) than lower-grade tumors (Figure S2O).
Tumor Epithelial Cells Are Heterogeneous and Phenotypically Abnormal
The analysis of epithelial cells from tumor and non-tumor tissues (STAR Methods) revealed bimodal and gradient-like expression of epithelial markers, indicative of many distinct cell phenotypes (Figures 3A and 3B). A consensus clustering approach implemented in PhenoGraph (Figure S3A; STAR Methods) revealed 45 epithelial clusters (Ep01–Ep45). Hierarchical clustering classified these into seven luminal groups, L1–L7, and two basal groups, B1 and B2, based on marker expression (Figures 3C, S3B, and S3C).
Figure 3.

Tumor Cell Phenotypic Landscape in Breast Cancer
(A) t-SNE plots of normalized marker expression of 180,000 epithelial cells from all samples.
(B) t-SNE highlighting the distribution of cells from tumor, juxta-tumoral, and mammoplasty tissue.
(C) Heatmap of normalized epithelial cell marker expression for 45 epithelial clusters (left) and percentage and total number of cells from mammoplasty (M), juxta-tumoral (JT), and tumor (T) tissue for each cluster (right).
(D and E) Histograms of the expression of epithelial lineage markers in (D) cells derived from juxta-tumoral tissue and (E) cell lines.
(F) Frequencies of cells of individual cluster groups by tumor subtype.
Wilcoxon rank-sum test was used for statistical analysis. ∗p < 0.05, ∗∗p < 0.01, ∗∗∗p < 0.001. See also Figure S3.
Figure S3.

In-Depth Analysis of Breast Tumor Cell Phenotypes, Related to Figure 3
(A) Adjusted Rand index (ARI) values for 100 independent PhenoGraph runs using k = 100. Each boxplot corresponds to the distribution of the ARI between each run and all other runs. (B and C) t-SNE plots of epithelial cells colored by B) cluster and C) cluster group as defined by hierarchical clustering. (D) Biaxial plots showing luminal progenitor (LP, blue), luminal differentiated (L, green), and basal cells (B, red). (E) Expression of K8, K18, K7, K5, K14, ERα, and Ki-67 in clusters Ep31 (top) and Ep39 (bottom) of juxta-tumoral tissue-derived cells. (F) Histograms showing the expression of epithelial markers in tumor-derived cells by cluster group. (G) Expression of Ki-67 and EpCAM in tumor-derived cells by cluster group. (H) Percentages of K14+, K5+, K7+, K8+, and K18+ cells in juxta-tumoral and tumor samples by subtype. (I) Percentage of cells with EMT phenotype in tumors by subtype. (J and K) Percentage of Ki-67+ cells in juxta-tumoral and tumor samples by J) subtype and K) grade. Wilcoxon rank-sum test was used for statistical analysis. ∗ p < 0.05, ∗∗ p < 0.01, ∗∗∗ p < 0.001.
We identified luminal and myoepithelial cells in mammoplasty and juxta-tumoral tissue based on lineage marker expression patterns (Figures 3C, 3D, and S3D; Santagata et al., 2014, Visvader and Stingl, 2014). Mammary epithelial cell lines confirmed the reliability of these patterns (Figure 3E; Neve et al., 2006). About 63% of cells from mammoplasties and 77% of juxta-tumoral tissue-derived cells were members of groups L1 and L2, characterized by expression of K7, K8, and K18 and low levels of or no ERα (Figures 3C and 3D). Strong expression of EpCAM and low levels of the adhesion integrin CD49f indicated luminal cell maturity (Figures 3C and S3D; Stingl et al., 2001). Proliferating (Ki-67+) non-tumor luminal cells were also identified (Figure S3E; Santagata et al., 2014). About 55% of tumor-derived cells were members of groups L1 and L2, showing that differentiated normal-like luminal cells were abundant in tumor samples.
Groups L3–L7 were dominated by tumor cells (Figure 3C). Group L3 phenotypes showed high levels of EpCAM and CD49f and low ERα expression (Figures 3C and S3D–S3F), characteristics of luminal progenitor cells (Stingl et al., 2001). Group L4 phenotypes displayed high levels of the hormone receptors ERα, progesterone receptor B (PRB), and AR and the receptor tyrosine kinases HER2, EGFR, and the hepatocyte growth factor receptor (c-MET) (Figures 3C and S3F), which are involved in tumor cell proliferation and migration (Hsu and Hung, 2016). Co-expression of these receptors with ERα or HER2 can confer resistance to anti-ERα and anti-HER2 treatments (Hsu and Hung, 2016, Murphy and Dickler, 2016). Strong receptor tyrosine kinase expression and high levels of ERα, the methyltransferase EZH2, its target H3K27me3, and the anti-apoptotic factors Survivin and BCL-2 were observed in group L5 (Figures 3C and S3F). EZH2-induced epigenetic alterations can equip tumor cells for expansion and invasion (Visvader and Stingl, 2014). Survivin and BCL-2 are associated with cell death evasion and risk of recurrence in ER+ disease (Parker et al., 2009). Group L6 phenotypes expressed K7, K8, K18, ERα, HER2, low levels of CD49f, and high levels of E-Cadherin and CD24 (Figures 3C and S3F), indicative of luminal cell maturity with ERα and HER2 pathway activity. Group L7 phenotypes were ERα− and HER2low and expressed HLA-DR, a surface receptor associated with tumor immunogenicity (Figures 3C and S3F; Park et al., 2017). Lack of ERα and HER2 is associated with resistance to anti-ERα and anti-HER2 treatments. Ki-67+ luminal tumor cells were found in all luminal cluster groups and were most frequent in group L7 (Figure S3G).
Group L1–L7 phenotypes were differently distributed across tumor subtypes. Group L1 and L2 phenotypes indicative of mature luminal cells and group L4 and L5 phenotypes strongly expressing ERα were more frequent in luminal A and B tumors than in HER2+ and TN tumors (Figure 3F). Proliferating group L7 phenotypes were frequent in several luminal B tumors, a few luminal A tumors, and one TN tumor. Luminal B-HER2+ and HER2+ tumors contained cells from groups L3 and L6 (Figure 3F). Many luminal tumors contained fewer K7+ and more K8+ and K18+ cells than adjacent non-tumor tissue (Figure S3H), suggesting a cytokeratin switch possibly induced by upregulated PI3K and AKT signaling (Fortier et al., 2010). ERα+ cells varied between 2% and 91% (median, 26.7%; interquartile range [IQR], 26.8%), and ERα+AR+ cells varied between 0% and 44% (median, 1.7%; IQR, 4.3%) in ER+ tumors.
We identified basal cell phenotypes in group B1 based on expression of K5, K14, and Vimentin and in group B2 based on expression of SMA, Vimentin, and low levels of K5 and K14. All basal phenotypes lacked expression of K7, K8, K18, ERα, and HER2 (Figure 3C). Non-tumor cells with a basal phenotype were likely myoepithelial cells (Figure 3E; Santagata et al., 2014). In contrast to juxta-tumoral tissue, myoepithelial cells were sparse in mammoplasty samples, possibly as a consequence of obesity (Chamberlin et al., 2017). Basal-like tumor cells displayed high levels of Ki-67, EGFR, and the tumor suppressor p53 (Figures S3F and S3G). Overexpression of EGFR and p53 and lack of ERα and HER2 are characteristics of aggressive, difficult-to-treat cancers (Perou et al., 2000). Both basal-like and luminal ERα−HER2−PRBdim phenotypes expressed high levels of Survivin, indicative of survival pathway activity. The majority of luminal tumor samples (130 of 135) contained few cells with a basal phenotype (0% to 5%, median, 0.35%), consistent with a loss of myoepithelial cells (Sternlicht and Barsky, 1997). Cells of group B2 were abundant in TN tumors (Figure 3F), in line with a basal-like molecular subtype (Perou et al., 2000). Tumor cells with a basal phenotype and tumor cells in luminal clusters Ep16 and Ep32 co-expressed EpCAM, E-Cadherin, and Vimentin, an epithelial-mesenchymal transition (EMT) phenotype associated with tumor cell invasion and resistance to chemotherapy (Fischer et al., 2015). Tumor cells with the EMT phenotype were found in TN tumors and in several luminal A and B tumors (Figure S3I). All subtypes except luminal A had elevated frequencies of proliferating cells compared with juxta-tumoral tissue (Figure S3J). Proliferation was strongest in grade 3 tumors (Figure S3K).
Phenotypic Abnormalities and Tumor Individuality Are Linked to Features of Poor Prognosis
Tumor cell heterogeneity is believed to drive disease progression and to hamper therapies to eliminate all cells of the tumor ecosystem (Ramos and Bentires-Alj, 2015). We established three computational scores to quantify different aspects of tumor heterogeneity (Figure 4A). Phenotypic abnormality describes the extent of tumor cell phenotypic deviation from non-tumor epithelial cells. Tumor individuality quantifies the similarity of tumors based on cell phenotypes. Tumor richness represents the number of different co-existing tumor cell phenotypes within an ecosystem.
Figure 4.

Molecular Phenotypic Abnormalities and Tumor Individuality Are Linked to Features of Poor Prognosis
(A) Phenotypic abnormality, individuality, and richness shown schematically using hypothetical phenotypes (shape) and tumors (color).
(B) Phenotypic abnormality scores of all epithelial clusters.
(C) Phenotypic abnormality scores of tumors and the median score of juxta-tumoral samples.
(D and E) Stacked histograms of (D) frequencies of cells per epithelial cluster group per tumor ordered by increasing phenotypic abnormality and (E) the average frequencies for juxta-tumoral tissue.
(F–H) Tumor phenotypic abnormality scores by (F) grade, (G) ER status, and (H) subtype.
(I) Phenotypic abnormality scores versus the percentage of Ki-67+ and CA9+ cells for tumors.
(J) Individuality scores for juxta-tumoral (JT) and tumor (T) tissue.
(K) Individuality scores versus phenotypic abnormality scores for tumors.
(L) Individuality scores for ER+ and ER− tumors.
(M) Individuality scores versus the percentage of ERα+ cells for ER+ tumors.
(N) Heatmap of presence and proportion of the 45 epithelial clusters for all samples.
(O) Richness scores for mammoplasty (M), juxta-tumoral (JT), and tumor (T) samples.
(P) Individuality scores versus richness scores for tumors.
(Q) Cluster frequency map for ten tumors that had not regressed despite neoadjuvant chemotherapy.
Wilcoxon rank-sum test was used for statistical analysis. ∗p < 0.05, ∗∗p < 0.01, ∗∗∗p < 0.001. See also Figure S4.
To describe phenotypic abnormalities, we trained an artificial neural network (autoencoder) (Goodfellow et al., 2016, Hinton and Salakhutdinov, 2006) with multidimensional single-cell data from the juxta-tumoral samples (STAR Methods). When trained, the autoencoder recognized non-tumor epithelial cell phenotypes and calculated a mean squared error (MSE) for every tumor cell (Figure S4A). High MSE values indicated high levels of abnormality. The most abnormal tumor cells were detected in the epithelial cluster groups L6, L7, B1, and B2 (Figure 4B). These included ERα+PRB+HER2+AR+ (Ep42 and Ep43) and ERα−PRB+HER2−AR+HLA-DR+ luminal phenotypes (Ep37 and Ep38) and ERα−PRB−HER2−AR− basal-like EMT phenotypes (Ep01, Ep02, Ep23, Ep24, and Ep25). Tumors containing mainly cells from these clusters deviated more from juxta-tumoral tissue than tumors enriched for cells from groups L1 and L2 (Figures 4C–4E). Phenotypically abnormal cells were enriched in high-grade tumors, most ER− tumors, a subset of ER+ tumors, and tumors of subtypes with poor prognosis (Figures 4F–4H). Phenotypic abnormality correlated with hypoxia and proliferation marker expression (Figure 4I), reflecting abnormal growth conditions within the tumor ecosystem (Marusyk et al., 2012). About 25% of CA9+ tumor cells exhibited an EMT phenotype compared with 4% of CA9− tumor cells. Some juxta-tumoral tissue samples in our cohort contained phenotypically abnormal cells and high frequencies of CA9+ or Ki-67+ cells (Figures S4B and S4C; Table S5), possibly representing areas of the pre-cancerous lesion ductal carcinoma in situ.
Figure S4.

Phenotypic Abnormality and Individuality of Tumor and Non-tumor Tissue Samples, Related to Figure 4
(A) Computation of phenotypic abnormality scores using an autoencoder trained with juxta-tumoral tissue-derived “normal-like” cells. Tumor phenotypic abnormality represents the median Mean Squared Error of all cells of a tumor. (B) Barplot of the phenotypic abnormality scores of mammoplasty and juxta-tumoral tissues and stacked histogram of the frequencies of cells per epithelial cluster group per sample. (C) Phenotypic abnormality scores for mammoplasty (M), juxta-tumoral (JT), and tumor (T) samples. (D) Computation of tumor individuality scores using a k-nearest neighbor graph, where cells of all tumors are grouped based on their phenotype. (E) Tumor individuality scores by grade and subtype. (F) Tumor individuality scores by lymph node status and distant metastasis. (G) Diagram of epithelial clusters that are dominant (D, > 50% of all cells of a sample) or tumor specific (T). (H) Cluster frequency map showing tumors for which two areas of the same tumor were sampled. Wilcoxon rank-sum test was used for statistical analysis. ∗ p < 0.05, ∗∗ p < 0.01, ∗∗∗ p < 0.001.
To assess the individuality of tumor ecosystems, we applied a graph-based approach to the epithelial cell data from all samples (Figure 4A; STAR Methods). The individuality score indicated whether cells of a sample were more similar to cells of the same sample (score close to 1) or to cells of other samples (score close to 0) (Figure S4D). Tumors displayed higher individuality scores than juxta-tumoral tissues (Figure 4J). Importantly, tumor individuality correlated with phenotypic abnormality (Figure 4K), suggesting that the more tumor cells deviate phenotypically from non-tumor cells, the less likely they are to be found in tumors from different patients (Figure S4D). Tumor individuality was more prominent in high-grade tumors and in tumors of the luminal B, luminal B-HER2+, or TN subtype (Figure S4E). Individuality varied extensively among ER+ tumors and correlated with the percentage of ERα+ cells (Figures 4L and 4M). No association between individuality and invaded lymph nodes or distant metastasis was detected (Figure S4F).
To explore the concept of tumor richness (Figure 4A), we calculated the frequency of each epithelial cell cluster per sample and reported the number of clusters above 1%. All tumors and non-tumor samples contained cells from multiple clusters (Figure 4N). Remarkably, most tumors did not display increased richness compared with non-tumor tissue, and tumor richness anti-correlated with individuality (Figures 4O and 4P). In 43% of tumor samples (62 of 144), at least 50% of all cells of the tumor belonged to a single cluster, possibly reflecting the expansion of a distinct cancer cell clone (Figure 4N). This cluster dominance was observed in 58% of grade 3 tumors, 33% of grade 2 tumors, and 35% of grade 1 tumors. Cluster dominance was observed in 51% of luminal B, 50% of luminal B-HER2+, and 67% of TN tumors but only 29% of luminal A tumors. Among the 45 epithelial cell clusters, 37 clusters (82%) comprised at least 50% of all cells in one or more tumors (Figure 4N). Seven dominant clusters were tumor-specific, and four displayed high phenotypic abnormality (Figures 4B and S4G).
Analysis of ten tumors in our cohort that had not considerably regressed despite neoadjuvant chemotherapy revealed individual phenotype compositions, indicating that different tumor cell phenotypes had survived therapy (Figure 4Q). These included highly abnormal tumor cells with the ERα−HER2− phenotype (Ep02, Ep37, and Ep24) and with the ERα+HER2+ phenotype (Ep40 and Ep41) (Figures 4B and 4Q). Two different regions of the same tumor had been collected from four other patients. In three cases, similar phenotype compositions were observed in both regions. In the fourth tumor, the dominant clone was present in both regions but at different frequencies, and one region had a more proliferative character (5% Ki-67+) than the other (0.6% Ki-67+) (Figure S4H).
Tumor Ecosystem-Based Classification Reveals Distinct Groups and Multiple Tumor Singletons
To exemplify a classification that considers all aspects of the tumor ecosystem, we grouped all tumor and non-tumor samples in our cohort by shared ecosystem patterns. We applied hierarchical clustering to the frequencies per sample of all epithelial, T cell, and myeloid clusters identified in this study (Table S5; STAR Methods). The resulting heatmap revealed three groups containing many tumors (Tu1–Tu3), four groups containing three or four tumors (Tu4–Tu7), 36 tumor singletons, and three groups of non-tumor samples (N1–N3) (Figure 5A). Principal-component analysis identified the clusters explaining the highest variability between the different groups. Group Tu1 included 42 tumors with high levels of specific epithelial clusters (Ep14, Ep18, and Ep45), T cell clusters (T10, T14, and T17), and macrophage clusters (M05, M10, and M12) (Figures 5A, orange rectangle, and 5B). All of these clusters were observed frequently in non-tumor samples, except the PD-1intCTLA-4−CD38− T cell phenotype T14 and the CD38+ MDSC phenotype M12. The nine tumors of group Tu2 displayed high frequencies of ERαdim cells (Ep19; Figure 5A, red rectangle #1), T-regs (T01), and PD-L1+ TAMs (M01 and M02) and intermediate frequencies of exhausted PD-1highCTLA-4+CD38+ T cells (T09, T11, and T13; Figures 5A, red rectangle #2, and 5B). Group Tu2 tumors had higher individuality and phenotypic abnormality scores, more proliferating cells, PD-L1+ TAMs, and PD-1+ T cells than tumors of groups Tu1 and Tu3 (Figures 5C–5G). Group Tu3 included 44 tumors with high levels of the ERα+ luminal phenotypes Ep09 and Ep14 and the ERα− luminal phenotypes Ep17 and Ep18 (Figure 5A, green rectangles #1). Group Tu3 tumors were enriched for immune cell phenotypes T02, T06, T07, and M03 (Figures 5A, green rectangle #2, and 5B), which were also common in non-tumor tissue. Strikingly, groups Tu1–Tu7 were heterogeneous for clinical subtypes and grades (Figures S5A and S5B).
Figure 5.

Relationships in the Tumor Ecosystem Correlate with Features of Disease Progression
(A) Heatmap of frequencies of epithelial, T cell, and myeloid PhenoGraph clusters in mammoplasty, juxta-tumoral, and tumor tissues. For tumors, the subtype and grade are indicated by color. Cosine distance and average linkage were used.
(B) Biplots of first two principal components (PCs) of cluster frequencies. Dots represent samples colored by group (top). The arrow length and direction indicate the importance of the cluster to the PC (bottom).
(C–G) Boxplots of (C) individuality and (D) phenotypic abnormality scores and frequencies of (E) Ki-67+ cells, (F) PD-L1+ macrophages, and (G) PD-1+ T cells by group.
Wilcoxon rank-sum test was used for statistical analysis. ∗p < 0.05, ∗∗p < 0.01, ∗∗∗p < 0.001. See also Figure S5.
Figure S5.

The Importance of Tumor and Immune Cell Phenotypes for Tumor Grouping, Related to Figure 5
(A and B) Biaxial plot of the first two principal components of the analysis shown in Figure 5B. A) Dots represent tumor samples colored by group. B) Dots represent tumor samples colored by subtype (top) and grade (bottom). (C-E) The importance of epithelial, T cell, and myeloid clusters for predicting whether tumors belong to group C) Tu1, D) Tu2, or E) Tu3 using random forest classification.
All mammoplasty samples and 54% of juxta-tumoral samples were found in group N2, indicating closely related ecosystems (Figure 5A). Similar to non-tumor tissue, the five tumors found in group N2 contained mainly group L1 and L2 epithelial phenotypes, circulating T cells (T16), and tissue-resident macrophages (M08) (Figure 5A). All five tumors were of the luminal A subtype and low-grade, suggesting that the tumors were phenotypically similar to non-tumor tissue or that the tumor content was particularly low in these samples.
Many of the tumor singletons had high frequencies of PD-1+ T cell and PD-L1+ TAM phenotypes associated with immunosuppression (Figures 5A, red arrows, 5B, 5F, and 5G). Tumor singletons generally did not share tumor cell phenotypes, reflecting high tumor individuality, and had higher phenotypic abnormality scores and more proliferating cells than tumors of groups Tu1 and Tu3 (Figures 5C–5E). Luminal B-HER2+, HER2+, and TN tumors were either part of a small tumor group or singletons (Figure 5A).
To identify clusters and cluster combinations with the power to distinguish a given group from all other samples, we employed a random forest classifier (STAR Methods). The respective groups were distinguished with an accuracy of 94% (Tu1), 83% (Tu2), and 89% (Tu3); multiple epithelial, T cell, and macrophage clusters drove the separation (Figures S5C–S5E). Thus, patterns in both the tumor epithelium and its immunoenvironment contained tumor-stratifying information.
Breast Tumors and Their Immunoenvironment Are Interwoven Entities, and Both Are Important for Classification
Networks of tumor cell and tumor-host cell interactions drive disease progression and are promising targets for drug intervention (Marusyk et al., 2012, McAllister and Weinberg, 2010). To systematically elucidate homotypic and heterotypic tumor and immune cell relationships, we performed pairwise Spearman correlation analyses of the frequencies of all cell phenotype clusters in all samples (Figures 6A–6C; Table S5; STAR Methods). Homotypic epithelial cell relationships were found between phenotypes from different cluster groups (Figure 6A, black rectangles). Non-tumor luminal phenotypes such as Ep30 and Ep31 (group L1) were correlated, whereas tumor-specific phenotypes, such as Ep09 and Ep10 (group L4) or Ep19 and Ep15 (group L2), were often separately enriched, reflecting phenotype dominance and tumor individuality (Figure 6A). Immunosuppressive phenotypes T-regs (T01), PD-1highCTLA-4+CD38+ exhausted T cells (T09, T11, and T13), and PD-L1+ TAMs (M01, M02, and M17) correlated with tumor cell phenotypes from L4, L5, L6, and B1 (Figure 6B, rectangles without arrow). The frequencies of non-tumor phenotypes in groups L1 and L2 and cluster Ep39 were inversely linked to these immunosuppressive phenotypes (Figure 6B, rectangles marked with arrow) but correlated with PD-1intCTLA-4−CD38− phenotypes T07 and T18 (Figure 6B, rectangles marked with asterisk). Relationship analysis among tumor-associated immune cells revealed that T-regs and PD-L1+ TAM phenotypes correlated with PD-1highCTLA-4+CD38+ exhausted T cell phenotypes, suggesting immunosuppressive interactions (Figure 6C, square and biaxial plots). T-regs and PD-L1+ TAMs did not or only inversely correlated with PD-1intCTLA-4−CD38− T cell phenotypes (Figures 6C, rectangles marked with arrow, and S6A). Furthermore, immunosuppressive patterns correlated with tumor phenotypic abnormality and individuality scores, hypoxia, and proliferation (Figure 6D). We also observed a correlation between immunosuppressive TAMs and T cells and the abundance of ERα+ cells (Figure 6D), indicating that estrogen signaling is a shaping force in the tumor ecosystem (Straub, 2007). The epithelial-immune relationships in tumors differed from those of matched juxta-tumoral tissues (Figures S6B and S6C; STAR Methods); higher numbers of homotypic epithelial and T cell and heterotypic T cell-TAM relationships were detected in tumors (Figures S6B–S6D).
Figure 6.

Breast Tumors and Their Immunoenvironment Are Interwoven Entities
(A–C) Spearman correlation analyses using the frequencies of (A) epithelial clusters, (B) T cell, myeloid, and epithelial clusters, and (C) T cell and myeloid clusters in all samples. Euclidean distance and average linkage were used (top). Also shown are frequencies of selected clusters in juxta-tumoral and tumor samples (bottom).
(D) Spearman correlation analysis of T cell and myeloid cluster frequencies with phenotypic abnormality and individuality scores and frequencies of ERα+, CA9+, and Ki-67+ cells in tumors.
(E) Heatmap of frequencies of T cell and myeloid clusters in all samples by hierarchical clustering using cosine distance and average linkage. For tumors, the subtype, grade, and three main groups, Tu1–Tu3, from Figure 5A are indicated by color.
(F) Pseudo-bright-field images of immunofluorescence staining of the indicated tumor samples. Arrowheads indicate PD-1+CTLA-4+ T cells (left) or PD-L1+ TAMs (right). Scale bar, 25 μm.
(G and H) Boxplots of (G) phenotypic abnormality and (H) individuality scores for tumors in tumor immune groups TIG1–TGI3.
(I) Cluster frequency map for tumors in TIG2.
Tumors and epithelial clusters were sorted by increasing phenotypic abnormality score. A cutoff of p ≤ 0.01 was used in (A)–(D). Wilcoxon rank-sum test was used for (G) and (H). ∗p < 0.05, ∗∗p < 0.01, ∗∗∗p < 0.001. See also Figure S6.
Figure S6.

In-Depth Analysis of Relationships in the Tumor Ecosystem, Related to Figure 6
(A) Frequencies of selected T cell clusters for juxta-tumoral and tumor samples. (B) Chord diagrams of the relationships between T cell, myeloid, and epithelial clusters in tumors and matched juxta-tumoral tissue for 41 patients (p ≤ 0.001). (C) Frequencies of selected clusters that differed in correlation between tumor and juxta-tumoral tissue. (D) Absolute number of correlations between clusters for juxta-tumoral (JT) and tumor (T) tissue and table of the fold change between JT and T tissue. (E) Frequency of T cell and TAM phenotypes associated with immunosuppression for TIG1-3. (F) Pseudo-brightfield images of EpCAM and pan cytokeratin on tumor tissue. Rectangles highlight the areas shown at higher magnification in Figure 6E. Scale bar, 50 μm. Spearman correlation and Wilcoxon rank-sum test were used for statistical analysis. ∗ p < 0.05, ∗∗ p < 0.01, ∗∗∗ p < 0.001.
In our ecosystem-based classification, 24% of tumors were singletons. Because the relationship analyses indicated considerable structure within the tumor immunoenvironment, we hypothesized that singleton tumors might be grouped based on immunoenvironmental similarities to guide patient selection for immune-targeted therapies. Repeating the hierarchical clustering using only the immune cluster frequencies resulted in three tumor immune groups (TIG1–TIG3) heterogeneous for tumor subtypes. Juxta-tumoral and mammoplasty tissues grouped together (Figure 6E). Of the previous singleton tumors, 6% were placed into TIG1, 32% in TIG2, and 50% into TIG3. Tumors in TIG1 were enriched for clusters M05, M10, M12, T10, T14, and T17 (Figure 6E, black rectangle). TIG3 tumors displayed high frequencies of PD-L1+ TAMs (M01 and M02) and PD-1intCTLA-4−CD38− T cells (T07) (Figure 6E, blue rectangles #1) but low levels of PD-1highCTLA-4+CD38+ exhausted T cells (T09, T11, and T13) (Figures 6E, blue rectangles #2, and S6E). In contrast, tumors in TIG2 exhibited high frequencies of T-regs (T01), PD-L1+ TAMs, and PD-1highCTLA-4+CD38+ exhausted T cells (Figure 6E, red rectangles). Therefore, the tumor immune groups presented distinct relationships among T-regs, PD-1+ T cells, and PD-L1+ TAM phenotypes (Figure S6E). Juxta-tumoral samples found in TIG1 and TIG3 displayed high frequencies of PD-1intCTLA-4−CD38− T cells or PD-L1+ TAMs, unlike other non-tumor samples (Figure 6E). In four of the five patients with juxta-tumoral tissue in TIG1 or TIG3, lymph nodes near the tumor had been invaded, suggesting that these phenotypes resulted from a tumor-associated immune response.
Tumors of different subtypes, including ER+ and ER− tumors, grouped in TIG2, raising the question whether immune cells abundant in TIG2 were localized proximally in the tumor ecosystem. We assessed the spatial distribution of PD-L1+ TAMs and PD-1+ and PD1+CTLA-4+ T cells in tissue sections of TIG2 tumors by immunofluorescence imaging (STAR Methods) and found these cells both in the tumor stroma and within tumor epithelium in ER+ and ER− disease (Figures 6F and S6F). The TIG2 tumors had higher phenotypic abnormality scores than TIG1 and TIG3 tumors (Figure 6G), suggesting that tumor phenotypic deviation from non-tumor tissue is associated with changes in the tumor immune landscape. TIG2 tumors also had higher individuality scores than TIG1 and TIG3 tumors and revealed unique tumor cell phenotype compositions (Figures 6H and 6I). All TIG2 tumors contained ERα− cells, ranging from 98% to 15% of the tumor cell population. Among ERα− cells, we found EMT phenotypes (Ep01, Ep02, Ep16, Ep23–25, and Ep32) in 61% of TIG2 tumors and HLA-DR+ phenotypes (Ep01, Ep37, and Ep38) in 39% of TIG2 tumors (Figure 6I). ERα+ phenotypes were mainly from groups L4 (Ep07–Ep11) and L5 (Ep26–Ep29) and co-expressed PRB, HER2, and AR with high levels of pro-survival BCL-2 and Survivin. Thus, in addition to an immunosuppressive environment, TIG2 tumor ecosystems contained multiple tumor cell populations with the potential to escape common cancer therapies.
Discussion
Communication between heterogeneous tumor cells, infiltrating T cells, and macrophages shapes the breast cancer ecosystem, with an effect on disease progression and clinical outcome (Marusyk et al., 2012, Quail and Joyce, 2013). We constructed an extensive single-cell atlas of human breast cancer ecosystems by large-scale mass cytometry profiling of 26 million cells from 144 tumor samples, 46 juxta-tumoral samples, and tissue from four reduction mammoplasties. This atlas reveals the vast phenotypic diversity of mammary epithelial and immune cells, phenotypic abnormalities of tumor cells, and tumor individuality and highlights homotypic and heterotypic tumor-immune cell relationships, enabling ecosystem-based patient classification.
Most cases in our study were luminal ER+ breast cancers. Despite a generally favorable prognosis, about 30% of patients with ER+ disease develop therapy resistance and metastases (Reinert and Barrios, 2015). We found that tumor-derived epithelial cells were phenotypically much more diverse than cells from non-tumor tissue. Tumors of all clinical subtypes displayed striking individuality in cellular phenotypic composition. These findings might underlie the differential treatment responses and relapse rates among ER+ breast cancer patients. Although multiple tumor cell phenotypes co-existed in all tumor ecosystems, frequently one phenotype was dominant, possibly reflecting the expansion of the fittest tumor subclone, as suggested by genomics (Nik-Zainal et al., 2012). Phenotype dominance can be particularly important for disease progression when associated with resistance, such as the dominant ERα−HER2−Survivinhigh phenotypes we found in tumors resistant to neoadjuvant chemotherapy. Phenotypic abnormality scores were higher for tumor cells of luminal B, luminal B-HER2+, TN, and grade 3 tumors than of luminal A and lower grades. Given that HER2+ and TN tumors were underrepresented in our cohort, we expect that expanded analyses of these subtypes will also reveal tumor cell heterogeneity and tumor individuality, as apparent in ER+ tumors.
Single-cell RNA sequencing of a few tumors suggested that tumor-associated T cells and myeloid cells are phenotypically diverse (Azizi et al., 2018, Chung et al., 2017), which is supported by our analysis of a large cohort. We found that PD-1+ T cells and PD-L1+ TAMs were common in all breast cancer subtypes (Buisseret et al., 2016). Receptors relevant to T cell exhaustion (PD-1, CTLA-4, and TIM-3) and activation (HLA-DR and CD38) as well as CD38, pro-tumor (CD204, CD206, and CD163), and anti-tumor TAM markers (CD169) were heterogeneously expressed, reminiscent of findings in breast cancer and ccRCC (Azizi et al., 2018, Chevrier et al., 2017). Recent work indicated that PD-1+ T cells follow a gradient of dysfunction ranging from low to high exhaustion (Li et al., 2019, Sade-Feldman et al., 2018, Wherry and Kurachi, 2015). Our data confirmed a continuum of T cell exhaustion states linked to increasing PD-1 levels. We found different combinations of immune checkpoint molecules associated with high PD-1 expression in both CD4+ and CD8+ T cell populations and identified CD38 as a marker of T cell exhaustion in breast cancer. Immunosuppressive T cell and TAM phenotypes correlated with tumor-specific luminal ERα+ and ERα− phenotypes that expressed specific receptor tyrosine kinases and pro-survival proteins. Because interactions between tumor cells, T cells, and TAMs are promising targets for therapy (Quail and Joyce, 2013), follow-up experiments should elucidate the functional roles of distinct tumor and immune cell populations in breast cancer ecosystems.
Our data revealed that the frequency of ERα+ cells in ER+ tumors was linked to tumor individuality. In luminal B tumors, the frequency of ERα+ cells correlated with PD-L1+ TAMs and exhausted T cell phenotypes, supporting the notion that hormone receptor signaling shapes the tumor ecosystem (Straub, 2007). The success of immune checkpoint therapy in ER+ breast cancer patients has been limited (Shih et al., 2014). Here we showed that 18% of luminal B tumor samples exhibited patterns of strong T cell exhaustion akin to ER− tumors, suggesting that some ER+ patients could benefit from neoadjuvant or early adjuvant anti-PD-1 and anti-PD-L1 therapy targeting the primary tumor (Wein et al., 2018). Our study identified patterns within the tumor and immune ecosystem that are tumor-stratifying independent of subtype and grade. Therefore, assessing the entire cancer ecosystem should be considered for the design of precision therapies targeting the tumor and its immunoenvironment and for patient selection for immunotherapy clinical trials. Further studies are needed to confirm this suggestion.
Our mass cytometry approach has limitations. First, antibody choices might bias phenotyping. Antibodies in our tumor panel were selected based on studies delineating mammary epithelial cell states, gene expression, and protein signatures enriched in breast cancer subtypes (Neve et al., 2006, Parker et al., 2009, Perou et al., 2000, Santagata et al., 2014). The immune antibody selections were based on our recent ccRCC immune atlas (Chevrier et al., 2017). All antibodies were thoroughly validated. Second, tissue dissociation into single-cell suspensions potentially alters cell surface molecules. The recapitulation of known cell phenotypes using our panels indicates small effects (Chevrier et al., 2017). Third, data-driven clustering is sensitive to the choice of clustering parameters. PhenoGraph is a reproducible single-cell clustering method (Weber and Robinson, 2016) and yielded epithelial and immune clusters that recapitulated known mammary epithelial, T cell, and TAM phenotypes. The spatial context and functional roles of these phenotypes must be addressed in additional experiments (Angelo et al., 2014, Giesen et al., 2014). Fourth, although our tumor samples were of about 0.125 cm3 volume, which is much larger than volumes typically analyzed in pathology studies, tumor regions might differ. Fifth, our ecosystem-based patient grouping is a function of the measured markers and the patient cohort. Because our samples were collected prospectively, relationship analysis to clinical outcome or treatment response was not possible.
New treatment approaches are needed to increase the success of breast cancer precision medicine. A first step is to comprehensively describe the complex cellular and phenotypic diversity of tumor ecosystems and the relationships among its components for a large number of patients. Here we provide such an atlas of breast cancer ecosystems. This atlas will be a valuable resource for future research to identify clinically relevant cell phenotypes and relationships in the tumor ecosystem for patient stratification and precision medicine applications.
STAR★Methods
Key Resources Table
| REAGENT or RESOURCE | SOURCE | IDENTIFIER |
|---|---|---|
| Antibodies | ||
| Antibodies used for mass cytometry | ||
| AKT (C67E7) - purified | Cell Signaling Technologies | Cat# 4691; RRID:AB_915783 |
| Anti-rabbit IgG (polyclonal) - purified | Vector Labs | Cat# AI-1000; RRID:AB_2336193 |
| AR (D6F11) - purified | Cell Signaling Technologies | Cat# 5153; RRID:AB_10692774 |
| BCL-2 (100) - purified | Biolegend | Cat# 658702; RRID:AB_2562959 |
| c-MET (D1C2) - purified | Cell Signaling Technologies | Cat# 8198; RRID:AB_10860590 |
| c-MYC (D84C12) - purified | Cell Signaling Technologies | Cat# 5605; RRID:AB_1903938 |
| CA9 (polyclonal) - purified | R&D Systems | Cat# AF2188; RRID:AB_416562 |
| CD11b (M1/70) - purified | Biolegend | Cat# 101202; RRID:AB_312785 |
| CD11c (Bu15) - purified | Biolegend | Cat# 337221; RRID:AB_2562834 |
| CD123 (6H6) - purified | Biolegend | Cat# 306002; RRID:AB_314576 |
| CD14 (RMO52) - purified | Beckman Coulter | Cat# A22331; RRID:AB_10639528 |
| CD15 (HI98) - purified | Biolegend | Cat# 301902; RRID:AB_314194 |
| CD16 (3G8) - purified | Biolegend | Cat# 302002; RRID:AB_314202 |
| CD163 (GHI/61) - purified | Biolegend | Cat# 333602; RRID:AB_1088991 |
| CD169 (7-239) - purified | Biolegend | Cat# 346002; RRID:AB_2189031 |
| CD192/CCR2 (K036C2) - purified | Biolegend | Cat# 357202; RRID:AB_2561851 |
| CD197/CCR7 (G043H7) - purified | Biolegend | Cat# 353202; RRID:AB_10945157 |
| CD20 (H1(FB1)) - purified | BD Biosciences | Cat# 555677; RRID:AB_396030 |
| CD204 (351615) - purified | R&D Systems | Cat# MAB2708; RRID:AB_2235696 |
| CD206 (15-2) - purified | Biolegend | Cat# 321112; RRID:AB_571921 |
| CD24 (ML5) - purified | BD Biosciences | Cat# 555426; RRID:AB_395820 |
| CD25 (M-A251) - purified | Biolegend | Cat# 356102; RRID:AB_2561752 |
| CD274/PD-L1 (E1L3N) - purified | Cell Signaling Technologies | Cat# 13684; RRID:AB_2687655 |
| CD278/ICOS (C398.4A) - purified | Biolegend | Cat# 313502; RRID:AB_416326 |
| CD279/PD-1 (EH12.2H7) - purified | Biolegend | Cat# 329902; RRID:AB_940488 |
| CD3 (UCHT1) - purified | Biolegend | Cat# 300402; RRID:AB_314056 |
| CD31 (HC1/6) - purified | EMD Millipore | Cat# CBL468-K; RRID:AB_1586934 |
| CD32 (FUN-2) - purified | Biolegend | Cat# 303202; RRID:AB_314334 |
| CD36 (5-271) - purified | Biolegend | Cat# 336215; RRID:AB_2563745 |
| CD38 (HIT2) - purified | Biolegend | Cat# 303502; RRID:AB_314354 |
| CD4 (RPA-T4) - purified | Biolegend | Cat# 300516; RRID:AB_314084 |
| CD44 (IM7) - purified | BD Biosciences | Cat# 550538; RRID:AB_393732 |
| CD45 (HI30) - purified | Biolegend | Cat# 304002; RRID:AB_314390 |
| CD45RA (HI100) - purified | Biolegend | Cat# 304102; RRID:AB_314406 |
| CD49f (GoH3) - purified | Biolegend | Cat# 313614; RRID:AB_893371 |
| CD64 (10.1) - purified | Biolegend | Cat# 305002; RRID:AB_314486 |
| CD68 (KP1) - purified | Biolegend | Cat# 916104; RRID:AB_2616797 |
| CD68 (Y1/82A) - purified | Biolegend | Cat# 333802; RRID:AB_1089058 |
| CD7 (M-T701) - purified | BD Biosciences | Cat# 555359; RRID:AB_395762 |
| CD86 (233(FUN-1)) - purified | BD Biosciences | Cat# 555655; RRID:AB_396010 |
| CD8a (RPA-T8) - purified | Biolegend | Cat# 301002; RRID:AB_314120 |
| CD93 (R139) - purified | eBioscience | Cat# 14-0939-82; RRID:AB_891508 |
| Cleaved CASPASE-3 (C92-605) - purified | BD Biosciences | Cat# 559565; RRID:AB_397274 |
| Cleaved PARP-1 (F21-852) - purified | BD Biosciences | Cat# 552596; RRID:AB_394437 |
| CTLA-4 (L3D10) - purified | Biolegend | Cat# 349902; RRID:AB_10642827 |
| Cyclin B1 (GNS-11) - purified | BD Biosciences | Cat# 554179; RRID:AB_395290 |
| E-CADHERIN (24E10) - purified | Cell Signaling Technologies | Cat# 3195; RRID:AB_10694492 |
| E-CADHERIN (67A4) - purified | Biolegend | Cat# 324102; RRID:AB_756064 |
| EGFR (EP38Y) - purified | Abcam | Cat# ab52894; RRID:AB_869579 |
| EpCAM (9C4) - purified | Biolegend | Cat# 324202; RRID:AB_756076 |
| ERα (EP1) - purified | Epitomics | Cat# AC-0015; RRID:AB_10704040 |
| EZH2 (D2C9) - purified | Cell Signaling Technologies | Cat# 5246; RRID:AB_10694683 |
| FAP (polyclonal) - purified | R&D Systems | Cat# AF3715; RRID:AB_2102369 |
| FOXP3 (236A/E7) - purified | ThermoFisher | Cat# 14-4777-82; RRID:AB_467556 |
| H3K27me3 (C36B11) - purified | Cell Signaling Technologies | Cat# 9733; RRID:AB_2616029 |
| HER2 (3B5) - purified | BD Biosciences | Cat# 554299; RRID:AB_395352 |
| HLA-DR (L243) - purified | Biolegend | Cat# 307602; RRID:AB_314680 |
| K14 (polyclonal) - purified | ThermoFisher | Cat# PA5-16722; RRID:AB_10980222 |
| K5 (EP1601Y) - purified | Abcam | Cat# ab52635; RRID:AB_869890 |
| K7 (RCK105) - purified | BD Biosciences | Cat# 550507; RRID:AB_2134456 |
| K8/18 (C51) - purified | Cell Signaling Technologies | Cat# 4546; RRID:AB_2134843 |
| Ki-67 (8D5) - purified | Cell Signaling Technologies | Cat# 9449; RRID:AB_2715512 |
| P53 (EPR17343) - purified | Abcam | Cat# ab179477; RRID:AB_2737134 |
| Pan Keratin (AE1) - purified | EMD Millipore | Cat# MAB1612; RRID:AB_2132794 |
| Pan Keratin (AE3) - purified | EMD Millipore | Cat# MAB1611; RRID:AB_2134409 |
| PRB (YR85) - purified | Abcam | Cat# ab32085; RRID:AB_777452 |
| PTEN (138G6) - purified | Cell Signaling Technologies | Cat# 9559; RRID:AB_390810 |
| SLAMF7 (162.1) - purified | Biolegend | Cat# 331802; RRID:AB_961330 |
| SMA (1A4) - purified | Abcam | Cat# ab8207; RRID:AB_306356 |
| SURVIVIN (71G4B7) - purified | Cell Signaling Technologies | Cat# 2808; RRID:AB_10691694 |
| TIM-3 (F38-2E2) - purified | Biolegend | Cat# 345035; RRID:AB_2566086 |
| VIMENTIN (EPR3776) - purified | Abcam | Cat# ab92547; RRID:AB_10562134 |
| Antibodies used for immunofluorescence | ||
| CD3e (LN10) | Leica | Cat# NCL-L-CD3-565; RRID:AB_563541 |
| CD68 (KP1) | eBioscience/ThermoFisher | Cat# 14-0688-82; RRID:AB_11151139 |
| CTLA-4 (BSB-88) | BIOSB | Cat# BSB2884; RRID:AB_2762365 |
| PD-1 (D4W2J) | Cell Signaling Technologies | Cat# 86163S; RRID:AB_2728833 |
| PD-L1 (E1L3N) | Cell Signaling Technologies | Cat# 13684S; RRID:AB_2687655 |
| Pan Keratin (h-240) | Santa Cruz | Cat# sc-15367; RRID:AB_2134438 |
| EpCAM (EPR20532-225) | Abcam | Cat# ab223582; RRID:AB_2762366 |
| Anti-mouse IgG (min X reactivity), HRP-conjugated (polyclonal) | JacksonImmunoReseach | Cat# 715-035-151; RRID:AB_2340771 |
| Anti-rabbit IgG (min X reactivity), HRP-conjugated (polyclonal) | JacksonImmunoReseach | Cat# 711-035-152; RRID:AB_10015282 |
| Anti-goat IgG (min X reactivity), HRP-conjugated (polyclonal) | JacksonImmunoReseach | Cat# 705-035-147; RRID:AB_2313587 |
| Biological Samples | ||
| Breast cancer and adjacent non-tumor tissue samples | University Hospital Basel, University Hospital Zurich, Patient’s Tumor Bank of Hope (PATH), St. Johannes Hospital Dortmund and Institute of Pathology at Josefshaus, University Hospital Giessen and Marburg, Marburg site | |
| Reduction mammoplasty samples | University Hospital Zurich | |
| Peripheral blood mononuclear cells (PBMCs) | Zurich Blood Transfusion Service | N/A |
| Chemicals, Peptides, and Recombinant Proteins | ||
| 4′,6 diamidine-2-phenylindole (DAPI) | ThermoFischer | Cat# D1306 |
| Antibody Stabilizer PBS | Candor Bioscience | Cat# 131 050 |
| Bis(2,2′-bipyridine)-4′-methyl-4-carboxybipyridine-ruthenium-N-succidimyl ester-bis(hexafluorophosphate) (96Ru, 98-102Ru, 104Ru) | Sigma Aldrich | Cat# 96631 |
| Bismuth trichloride (209Bi) | Sigma Aldrich | Cat# 450723 |
| Bromoacetamidobenzyl-EDTA (BABE) | Dojindo Laboratories | Cat# B437-10 |
| Cisplatin | Fluidigm | Cat# 201064 |
| DMSO | Sigma Aldrich | Cat# D2438 |
| EDTA | StemCell Technologies, Inc. | Cat# EDS-100G |
| EQ™ Four Element Calibration Beads | Fluidigm | Cat# 201078 |
| FcR Blocking Reagent, human | Miltenyi Biotech | Cat# 130-059-901 |
| Indium (113In, 115In) | Fluidigm | N/A |
| Iridium (191Ir, 193Ir) | Fluidigm | Cat# 201192A |
| Lanthanide (III) metal isotopes as chloride salts | Fluidigm | N/A |
| MACS Tissue Storage Solution | Miltenyi Biotech | Cat# 130-100-008 |
| Magne Protein A Beads | Promega | Cat# G8781 |
| Magne Protein G Beads | Promega | Cat# G7471 |
| Maleimido-mono-amide-DOTA (mDOTA) | Macrocyclics | Cat# B-272 |
| Palladium (105Pd, 106Pd, 108Pd, 110Pd) | Fluidigm | N/A |
| Paraformaldehyde | Electron Microscopy Sciences | Cat# 15710 |
| ProLong® Diamond Antifade Mountant | Thermo Fisher | Cat# P36961 |
| Rhodium trichloride (103Rh) | Sigma Aldrich | Cat# 450286 |
| Saponin | Sigma Aldrich | Cat# S7900 |
| Trilogy 20x Concentrate | CellMarque | Cat# 920P-06 |
| Yttrium (89Y) | Sigma Aldrich | N/A |
| Critical Commercial Assays | ||
| Opal 7-Color IHC Kit | PerkinElmer | Cat# NEL821001KT |
| Tumor Dissociation Kit, human | Miltenyi Biotech | Cat# 130-095-929 |
| Maxpar X8 Multimetal Labeling Kit | Fluidigm | Cat# 201300 |
| Deposited Data | ||
| Mass cytometry data | This paper | Mendeley Data https://doi.org/10.17632/gb83sywsjc.1 |
| Immunofluorescence images | This paper | Mendeley Data https://doi.org/10.17632/gb83sywsjc.1 |
| Experimental Models: Cell Lines | ||
| MCF-10A | American Type Culture Collection (ATCC) | Cat# CRL-10317 |
| MDA-MB-134-VI | American Type Culture Collection (ATCC) | Cat# HTB-23 |
| MDA-MB-231 | American Type Culture Collection (ATCC) | Cat# HTB-26 |
| MDA-MB-453 | American Type Culture Collection (ATCC) | Cat# HTB-131 |
| SK-BR-3 | American Type Culture Collection (ATCC) | Cat# HTB-30 |
| ZR-75-1 | American Type Culture Collection (ATCC) | Cat# CRL-1500 |
| Fibroblasts | Gift from the laboratory of Prof. Silvio Hemmi at the University of Zurich | |
| Software and Algorithms | ||
| CATALYST | Chevrier et al., 2018 | http://bioconductor.org/packages/release/bioc/html/CATALYST.html |
| circlize (R package) version 0.4.4 | Gu et al., 2014 | https://github.com/jokergoo/circlize |
| Concatenation tool | Cytobank, Inc | https://support.cytobank.org/hc/en-us/articles/206336147-FCS-file-concatenation-tool |
| Cytobank | Kotecha et al., 2010 | https://www.cytobank.org/ |
| Fiji | Schindelin et al., 2012 | https://imagej.net/Welcome |
| InForm Cell Analysis | PerkinElmer | http://www.perkinelmer.com |
| MATLAB R2018a Neural Network Toolbox | MathWorks, Inc., 2018 | https://www.mathworks.com/ |
| Normalizer | Finck et al., 2013 | https://github.com/nolanlab/bead-normalization/releases |
| PhenoGraph | Levine et al., 2015 | https://github.com/jacoblevine/PhenoGraph |
| Python | Python Software | https://www.python.org/ |
| R 3.4.1 | R Core Team, 2016 | https://www.R-project.org |
| t-SNE | Van Der Maaten and Hinton, 2008 | https://github.com/jkrijthe/Rtsne |
Contact for Reagent and Resource Sharing
Further information and requests for resources and reagents should be directed to and will be fulfilled by the lead contact Bernd Bodenmiller (bernd.bodenmiller@imls.uzh.ch).
Experimental Model and Subject Details
Clinical samples
Primary mammary gland tissue and health-related data were collected after obtaining written informed consent from patients at the University Hospital Basel (Switzerland), the University Hospital Zurich (Switzerland), and in collaboration with the Patient’s Tumor Bank of Hope (PATH, Germany) at the breast cancer centers at St. Johannes Hospital Dortmund and Institute of Pathology at Josefshaus (Germany) and the University Hospital Giessen and Marburg, Marburg site (Germany). Tissue and health-related data were collected under approval of the Ethics Committee Northwest/Central Switzerland (#2016-00067), the Ethics Committee Zurich (#2016-00215), and the faculty of medicine ethics committee at Friedrich-Wilhelms-University Bonn (#255/06). Certified pathologists with extensive experience in preparation and analysis of breast cancer surgery resectates for diagnostics and research performed pathological staging for the tumor cohort in this study. Tumor histology, grading, and expression assessment of standard clinical biomarkers (ER, PR, HER2, Ki-67) were determined at the time of diagnostic pathological work-up according to the current ASCO/CAP recommendations (Rakha et al., 2014) and are reported in Table S2. Areas of tumor in the surgery resectates were identified macroscopically prior to sample-taking or microscopically in fast frozen section analyses. Part of the tumor was formalin cross-linked, embedded in paraffin, and stained with hematoxylin and eosin and if necessary with standard immunohistochemistry (IHC) procedures as part of standard diagnostics. For mass cytometry analysis, a tissue sample of about 5x5x5 mm (about 0.125 cm3 volume) was taken prior to paraffin embedding, thus the tumor area processed for mass cytometry analysis was spatially separate from the tumor area stained for prognostic and predictive biomarkers. However, the pathologists selected a research sample for this study that was macroscopically representative of the whole tumor based on many years of experience. From the clinical perspective, the presence of DCIS is of less importance for diagnosis than detection of tumor invasiveness, and invasive tumor tissues were chosen as tumor-representative samples for this study. It is likely that DCIS surrounding the tumor was also sampled and possible that some DCIS was present in non-cancerous tissue juxtaposed to the tumor. This might underlie the grouping of some juxta-tumoral tissue samples with their matched tumor in Figure 5A. Since the specific tissue areas used in this study could not be examined by frozen section or hematoxylin and eosin because they were dissociated during the mass cytometry workflow, we unfortunately do not know whether and how much DCIS was present in each of the samples. We have an indication based on the pathological histology analysis; see notes in Table S2. It is highly unlikely, however, that extensive areas of DCIS in the non-cancerous juxta-tumoral tissue were overlooked preoperatively, since the patients underwent extensive imaging of the breast before surgery, and no abnormalities were noted. The small differences between the percentages of cells positive for ER, PR, HER2, and Ki-67 as assessed by pathological IHC compared to the mass cytometry analysis (Figures S1I and S1J) are likely caused by usage of differences in antibody clones, in assay sensitivities, and in sampled tumor volumes (mass cytometry, large volume about 0.125 cm3; IHC, small volume). Tumor subtype definitions in this study were as follows: Luminal A (ER+ and/or PR+, HER2-, Ki-67+ < 20%), Luminal B (ER+ and/or PR+, HER2-, Ki-67+ ≥ 20%), Luminal B-HER2+ (ER+ and/or PR+, HER2+), HER2+ (ER-PR-HER2+), and triple negative (TN; ER-PR-HER2-). Some tumor ecosystems grouped together with juxta-tumoral and mammoplasty samples in Figure 5A. These were of Luminal A subtype and low grade, possibly reflecting that the tumor was phenotypically similar to non-cancerous tissue or that the tumor content was particularly low in these samples. Ten patients had received neoadjuvant (NA) chemotherapy prior to sample collection for this study including one of 54 Luminal A, five of 71 Luminal B, two of six Luminal B-HER2+, and two of six TN patients (Table S2). We did not see any significant difference between tumors from NA-treated patients and tumors from untreated patients in terms of cell type frequency, epithelial and immune phenotype frequencies, phenotypic abnormality, or individuality. For four patients, two different areas of the same tumor had been sampled.
Cell lines
Human mammary epithelial cell lines were obtained from the American Type Culture Collection (ATCC) and cultured according to ATCC recommendations. Cell lines included MCF-10A, MDA-MB-134-VI, MDA-MB-231, MDA-MB-453, SK-BR-3, and ZR-75-1. Fibroblasts were a gift from the laboratory of Prof. Silvio Hemmi at the University of Zurich and were cultured in DMEM medium (Sigma Aldrich) supplemented with 2 mM L-glutamine, 1 mM sodium pyruvate, and 10% fetal bovine serum (FBS). Peripheral blood mononuclear cells (PBMCs) from healthy donors were obtained from the Zurich Blood Transfusion Service and were isolated by histopaque (Sigma Aldrich) density gradient centrifugation.
Method Details
Tissue preparation
Following surgical resection, fresh tissue samples were immediately transferred to pre-cooled MACS Tissue Storage Solution (Miltenyi Biotec) and were shipped at 4°C. Tissue processing was completed within 24 hours of collection. For dissociation, the tissue was minced using surgical scalpels and further disintegrated using the Tumor Dissociation Kit, human (Miltenyi Biotech) and the gentleMACS Dissociator (Miltenyi Biotech) according to manufacturer’s instructions. The resulting single-cell suspension was filtered sequentially through sterile 70-μm and 40-μm cell strainers. The cell suspension was stained for viability with 25 μM cisplatin (Enzo Life Sciences) in a 1-min pulse before quenching with 10% FBS. Cells were then fixed with 1.6% paraformaldehyde (PFA, Electron Microscopy Sciences) for 10 min at room temperature and stored at −80°C.
Mass-tag cellular barcoding
To minimize inter-sample staining variation, we applied mass-tag barcoding to fixed cells (Zunder et al., 2015). A 126-well barcoding scheme composed of unique combinations of four out of nine barcoding metals was used for this study; metals included palladium (105Pd, 106Pd, 108Pd, 110Pd, Fluidigm) conjugated to bromoacetamidobenzyl-EDTA (Dojindo) as well as indium (113In and 115In, Fluidigm), yttrium, rhodium, and bismuth (89Y, 103Rh, 209Bi, Sigma Aldrich) conjugated to maleimido-mono-amide-DOTA (Macrocyclics). The concentrations were adjusted to 20 nM (209Bi), 100 nM (105-110Pd, 115In, 89Y), 200 nM (113In), or 2 μM (103Rh). Cells were randomly distributed across two 96-well plates, and about 0.3 million cells per well were barcoded using a transient partial permeabilization protocol. Cells were washed once with 0.03% saponin in PBS (Sigma Aldrich) prior to incubation in 200 μl barcoding reagent for 30 min at room temperature. Cells were then washed four times with cell staining medium (CSM, PBS with 0.3% saponin, 0,5% bovine serum albumin (Sigma Aldrich) supplemented with 2 mM EDTA (StemCell Technologies, Inc.) and pooled for antibody staining. Two 126-well barcoding plates, with a set of standard samples on each plate, were used for antibody staining with the tumor cell-centric and the immune cell-centric panels (Tables S3 and S4, respectively).
Antibodies and antibody labeling
All antibodies and corresponding clone, provider, and metal tag are listed in Tables S3 and S4. Target specificity of the antibodies was confirmed in our laboratory. Antibodies were obtained in carrier/protein-free buffer or were purified using the Magne Protein A or G Beads (Promega) according to manufacturer’s instructions. Metal-labeled antibodies were prepared using the Maxpar X8 Multimetal Labeling Kit (Fluidigm) according to manufacturer’s instructions. After conjugation, the protein concentration was determined using a Nanodrop (Thermo Scientific), and the metal-labeled antibodies were diluted in Antibody Stabilizer PBS (Candor Bioscience) to a concentration of 200 or 300 μg/ml for long-term storage at 4°C. Optimal concentrations for antibodies were determined by titration, and antibodies were managed using the cloud-based platform AirLab as previously described (Catena et al., 2016).
Antibody staining and cell volume quantification
Antibody staining was performed on pooled samples after mass-tag cellular barcoding. The pooled samples were incubated with FcR Blocking Reagent, human (Miltenyi Biotech) for 10 min at 4°C and then washed once with CSM. For staining with the immune cell-centric antibody panel (Table S3), cells were incubated for 45 min at 4°C followed by three washes with CSM. For staining with the tumor cell-centric antibody panel (Table S4), purified rabbit anti-human ERα (Epitomics) was applied at 3 μg/ml for 45 min at 4°C, and then samples were washed twice with CSM. Goat anti-rabbit IgG (Vector Labs) conjugated to 165Ho was then applied at 0.25 μg/ml for 45 min at 4°C followed by two washes with CSM. The sample was then stained with the remaining antibodies of the panel (Table S4) for 45 min at 4°C followed by three washes with CSM. For mass-based cell detection, cells were stained with 500 μM nucleic acid intercalator iridium (191Ir and 193Ir, Fluidigm) in PBS with 1.6% PFA (Electron Microscopy Sciences) for 1 h at room temperature or overnight at 4°C. Cells were washed once with CSM and once with 0.03% saponin in PBS. For cell volume quantification, cells were stained with 12.5 μg/ml Bis(2,2′-bipyridine)-4′-methyl-4-carboxybipyridine-ruthenium-N-succidimyl ester-bis(hexafluorophosphate) (96Ru, 98-102Ru, 104Ru, Sigma Aldrich) in 0.1 M sodium hydrogen carbonate (Sigma Aldrich) for 10 min at room temperature as previously described (Rapsomaniki et al., 2018). Cells were then washed twice with CSM, twice with 0.03% saponin in PBS, and twice with doubly distilled water (ddH2O). For mass cytometry acquisition, cells were diluted to 0.5 million cells/ml in ddH2O containing 10% EQ™ Four Element Calibration Beads (Fluidigm) and filtered through a 40-μm filter-cap FACS tube. Samples were placed on ice and introduced into the Helios upgraded CyTOF2 (Fluidigm) using the Super Sampler (Victorian Airship) introduction system; data were collected as .fcs files.
Gadolinium contamination test
Some patients were scanned by magnetic resonance imaging for medical diagnosis and received a gadolinium-based contrast agent. A small aliquot of each sample was tested for the presence of gadolinium after fixation using mass cytometry. Gadolinium-positive cells were removed from data analysis by gating (Figure S1C).
Immunofluorescence imaging
We selected formalin-fixed paraffin embedded (FFPE) sections of breast cancer resectates for which mass cytometry analysis has been performed on a different region of the same tumor. FFPE sections were stained using the Opal 7-Color IHC Kit (PerkinElmer) according to manufacturer’s protocol. Briefly, slides were deparaffinized, rehydrated, and antigen retrieved using Trilogy buffer (CellMarque) by autoclaving for 15 min. Slides were treated with 3% H2O2 for 15 min, washed, and blocked using 4% BSA/PBS/0.1% Triton X-100 (all from Sigma). Primary antibodies and consecutive HRP-conjugated secondary antibodies (Table S6) were diluted in 1% BSA/PBS/0.1% Triton X-100. Primary antibodies were incubated over night at 4°C and secondary antibodies were incubated for 1 h at room temperature. Slides were then incubated in Amplification diluent containing a tyramide-conjugated fluorophore for 10 min. Prior to the next primary antibody incubation, the slides were heated for 10 min in 10 mM citric acid, pH 6.0 at 95°C to strip the antibodies of the previous staining round. The protocol was repeated from the blocking step until a total of six markers were co-stained. After the last staining round, the slides were washed, incubated with 0.5 μg/ml 4′,6 diamidine-2-phenylindole (DAPI; ThermoFischer) for 5 min, washed again, and mounted using Prolong Diamond medium (ThermoFischer). The following set of markers was analyzed for each sample (indicated in the order of staining): CTLA-4, PD-L1, PD-1, CD68, CD3e, PanK+EpCAM. Slides were scanned using the multispectral imaging system Vectra 3.0 (PerkinElmer), and multispectral images were analyzed using the InForm Cell Analysis software (PerkinElmer). Images were processed in Fiji and contrast was enhanced to improve visibility.
Quantification and Statistical Analysis
Mass cytometry data preprocessing
Mass cytometry data were concatenated using the .fcs File Concatenation Tool (Cytobank, Inc.), normalized using the MATLAB version of the Normalizer tool (Finck et al., 2013), and debarcoded using the CATALYST R/Bioconductor package (Chevrier et al., 2018). Debarcoded files were compensated for channel crosstalk using single-stained polystyrene beads as previously described (Chevrier et al., 2018). The compensated .fcs files were uploaded to the Cytobank server (Cytobank, Inc.) for manual gating on populations of interest. For Figure 1, manual gates were set to exclude nonspecific background signal and cisplatin-positive dead cells (Figure S1C). The resulting population was exported as .fcs files and loaded into R (R Core Team, 2016) for downstream analysis. Sample duplicates that were used to ensure high data quality between two barcoding plates (Figure S1D) were concatenated for downstream analysis.
Dimensionality reduction and clustering
For dimensionality reduction visualizations using the t-SNE algorithm (Van Der Maaten and Hinton, 2008), signal intensities (dual counts) per channel were arcsinh-transformed with a cofactor of 5 (counts_transf = asinh(x/5)). The R t-SNE package for Barnes-Hut implementation was used. For marker expression level visualization on t-SNE plots, the expression was normalized between 0 and 1 to the 99th percentile and the top percentile was set to 1.
Exploration of batch effects
To assess the presence of batch effects in the data originating from possible confounding factors related to, for example, sample origin or sample preparation, an approach based on principal component analysis was followed, similar to the one proposed previously for high-throughput data analysis (Leek et al., 2010). Initially, 1000 cells from each sample were randomly selected and then the principal components (PC) of the multidimensional protein abundance measurements of these cells were computed. To assess how much of the variability in the PCs was due to the actual protein measurements, the values of Spearman’s correlation coefficients between the two first PCs (in total 61% of variance explained) and all protein measurements were computed (Figure S1F); values were highly correlated. To address the presence of possible batch effects, the same process was repeated using all possible confounders (namely the operator, barcoding plate, hospital of origin, date of sample receipt, and transport time). This time the computed correlation values were negligible (Figure S1G), indicating absence of batch effects related to sample origin or processing.
Epithelial cell selection and immune cell type selection
To generate an in-depth phenotypic characterization of epithelial and immune cells, we applied PhenoGraph (Levine et al., 2015), a state-of-the-art graph based clustering algorithm able to partition high-dimensional data into groups. Since the original data size was prohibitive in terms of computational resources, a combined approach coupling artificial neural networks (ANNs) and PhenoGraph was employed. We first created a representative cell pre-selection using a custom down sampling approach to address the discrepancies in total numbers of cells per sample: for samples with less than 1000 cells, all cells were considered; for samples between 1000 and 2000 cells, half of the cells were randomly sampled; for samples between 2000 and 5000 cells, 30% of the cells were randomly selected; and for all other samples, 20% of the cells were randomly selected. This down sampling scheme resulted in a dataset of approximately 700,000 cells. This process balanced the discrepancies in terms of number of cells per sample, while at the same time adequately representing all samples. All cells were clustered using PhenoGraph, and the clusters were labeled as epithelial based on expression of one or more of the following epithelial markers: EpCAM, E-Cadherin, pan cytokeratin, K5, K7, K8, K18, and/or K14 (Figure S1M). All other cells were labeled as non-epithelial. This labeled dataset was used as input to train an ANN classifier consisting of one hidden layer of 20 neurons (with a hyperbolic tangent sigmoid transfer function) and one output layer of one neuron (with a softmax transfer function). The dataset was randomly split into training (50%), validation (25%), and test (25%) sets. The ANN was trained using the scaled conjugate gradient method (Møller, 1993), and its performance was evaluated using a standard cross-entropy function. Training was terminated upon convergence after 254 epochs, when the ANN’s performance failed to improve for 10 consecutive validation runs. The ANN’s performance on the test set indicated very high concordance with the expert labeling with an overall accuracy of 99.5% (true positive rate of 99.1%, true negative rate of 99.6%). The ANN was then applied to the remaining data. It successfully classified a total of approximately 4 million cells as epithelial. The same down sampling scheme as above was employed to limit their number to a computationally manageable subset of approximately 850,000 cells, which were subsequently used for all downstream analysis. The same process was used for all immune cells (CD45+ cells, Figure S2A), but this time, the cells were assigned to belong to eight different cluster types (T cells, natural killer cells, granulocytes, B cells, plasma cells, plamacytoid dendritic cells, myeloid cells, and basophils) based on expression of immune cell type-specific markers (Figure S2D). The same ANN settings were used, apart from the output layer, which consisted of eight nodes. The ANN’s performance on the test set yielded an accuracy of 99.5%. All of the above computations were implemented using MATLAB’s R2018a Neural Network Toolbox (MathWorks). For the heatmaps shown in Figures 2D, 2L, and 3C, clustering was performed on the abundance levels of the shown markers, using Spearman correlation as a distance function and average linkage. The FAP and SMA gates used to identify different fibroblast subsets in Figure S1P were estimated based on Costa et al. (2018).
Clustering consensus
To address the inherent stochasticity of the used clustering algorithm, we performed an extensive comparison between different PhenoGraph runs with different random initializations. We tested values of parameter k (number of nearest neighbors) of 30 (default value, as recommended by the authors of PhenoGraph) and 100. For each of these values of k, we executed PhenoGraph 100 times and computed the agreement between different assignments using the adjusted Rand index (ARI) (Hubert and Arabie, 1985), a standard metric of similarity between individual clustering runs. The ARI was computed between any two clustering assignments to quantify the probability that a pair of cells were assigned to the same cluster (independently of cluster label) in both runs, while additionally adjusting for chance. An ARI of 1 indicates identical cluster outcomes, whereas values close to zero indicate random assignments. For the epithelial cells, the runs with k = 30 had a mean ARI of 0.63, and the runs with k = 100 had a mean ARI of 0.81. Examination of all pairwise agreements (Figure S3A) showed a few outliers. Without these outliers, the mean ARI was approximately 0.85. For the rest of the analysis, we selected the clustering with the highest mean ARI as the most representative. The ARI computations were implemented in Python using the module metrics in the package scikit-learn.
Quantification of phenotypic abnormality
To quantify how patterns found in tumor cells deviate from “normal” mammary cells, we used a novelty detection method based on autoencoders. Autoencoders are a class of ANNs that attempt to reconstruct their input by initially transforming the data to a lower-dimensional representation via an encoding function, and then reconstruct the input from the compressed representation using a decoding function. Due to the compression, the reconstruction is by definition lossy. Thus, the model learns to capture the most prominent features and interdependencies that minimize information loss. We created an undercomplete, dense autoencoder network and used as input a data matrix where the rows corresponded to the pool of cells from juxta-tumoral tissue samples, and the columns to the 27 protein channels considered. The network consisted of five layers of the following sizes: 27, 10, 2, 10, and 27. The dataset was randomly split into training and validation (70%) and test (30%) sets, and the data was scaled to [0,1]. We used the Rectified Linear Unit (ReLU) as a transfer function between all layers, apart from the output layer where a softmax function was used to compress the output to the same dynamic range as the input. To evaluate the performance of the reconstruction, we used a mean squared error (MSE) as a loss function:
where denotes the training samples, the encoding functions, and the decoding functions. We employed Adam (Kingma and Ba, 2015) as an optimizer with a batch size of 256; training was terminated upon convergence with an early stopping criterion of ten epochs with no significant decrease in the validation loss function (the maximum number of epochs was set to 500). The trained network was able to create a reconstruction with high agreement with the real input with a median test set MSE of 0.007. The model was implemented in Python using the neural network API Keras with a TensorFlow backend. Once the network was trained, we fed it with the equivalent tumor single-cell data and quantified MSE for each tumor cell. Since the autoencoder was trained to reconstruct patterns found in juxta-tumoral tissue-derived cells, high values of MSE indicate strong deviations from normal. The median MSE for each tumor served as a measure of tumor phenotypic abnormality from the average juxta-tumoral tissue. We detected known normal luminal and basal cell phenotypes in our non-cancerous mammary gland controls (Figure 3D) and observed a strong phenotypic overlap between juxta-tumoral tissue and mammoplasty tissue (Figures 3B, 3C, and 4N), therefore we are confident that the non-cancerous juxta-tumoral tissue can be used as a “close-to-normal” control for comparisons with tumor. We did not use the four mammoplasty samples for training the autoencoder to determine tumor cell phenotypic abnormality, because not enough mammoplasty tissue-derived cells were measured and the mammoplasty samples contained very few basal cells.
Tumor individuality
To assess tumor individuality, we devised a graph-based approach based on k-nearest neighbor (k-NN) classification. We started with single cells that originated from samples. Each cell was described by a multidimensional data vector that contains the protein measurements, and its sample ID . Initially, a k-NN graph was constructed, where each cell was connected to the k = 100 nearest neighbors as computed using the Euclidean distance in the high-dimensional space. The probability that a cell originated from sample was equal to the sample’s frequency in the dataset:
Then, for each cell , we retrieved its nearest neighbors and their sample IDs and computed the posterior probability that cell originated from sample by assessing the neighbors’ votes, weighted by the priors:
The cell was assigned to the sample with the highest posterior (i.e., ), which was the sample “voted” by the majority of its neighbors. Last, for all cells from the same sample, we computed the mean of all posterior probabilities:
This step simply averaged the results so that we saw sample-to-sample probabilities and not cell-to-sample probabilities, and it resulted in a matrix, expressing similarities between samples based on patterns of neighboring cells in the graph. Values on the diagonal of this matrix expressed how “self-contained” each sample was in the graph and are referred to as the tumor individuality score. Values close to 1 indicate that the sample is localized within an isolated region of the graph, and smaller values indicate that the sample is intermixed with cells from other samples.
Chord diagram
Pairwise correlations between clusters were visualized as chord diagrams in R using the circlize package (Gu et al., 2014). Links are shown for all cluster pairs with p < 0.01 using Spearman correlation.
Tumor grouping
To group the samples based on shared patterns in their ecosystem, we clustered the frequencies per sample of all epithelial and immune clusters. The population frequencies quantify to which extent each sample belongs to the different clusters and, as such, can be seen as a probability distribution across all populations that sum to 1. For this reason, we employed the Jensen-Shannon divergence (JSD) as an appropriate method of measuring the similarity between probability distributions. Here denotes the probability density of samples over all populations. The JSD between samples is defined as follows:
where and is the Kullback-Leibler (KL) divergence:
In contrast to the KL divergence, the JSD is symmetric and bounded between 0 and 1. To cluster the samples and populations, we used a hierarchical biclustering algorithm. Similarities between samples based on their cluster assignments were computed using the JSD, similarities between clusters were computed using a cosine distance metric, and an average linkage was used for both rows and columns. To derive sample groups from the resulting dendrogram, we used a distance cutoff of 0.16. To identify the populations responsible for the grouping, we used a feature selection/classification approach based on random forests (Breiman, 2001). For each group considered, we created a dataset that included all samples belonging to the group (class 1) and an equal number of samples from all other groups (class 0). We fitted a random forest classifier with 1000 trees; in all cases, we were able to separate the classes with reasonable accuracy. To identify how relevant each population was to the separation, we derived the feature importance of all populations from the ensemble of trees. All methods were implemented in Python using the packages seaborn (clustermap), scipy (hierarchy), and scikit-learn (decomposition, RandomForestClassifier).
Data and Software Availability
The mass cytometry data (.fcs files) and immunofluorescence images generated in this study are deposited in Mendeley Data (https://doi.org/10.17632/gb83sywsjc.1).
Acknowledgments
We are grateful for the generous donation of tissue samples by patients undergoing surgery, facilitated by sample acquisition through the PATH foundation. We thank the Bodenmiller lab for fruitful discussions, Vito R.T. Zanotelli for advice regarding data visualization, and Stefanie Engler for excellent technical support. We thank the Systems Biology group at IBM Rueschlikon and especially Matteo Manica for excellent discussions. B.B.’s research is funded by an SNSF R’Equip grant, an SNSF assistant professorship grant, the SystemsX Transfer Project “Friends and Foes,” SystemsX MetastasiX and PhosphoNetX grants, and by the European Research Council (ERC) under the European Union Seventh Framework Program (FP/2007-2013)/ERC grant agreement 336921. S.C. was funded by a Roche postdoctoral fellowship. B.B., M.A.R., S.M.S., S.D.S., W.P.W., and M.R.M. were supported by a SystemsX MetastasiX grant.
Author Contributions
J. Wagner and B.B. conceived the study. J. Wagner performed all experiments with help from S.C., A.J., and K.S. M.A.R., J. Wagner, S.C., J. Windhager, and M.R.M. performed data analyses. M.A.R. and M.R.M. conceived the artificial neural network analysis, clustering consensus analysis, and phenotypic abnormality and individuality scores. T.A., C.L., A.D., M.R., A.R., S.M., S.D.S., K.J.D., and W.P.W. collected and processed the tissue samples. J. Wagner, M.A.R., S.C., K.S., A.J., W.P.W., M.R.M., M.v.d.B., and B.B. performed the biological analysis and interpretation. J. Wagner and B.B. wrote the manuscript with input from all authors.
Declaration of Interests
The authors declare no competing interests.
Published: April 11, 2019
Footnotes
Supplemental Information can be found online at https://doi.org/10.1016/j.cell.2019.03.005.
Supplemental Information
References
- American Joint Committee on Cancer . In: AJCC Cancer Staging Manual. Eighth Edition. Amin M.B., Edge S., Greene F., Byrd D.R., Brookland R.K., Washington M.K., Gershenwald J.E., Compton C.C., Hess K.R., Sullivan D.C., Jessup J.M., Brierley J.D., Gaspar L.E., Schilsky R.L., Balch C.M., Winchester D.P., Asare E.A., Madera M., Gress D.M., Meyer L.R., editors. Springer International Publishing; 2017. [Google Scholar]
- Angelo M., Bendall S.C., Finck R., Hale M.B., Hitzman C., Borowsky A.D., Levenson R.M., Lowe J.B., Liu S.D., Zhao S. Multiplexed ion beam imaging of human breast tumors. Nat. Med. 2014;20:436–442. doi: 10.1038/nm.3488. [DOI] [PMC free article] [PubMed] [Google Scholar]
- Azizi E., Carr A.J., Plitas G., Cornish A.E., Konopacki C., Prabhakaran S., Nainys J., Wu K., Kiseliovas V., Setty M. Single-Cell Map of Diverse Immune Phenotypes in the Breast Tumor Microenvironment. Cell. 2018;174:1293–1308.e36. doi: 10.1016/j.cell.2018.05.060. [DOI] [PMC free article] [PubMed] [Google Scholar]
- Bandura D.R., Baranov V.I., Ornatsky O.I., Antonov A., Kinach R., Lou X., Pavlov S., Vorobiev S., Dick J.E., Tanner S.D. Mass cytometry: technique for real time single cell multitarget immunoassay based on inductively coupled plasma time-of-flight mass spectrometry. Anal. Chem. 2009;81:6813–6822. doi: 10.1021/ac901049w. [DOI] [PubMed] [Google Scholar]
- Bendall S.C., Simonds E.F., Qiu P., Amir el-A.D., Krutzik P.O., Finck R., Bruggner R.V., Melamed R., Trejo A., Ornatsky O.I. Single-cell mass cytometry of differential immune and drug responses across a human hematopoietic continuum. Science. 2011;332:687–696. doi: 10.1126/science.1198704. [DOI] [PMC free article] [PubMed] [Google Scholar]
- Breiman L. Random forests. Mach. Learn. 2001;45:5–32. [Google Scholar]
- Buisseret L., Garaud S., De Wind A., Van den Eynden G., Boisson A., Solinas C., Gu-Trantien C., Naveaux C., Lodewyckx J.N., Duvillier H. Tumor-infiltrating lymphocyte composition, organization and PD-1/PD-l1 expression are linked in breast cancer. OncoImmunology. 2016;6:e1257452. doi: 10.1080/2162402X.2016.1257452. [DOI] [PMC free article] [PubMed] [Google Scholar]
- Cassetta L., Pollard J.W. Targeting macrophages: therapeutic approaches in cancer. Nat. Rev. Drug Discov. 2018 doi: 10.1038/nrd.2018.169. Published online October 26, 2018. [DOI] [PubMed] [Google Scholar]
- Catena R., Özcan A., Jacobs A., Chevrier S., Bodenmiller B. AirLab: a cloud-based platform to manage and share antibody-based single-cell research. Genome Biol. 2016;17:142. doi: 10.1186/s13059-016-1006-0. [DOI] [PMC free article] [PubMed] [Google Scholar]
- Chamberlin T., D’Amato J.V., Arendt L.M. Obesity reversibly depletes the basal cell population and enhances mammary epithelial cell estrogen receptor alpha expression and progenitor activity. Breast Cancer Res. 2017;19:128. doi: 10.1186/s13058-017-0921-7. [DOI] [PMC free article] [PubMed] [Google Scholar]
- Chevrier S., Levine J.H., Zanotelli V.R.T., Silina K., Schulz D., Bacac M., Ries C.H., Ailles L., Jewett M.A.S., Moch H. An Immune Atlas of Clear Cell Renal Cell Carcinoma. Cell. 2017;169:736–749.e18. doi: 10.1016/j.cell.2017.04.016. [DOI] [PMC free article] [PubMed] [Google Scholar]
- Chevrier S., Crowell H.L., Zanotelli V.R.T., Engler S., Robinson M.D., Bodenmiller B. Compensation of Signal Spillover in Suspension and Imaging Mass Cytometry. Cell Syst. 2018;6:612–620.e5. doi: 10.1016/j.cels.2018.02.010. [DOI] [PMC free article] [PubMed] [Google Scholar]
- Chung W., Eum H.H., Lee H.O., Lee K.M., Lee H.B., Kim K.T., Ryu H.S., Kim S., Lee J.E., Park Y.H. Single-cell RNA-seq enables comprehensive tumour and immune cell profiling in primary breast cancer. Nat. Commun. 2017;8:15081. doi: 10.1038/ncomms15081. [DOI] [PMC free article] [PubMed] [Google Scholar]
- Cimino-Mathews A., Thompson E., Taube J.M., Ye X., Lu Y., Meeker A., Xu H., Sharma R., Lecksell K., Cornish T.C. PD-L1 (B7-H1) expression and the immune tumor microenvironment in primary and metastatic breast carcinomas. Hum. Pathol. 2016;47:52–63. doi: 10.1016/j.humpath.2015.09.003. [DOI] [PMC free article] [PubMed] [Google Scholar]
- Coates A.S., Winer E.P., Goldhirsch A., Gelber R.D., Gnant M., Piccart-Gebhart M., Thürlimann B., Senn H.-J., Panel Members Tailoring therapies--improving the management of early breast cancer: St Gallen International Expert Consensus on the Primary Therapy of Early Breast Cancer 2015. Ann. Oncol. 2015;26:1533–1546. doi: 10.1093/annonc/mdv221. [DOI] [PMC free article] [PubMed] [Google Scholar]
- Costa A., Kieffer Y., Scholer-Dahirel A., Pelon F., Bourachot B., Cardon M., Sirven P., Magagna I., Fuhrmann L., Bernard C. Fibroblast Heterogeneity and Immunosuppressive Environment in Human Breast Cancer. Cancer Cell. 2018;33:463–479.e10. doi: 10.1016/j.ccell.2018.01.011. [DOI] [PubMed] [Google Scholar]
- Curtis C., Shah S.P., Chin S.F., Turashvili G., Rueda O.M., Dunning M.J., Speed D., Lynch A.G., Samarajiwa S., Yuan Y., METABRIC Group The genomic and transcriptomic architecture of 2,000 breast tumours reveals novel subgroups. Nature. 2012;486:346–352. doi: 10.1038/nature10983. [DOI] [PMC free article] [PubMed] [Google Scholar]
- Daud A.I., Loo K., Pauli M.L., Sanchez-Rodriguez R., Sandoval P.M., Taravati K., Tsai K., Nosrati A., Nardo L., Alvarado M.D. Tumor immune profiling predicts response to anti-PD-1 therapy in human melanoma. J. Clin. Invest. 2016;126:3447–3452. doi: 10.1172/JCI87324. [DOI] [PMC free article] [PubMed] [Google Scholar]
- Dieci M.V., Griguolo G., Miglietta F., Guarneri V. The immune system and hormone-receptor positive breast cancer: Is it really a dead end? Cancer Treat. Rev. 2016;46:9–19. doi: 10.1016/j.ctrv.2016.03.011. [DOI] [PubMed] [Google Scholar]
- Egelston C.A., Avalos C., Tu T.Y., Simons D.L., Jimenez G., Jung J.Y., Melstrom L., Margolin K., Yim J.H., Kruper L. Human breast tumor-infiltrating CD8+ T cells retain polyfunctionality despite PD-1 expression. Nat. Commun. 2018;9:4297. doi: 10.1038/s41467-018-06653-9. [DOI] [PMC free article] [PubMed] [Google Scholar]
- Finck R., Simonds E.F., Jager A., Krishnaswamy S., Sachs K., Fantl W., Pe’er D., Nolan G.P., Bendall S.C. Normalization of mass cytometry data with bead standards. Cytometry A. 2013;83:483–494. doi: 10.1002/cyto.a.22271. [DOI] [PMC free article] [PubMed] [Google Scholar]
- Fischer K.R., Durrans A., Lee S., Sheng J., Li F., Wong S.T.C., Choi H., El Rayes T., Ryu S., Troeger J. Epithelial-to-mesenchymal transition is not required for lung metastasis but contributes to chemoresistance. Nature. 2015;527:472–476. doi: 10.1038/nature15748. [DOI] [PMC free article] [PubMed] [Google Scholar]
- Fortier A.M., Van Themsche C., Asselin E., Cadrin M. Akt isoforms regulate intermediate filament protein levels in epithelial carcinoma cells. FEBS Lett. 2010;584:984–988. doi: 10.1016/j.febslet.2010.01.045. [DOI] [PubMed] [Google Scholar]
- Giesen C., Wang H.A.O., Schapiro D., Zivanovic N., Jacobs A., Hattendorf B., Schüffler P.J., Grolimund D., Buhmann J.M., Brandt S. Highly multiplexed imaging of tumor tissues with subcellular resolution by mass cytometry. Nat. Methods. 2014;11:417–422. doi: 10.1038/nmeth.2869. [DOI] [PubMed] [Google Scholar]
- Goodfellow I., Bengio Y., Courville A. Vol. 738. MIT Press; 2016. Deep Learning. [Google Scholar]
- Gu Z., Gu L., Eils R., Schlesner M., Brors B. circlize Implements and enhances circular visualization in R. Bioinformatics. 2014;30:2811–2812. doi: 10.1093/bioinformatics/btu393. [DOI] [PubMed] [Google Scholar]
- Hinton G.E., Salakhutdinov R.R. Reducing the dimensionality of data with neural networks. Science. 2006;313:504–507. doi: 10.1126/science.1127647. [DOI] [PubMed] [Google Scholar]
- Hsu J.L., Hung M.C. The role of HER2, EGFR, and other receptor tyrosine kinases in breast cancer. Cancer Metastasis Rev. 2016;35:575–588. doi: 10.1007/s10555-016-9649-6. [DOI] [PMC free article] [PubMed] [Google Scholar]
- Hubert L., Arabie P. Comparing partitions. J. Classif. 1985;2:193–218. [Google Scholar]
- Karakasheva T.A., Dominguez G.A., Hashimoto A., Lin E.W., Chiu C., Sasser K., Lee J.W., Beatty G.L., Gabrilovich D.I., Rustgi A.K. CD38+ M-MDSC expansion characterizes a subset of advanced colorectal cancer patients. JCI Insight. 2018;3:1–8. doi: 10.1172/jci.insight.97022. [DOI] [PMC free article] [PubMed] [Google Scholar]
- Keren L., Bosse M., Marquez D., Angoshtari R., Jain S., Varma S., Yang S.R., Kurian A., Van Valen D., West R. A Structured Tumor-Immune Microenvironment in Triple Negative Breast Cancer Revealed by Multiplexed Ion Beam Imaging. Cell. 2018;174:1373–1387.e19. doi: 10.1016/j.cell.2018.08.039. [DOI] [PMC free article] [PubMed] [Google Scholar]
- Kingma, D.P., and Ba, J.L. (2015). Adam: a Method for Stochastic Optimization. arXiv, arXiv:1412.6980, https://arxiv.org/abs/1412.6980.
- Kotecha N., Krutzik P.O., Irish J.M. Web-based analysis and publication of flow cytometry experiments. Curr. Protoc. Cytom. Published online July. 2010;2010 doi: 10.1002/0471142956.cy1017s53. [DOI] [PMC free article] [PubMed] [Google Scholar]
- Lavin Y., Kobayashi S., Leader A., Amir E.D., Elefant N., Bigenwald C., Remark R., Sweeney R., Becker C.D., Levine J.H. Innate Immune Landscape in Early Lung Adenocarcinoma by Paired Single-Cell Analyses. Cell. 2017;169:750–765.e17. doi: 10.1016/j.cell.2017.04.014. [DOI] [PMC free article] [PubMed] [Google Scholar]
- Leek J.T., Scharpf R.B., Bravo H.C., Simcha D., Langmead B., Johnson W.E., Geman D., Baggerly K., Irizarry R.A. Tackling the widespread and critical impact of batch effects in high-throughput data. Nat. Rev. Genet. 2010;11:733–739. doi: 10.1038/nrg2825. [DOI] [PMC free article] [PubMed] [Google Scholar]
- Levine J.H., Simonds E.F., Bendall S.C., Davis K.L., Amir A.D., Tadmor M.D., Litvin O., Fienberg H.G., Jager A., Zunder E.R. Data-Driven Phenotypic Dissection of AML Reveals Progenitor-like Cells that Correlate with Prognosis. Cell. 2015;162:184–197. doi: 10.1016/j.cell.2015.05.047. [DOI] [PMC free article] [PubMed] [Google Scholar]
- Li H., van der Leun A.M., Yofe I., Lubling Y., Gelbard-Solodkin D., van Akkooi A.C.J., van den Braber M., Rozeman E.A., Haanen J.B.A.G., Blank C.U. Dysfunctional CD8 T Cells Form a Proliferative, Dynamically Regulated Compartment within Human Melanoma. Cell. 2019;176:775–789.e18. doi: 10.1016/j.cell.2018.11.043. [DOI] [PMC free article] [PubMed] [Google Scholar]
- Marusyk A., Almendro V., Polyak K. Intra-tumour heterogeneity: a looking glass for cancer? Nat. Rev. Cancer. 2012;12:323–334. doi: 10.1038/nrc3261. [DOI] [PubMed] [Google Scholar]
- MathWorks, Inc. (2018). MATLAB and Statistics Toolbox Release 2015b. Natick, Massachusetts, United States. https://www.mathworks.com.
- McAllister S.S., Weinberg R.A. Tumor-host interactions: a far-reaching relationship. J. Clin. Oncol. 2010;28:4022–4028. doi: 10.1200/JCO.2010.28.4257. [DOI] [PubMed] [Google Scholar]
- Møller M.F. A scaled conjugate gradient algorithm for fast supervised learning. Neural Netw. 1993;6:525–533. [Google Scholar]
- Murphy C.G., Dickler M.N. Endocrine resistance in hormone-responsive breast cancer: mechanisms and therapeutic strategies. Endocr. Relat. Cancer. 2016;23:R337–R352. doi: 10.1530/ERC-16-0121. [DOI] [PubMed] [Google Scholar]
- Neve R.M., Chin K., Fridlyand J., Yeh J., Baehner F.L., Fevr T., Clark L., Bayani N., Coppe J.P., Tong F. A collection of breast cancer cell lines for the study of functionally distinct cancer subtypes. Cancer Cell. 2006;10:515–527. doi: 10.1016/j.ccr.2006.10.008. [DOI] [PMC free article] [PubMed] [Google Scholar]
- Nik-Zainal S., Van Loo P., Wedge D.C., Alexandrov L.B., Greenman C.D., Lau K.W., Raine K., Jones D., Marshall J., Ramakrishna M., Breast Cancer Working Group of the International Cancer Genome Consortium The life history of 21 breast cancers. Cell. 2012;149:994–1007. doi: 10.1016/j.cell.2012.04.023. [DOI] [PMC free article] [PubMed] [Google Scholar]
- Park I.A., Hwang S.-H., Song I.H., Heo S.-H., Kim Y.-A., Bang W.S., Park H.S., Lee M., Gong G., Lee H.J. Expression of the MHC class II in triple-negative breast cancer is associated with tumor-infiltrating lymphocytes and interferon signaling. PLoS ONE. 2017;12:e0182786. doi: 10.1371/journal.pone.0182786. [DOI] [PMC free article] [PubMed] [Google Scholar]
- Parker J.S., Mullins M., Cheang M.C., Leung S., Voduc D., Vickery T., Davies S., Fauron C., He X., Hu Z. Supervised risk predictor of breast cancer based on intrinsic subtypes. J. Clin. Oncol. 2009;27:1160–1167. doi: 10.1200/JCO.2008.18.1370. [DOI] [PMC free article] [PubMed] [Google Scholar]
- Perou C.M., Sørlie T., Eisen M.B., van de Rijn M., Jeffrey S.S., Rees C.A., Pollack J.R., Ross D.T., Johnsen H., Akslen L.A. Molecular portraits of human breast tumours. Nature. 2000;406:747–752. doi: 10.1038/35021093. [DOI] [PubMed] [Google Scholar]
- Quail D.F., Joyce J.A. Microenvironmental regulation of tumor progression and metastasis. Nat. Med. 2013;19:1423–1437. doi: 10.1038/nm.3394. [DOI] [PMC free article] [PubMed] [Google Scholar]
- R Core Team (2016). R: A language and environment for statistical computing. R Foundation for Statistical Computing, Vienna, Austria. http://www.R-project.org/.
- Rakha E.A., Starczynski J., Lee A.H.S., Ellis I.O. The updated ASCO/CAP guideline recommendations for HER2 testing in the management of invasive breast cancer: a critical review of their implications for routine practice. Histopathology. 2014;64:609–615. doi: 10.1111/his.12357. [DOI] [PubMed] [Google Scholar]
- Ramos P., Bentires-Alj M. Mechanism-based cancer therapy: resistance to therapy, therapy for resistance. Oncogene. 2015;34:3617–3626. doi: 10.1038/onc.2014.314. [DOI] [PubMed] [Google Scholar]
- Rapsomaniki M.A., Lun X.K., Woerner S., Laumanns M., Bodenmiller B., Martínez M.R. CellCycleTRACER accounts for cell cycle and volume in mass cytometry data. Nat. Commun. 2018;9:632. doi: 10.1038/s41467-018-03005-5. [DOI] [PMC free article] [PubMed] [Google Scholar]
- Reinert T., Barrios C.H. Optimal management of hormone receptor positive metastatic breast cancer in 2016. Ther. Adv. Med. Oncol. 2015;7:304–320. doi: 10.1177/1758834015608993. [DOI] [PMC free article] [PubMed] [Google Scholar]
- Sade-Feldman M., Yizhak K., Bjorgaard S.L., Ray J.P., de Boer C.G., Jenkins R.W., Lieb D.J., Chen J.H., Frederick D.T., Barzily-Rokni M. Defining T Cell States Associated with Response to Checkpoint Immunotherapy in Melanoma. Cell. 2018;175:998–1013.e20. doi: 10.1016/j.cell.2018.10.038. [DOI] [PMC free article] [PubMed] [Google Scholar]
- Santagata S., Thakkar A., Ergonul A., Wang B., Woo T., Hu R., Harrell J.C., McNamara G., Schwede M., Culhane A.C. Taxonomy of breast cancer based on normal cell phenotype predicts outcome. J. Clin. Invest. 2014;124:859–870. doi: 10.1172/JCI70941. [DOI] [PMC free article] [PubMed] [Google Scholar]
- Schindelin J., Arganda-Carreras I., Frise E., Kaynig V., Longair M., Pietzsch T., Preibisch S., Rueden C., Saalfeld S., Schmid B. Fiji: An open-source platform for biological-image analysis. Nat. Methods. 2012;9 doi: 10.1038/nmeth.2019. 676–82. [DOI] [PMC free article] [PubMed] [Google Scholar]
- Shih K., Arkenau H.-T., Infante J.R. Clinical impact of checkpoint inhibitors as novel cancer therapies. Drugs. 2014;74:1993–2013. doi: 10.1007/s40265-014-0305-6. [DOI] [PMC free article] [PubMed] [Google Scholar]
- Sternlicht M.D., Barsky S.H. The myoepithelial defense: a host defense against cancer. Med. Hypotheses. 1997;48:37–46. doi: 10.1016/s0306-9877(97)90022-0. [DOI] [PubMed] [Google Scholar]
- Stingl J., Eaves C.J., Zandieh I., Emerman J.T. Characterization of bipotent mammary epithelial progenitor cells in normal adult human breast tissue. Breast Cancer Res. Treat. 2001;67:93–109. doi: 10.1023/a:1010615124301. [DOI] [PubMed] [Google Scholar]
- Straub R.H. The complex role of estrogens in inflammation. Endocr. Rev. 2007;28:521–574. doi: 10.1210/er.2007-0001. [DOI] [PubMed] [Google Scholar]
- Torre L.A., Islami F., Siegel R.L., Ward E.M., Jemal A. Global cancer in women: Burden and trends. Cancer Epidemiol. Biomarkers Prev. 2017;26:444–457. doi: 10.1158/1055-9965.EPI-16-0858. [DOI] [PubMed] [Google Scholar]
- Van Der Maaten L., Hinton G. Visualizing Data using t-SNE. J. Mach. Learn. Res. 2008;9:2579–2605. [Google Scholar]
- Vargas F.A., Furness A.J.S., Litchfield K., Joshi K., Rosenthal R., Ghorani E., Solomon I., Lesko M.H., Ruef N., Roddie C. Fc Effector Function Contributes to the Activity of Human Anti-CTLA-4 Antibodies. Cancer Cell. 2018 doi: 10.1016/j.ccell.2018.02.010. [DOI] [PMC free article] [PubMed] [Google Scholar]
- Visvader J.E., Stingl J. Mammary stem cells and the differentiation hierarchy: current status and perspectives. Genes Dev. 2014;28:1143–1158. doi: 10.1101/gad.242511.114. [DOI] [PMC free article] [PubMed] [Google Scholar]
- Weber L.M., Robinson M.D. Comparison of clustering methods for high-dimensional single-cell flow and mass cytometry data. Cytometry A. 2016;89:1084–1096. doi: 10.1002/cyto.a.23030. [DOI] [PubMed] [Google Scholar]
- Wein L., Luen S.J., Savas P., Salgado R., Loi S. Checkpoint blockade in the treatment of breast cancer: current status and future directions. Br. J. Cancer. 2018;119:4–11. doi: 10.1038/s41416-018-0126-6. [DOI] [PMC free article] [PubMed] [Google Scholar]
- Wherry E.J., Kurachi M. Molecular and cellular insights into T cell exhaustion. Nat. Rev. Immunol. 2015;15:486–499. doi: 10.1038/nri3862. [DOI] [PMC free article] [PubMed] [Google Scholar]
- Zunder E.R., Finck R., Behbehani G.K., Amir A.D., Krishnaswamy S., Gonzalez V.D., Lorang C.G., Bjornson Z., Spitzer M.H., Bodenmiller B. Palladium-based mass tag cell barcoding with a doublet-filtering scheme and single-cell deconvolution algorithm. Nat. Protoc. 2015;10:316–333. doi: 10.1038/nprot.2015.020. [DOI] [PMC free article] [PubMed] [Google Scholar]
Associated Data
This section collects any data citations, data availability statements, or supplementary materials included in this article.
Supplementary Materials
Data Availability Statement
The mass cytometry data (.fcs files) and immunofluorescence images generated in this study are deposited in Mendeley Data (https://doi.org/10.17632/gb83sywsjc.1).