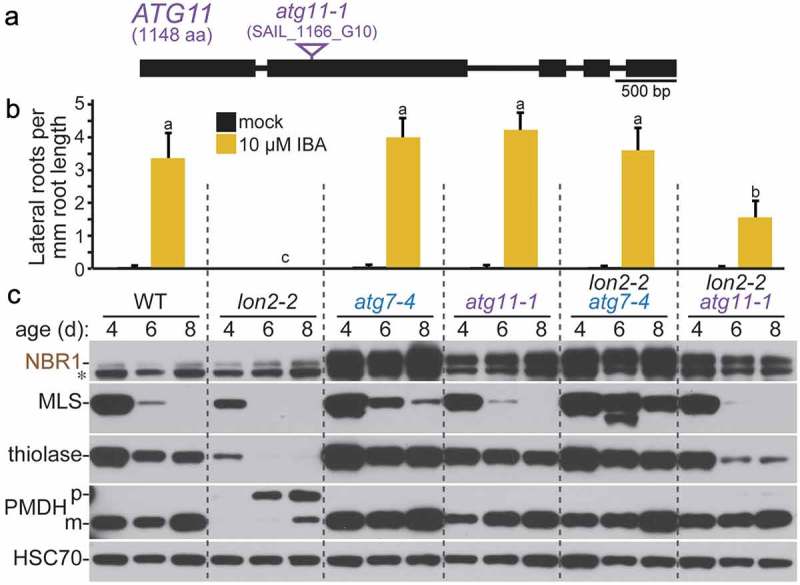
Figure 6.

Loss of ATG11 partially suppresses lon2 defects. (a) Diagram of the ATG11 gene. Boxes and lines represent protein-coding regions and introns, respectively. A triangle marks the location of the atg11-1 T-DNA insertion allele [17]. aa, amino acids. (b) Lateral root density of 8-day-old wild type (WT), lon2-2, atg7-4, atg11-1, lon2-2 atg7-4, and lon2-2 atg11-1 seedlings grown without or with IBA. Error bars show standard deviations (n = 8). Statistically significant (P < 0.0001) differences determined by one-way ANOVA are depicted by different letters above the bars. (c) Extracts from 4-, 6-, and 8-day-old seedlings were processed for immunoblotting with antibodies to the indicated proteins. An asterisk indicates a protein cross-reacting with the NBR1 antibody.
