

Abstract
In species with chromosomal sex determination, X chromosomes are predicted to evolve faster than autosomes because of positive selection on recessive alleles or weak purifying selection. We investigated X chromosome evolution in Stegodyphus spiders that differ in mating system, sex ratio, and population dynamics. We assigned scaffolds to X chromosomes and autosomes using a novel method based on flow cytometry of sperm cells and reduced representation sequencing. We estimated coding substitution patterns (dN/dS) in a subsocial outcrossing species (S. africanus) and its social inbreeding and female-biased sister species (S. mimosarum), and found evidence for faster-X evolution in both species. X chromosome-to-autosome diversity (piX/piA) ratios were estimated in multiple populations. The average piX/piA estimates of S. africanus (0.57 [95% CI: 0.55–0.60]) was lower than the neutral expectation of 0.75, consistent with more hitchhiking events on X-linked loci and/or a lower X chromosome mutation rate, and we provide evidence in support of both. The social species S. mimosarum has a significantly higher piX/piA ratio (0.72 [95% CI: 0.65–0.79]) in agreement with its female-biased sex ratio. Stegodyphus mimosarum also have different piX/piA estimates among populations, which we interpret as evidence for recurrent founder events. Simulations show that recurrent founder events are expected to decrease the piX/piA estimates in S. mimosarum, thus underestimating the true effect of female-biased sex ratios. Finally, we found lower synonymous divergence on X chromosomes in both species, and the male-to-female substitution ratio to be higher than 1, indicating a higher mutation rate in males.
Keywords: sex chromosome, social spider, faster-X, female bias
Introduction
In many species with chromosomal sex determination systems, males are hemizygous for the sex chromosomes and loci harbored on sex chromosomes may therefore evolve faster than similar loci on the autosomes, an effect termed “faster-X.” Faster-X is caused by an elevated nonsynonymous substitution rate on the X chromosome if 1) new advantageous mutations are, on average, at least partially recessive, because recessive alleles are exposed to selection in the hemizygous state; and/or 2) if selection is less efficient against deleterious mutations on X chromosomes because of the smaller effective population size of the X chromosomes compared with the autosomes (Charlesworth et al. 1987; Vicoso and Charlesworth 2006; Hedrick 2007; Ellegren 2009; Wright et al. 2015). Empirical data provide conflicting conclusions on the existence and generality of “faster-X” evolution of X chromosomes (see supplementary table 1, Supplementary Material online). For example, consistent evidence of faster-X evolution comes from studies on mammals (Lu and Wu 2005; Torgerson and Singh 2006; Carneiro et al. 2012; Hvilsom et al. 2012; Xu et al. 2012) and birds (faster-Z) (Mank et al. 2007, 2010; Wright et al. 2015). Conversely, in Drosophilids a number of studies provide inconsistent evidence for faster-X (Betancourt et al. 2002; Counterman et al. 2004; Thornton et al. 2006; Hu et al. 2013), potentially due to low power (Charlesworth et al. 2018), and the same is true for the few other insect species studied (Jaquiery et al. 2012, 2018; Sackton et al. 2014; Rousselle et al. 2016). Different explanations proposed for this inconsistency includes both selective and ecological forces. A useful approach to study the forces causing variation in the evolution of X chromosomes is the study of closely related species that differ in traits predicted to affect X chromosome to autosome (X/A) divergence. For example, differences in life history traits and mating system, such as age at sexual maturity and polyandry, are proposed to underlie differences in X/A divergence of silent and coding sites among four primate species (Xu et al. 2012), but the number of such comparative studies are still very limited.
Populations always carry fewer X chromosomes than autosomes, and under the neutral expectation this leads to relatively fewer recombination events and higher rates of drift, which in turn decreases nucleotide diversity on X-chromosomes (Ellegren 2009; Ellegren and Galtier 2016). Based solely on the relative numbers of X chromosomes to autosomes in species with equal sex ratio, the diversity of the X chromosome is predicted to be 0.75 of that of the autosomes (Ellegren 2009). However, because the relative diversity of X chromosomes to autosomes (piX/piA) is influenced by different evolutionary forces including different mutation rates on X chromosomes and autosomes, population size fluctuations, breeding system, and recombination rate, piX/piA may deviate from 0.75 (Ellegren 2009). Disentangling the relative influence of these forces on the diversity on X chromosomes versus autosomes is important for our understanding of how molecular evolution shapes genomes (Charlesworth et al. 1987; Miyata et al. 1987; Ellegren 2007, 2009; Pool and Nielsen 2007, 2008). Deviation from the null expectation of X chromosome diversity of 0.75 of autosomal diversity is often used to infer evolutionary history. For example, piX/piA estimates of <0.75 in non-African populations of both humans and Drosophila were interpreted to be caused by founder events associated with “out of Africa” dispersal (Pool et al. 2012; Arbiza et al. 2014). In Drosophila, different sex ratios in African (unbiased) and European (male biased) populations were inferred by contrasting polymorphism data from X chromosomes and autosomes (Hutter et al. 2007).
Comparisons of closely related species have proven useful for elucidating genetic consequences of biological differences, because of their recently shared evolutionary history (Cutter et al. 2008; Guo et al. 2009; Settepani et al. 2017). Here, we present a study of two sister species with contrasting mating systems from the spider genus Stegodyphus: the subsocial outcrossing species S. africanus and its social inbreeding sister species S. mimosarum, with the subsocial outcrossing S. lineatus as an outgroup (fig. 1) (Johannesen et al. 2007; Settepani et al. 2016). The aim is to investigate how differences in biology and mating system may influence the evolution of autosomes and sex chromosomes. Stegodyphus spiders have an X0 sex determining system, where females have two copies of two X chromosomes (X1X2/X1X2) and males have one copy of the two X chromosomes (X1X2/0) (Forman M, personal communication). Differences in their degree of sociality and mating system, and associated life histories and population dynamics, are expected to influence substitution and diversity patterns of X chromosomes and autosomes differently: The subsocial outbreeding S. africanus has an equal primary sex ratio (Vanthournout et al. 2018), and populations are expected to be relatively stable in sizes and existence over evolutionary time (Lubin and Bilde 2007; Settepani et al. 2017). In contrast, the social obligatory inbreeding S. mimosarum shows a highly female-biased primary sex ratio (Lubin and Bilde 2007), caused by male production of a higher proportion of X1X2-containing sperm cells than sperm cells without X chromosomes (Vanthournout et al. 2018). Furthermore, empirical data suggest that population extinction rates in social Stegodyphus species such as S. mimosarum are high (Crouch and Lubin 2001; Bilde et al. 2007), implying a high rate of population colonization (Bilde et al. 2007), a pattern supported by recent population genomic analyses (Settepani et al. 2017). Differences in sex ratio influence the relative effective population sizes of X chromosomes and autosomes. If sex ratio is female biased, as in the social S. mimosarum, the effective population size of X chromosomes approaches that of autosomes, predicting similar evolutionary dynamics on X and A. This effect will be counter-acted if the operational sex ratio is less female biased because of female reproductive skew and cooperative breeding (Lubin and Bilde 2007; Salomon and Lubin 2007; Junghanns et al. 2017). Population size fluctuation is also an important factor, as population size reduction is predicted to more rapidly reduce X chromosome diversity relative to autosome diversity, while population growth is predicted to more rapidly elevate X chromosome diversity relative to autosome diversity. This is because population fluctuations influence effective population sizes of X chromosomes and autosomes differently, for example, NeX will experience a relatively faster decline than NeA under a population reduction (bottleneck) (Pool and Nielsen 2007).
Fig. 1.

Study system. (a) Phylogeny of the spider genus Stegodyphus (modified after Settepani et al. 2016). Social species are underlined, and the species included in this study are boxed in gray. (b) Geographic location of sampled S. mimosarum populations (MAH, SAK, TANA, WEE, PON) and of S. africanus populations (WRF, PON, KRU).
We developed a new, cost-effective, and highly efficient approach to sort scaffolds from the S. mimosarum genome sequence (Sanggaard et al. 2014) into X chromosomes and autosomes using a combination of flow cytometry and reduced representation (RAD) sequencing. Subsequently, we applied transcriptome sequencing to generate estimates of X chromosome and autosome substitution patterns (dN/dS), and RAD sequencing to determine genetic diversity (pi) of X chromosomes and autosomes. With this data, we assessed theoretical predictions of how differences in sex ratio and population size dynamics affect X chromosome relative to autosome evolution in two closely related Stegodyphus species (S. africanus and S. mimosarum) (fig. 1).
Results
Assigning Scaffolds to the X Chromosome
We were able to isolate the nuclei from sperm cells extracted from an S. mimosarum male pedipalp, and separate the nuclei with and without X chromosomes using flow cytometry. Using RAD sequencing of the nuclei, we obtained more than 1 million reads after quality filtering from each sample that were subsequently mapped to the reference genome of S. mimosarum. Figure 2 shows a density distribution of the number of reads from the sample without X chromosomes (“Sample 0”) divided by the total number of reads from both samples (“Sample 0 + Sample X1X2”) mapped to each scaffold (see Materials and Methods for details). The distribution is bimodal (fig. 2 and supplementary fig. 1, Supplementary Material online). The major peak close to P0 = 0.5 shows that most scaffolds have a similar coverage in “Sample 0” and “Sample X1X2,” while the minor peak around P0 = 0.119 constitutes scaffolds with much lower coverage in “Sample 0” compared with “Sample X1X2,” suggesting that they are placed on the X chromosomes. We used a threshold of P0 < 0.238 to select scaffolds that we assign to the X chromosomes and P0 > 0.3 as a threshold for a scaffold to be considered autosomal, with both thresholds corresponding to a FDR of 2.5% (supplementary fig. 1 and table 2, Supplementary Material online). In this way, we obtained 450 X chromosome scaffolds for downstream analyses (a list assigning scaffolds to X chromosome and autosome scaffolds can be found in supplementary table 3, Supplementary Material online).
Fig. 2.

Schematic presentation of study design including assignment of scaffolds to X or autosomes. Stegodyphus species, like most spiders, have an X0 sex determination system, where males have only one copy of the sex chromosomes. Sperm cells were sorted into two pools using flow cytometry: one with the sex chromosomes (“Sample X1X2”) and one without the sex chromosomes (“Sample 0”), and RAD sequencing libraries from each pool were subsequently constructed and sequenced. The resulting RAD sequences from each pool were mapped to the scaffold sequences of the S. mimosarum genome (Sanggaard et al. 2014). Scaffolds comprising the sex chromosomes were determined as the scaffolds with no sequences (or few) mapping from the “Sample 0” pool, but with sequences mapping from the “Sample X1X2” pool. For each scaffold, we estimated a summary statistic (P0) defined as the number of reads that mapped from “Sample 0” divided by the sum of reads that mapped from both “Sample 0” and “Sample X1X2” after normalization of the total number of reads from both samples. Scaffolds belonging to X chromosomes are predicted to have P0 close to 0, while those belonging to autosomes are predicted to have P0 close to 0.5.
Characterizing the X chromosome scaffolds using the S. mimosarum reference genome, we found 2,132 X-linked genes across 246.7 Mb or one gene per 115,725 bp (8.64 genes per Mb) compared with an average autosomal gene density of one gene per 103,622 bp (9.65 genes per Mb). The average gene length of the reference genome is 32,170 bp, while genes on X chromosome scaffolds are on average 42,638 bp long (see supplementary table 4, Supplementary Material online, for further summary statistics). We used flow cytometry data from Vanthournout et al. (2018) to estimate the proportion of the genome made up by the X chromosomes. In S. africanus, we estimate that the X chromosomes make up 15.3% (SD: 0.009) of the total genome, and in S. mimosarum it is 15.1% (SD: 0.012). We note that the identified X chromosome scaffolds make up ∼9% of the genome whereas flow cytometry indicates the X chromosomes make up 15% of the genome. Approximately half of the remaining 6% were not assigned due to too low coverage from the RAD sequencing of the nuclei, while the other half are likely to have a P0 above the threshold of 0.238 (supplementary fig. 1, Supplementary Material online). We found no differences in codon usage bias (Supek and Vlahovicek 2004) among genes located on X chromosomes and autosomes in any of the two species (supplementary fig. 2, Supplementary Material online).
Substitution Patterns of Autosomes
After processing the transcriptome sequence data, we obtained consensus sequences of 4,641 putative orthologous loci (including 523 on the X chromosomes) from all three Stegodyphus species, and aligned these for comparative studies. We used PAML ver. 4.6 (Yang 2007) to estimate species-specific dN/dS ratios of S. mimosarum and S. africanus using S. lineatus as outgroup for X chromosomes and autosomes separately. The autosomal dN/dS ratio of the social S. mimosarum was significantly larger than for S. africanus (0.131 vs. 0.114; randomization test: P = 0.004; fig. 3 and table 1), suggesting stronger purifying selection in the outcrossing S. africanus compared with the inbreeding S. mimosarum. This is consistent with the estimate of a 10-fold higher effective population size in the outcrossing S. africanus than the inbreeding S. mimosarum (Settepani et al. 2017), and stronger effect of selection in populations with larger effective size to remove slightly deleterious mutations (Charlesworth 2009). A list of genes assigned to X chromosome and autosome scaffolds can be found in supplementary table 5, Supplementary Material online.
Fig. 3.

dN/dS estimates for X chromosomes and autosomes separately from Stegodyphus africanus and S. mimosarum based on consensus sequences of transcriptome data. Error bars represent 95% confidence limits obtained by bootstrapping. P values were estimated by randomization tests. *<0.05, **<0.01.
Table 1.
dN and dS Estimates for Loci Located on the X Chromosomes and Autosome Scaffolds for Stegodyphus africanus and S. mimosarum.
| dN (CI95low−CI95high) | dS (CI95low−CI95high) | dN/dS (CI95low−CI95high) | |
|---|---|---|---|
| S. mimosarum | |||
| Autosomes | 0.0012 (0.0012–0.0013) | 0.0093 (0.0090–0.0096) | 0.131 (0.125–0.137) |
| X chromosomes | 0.0010 (0.0009–0.0012) | 0.0059 (0.0052–0.0065) | 0.177 (0.152–0.208) |
| S. africanus | |||
| Autosomes | 0.0010 (0.0009–0.0010) | 0.0083 (0.0080–0.0086) | 0.114 (0.108–0.121) |
| X chromosomes | 0.0008 (0.0007–0.0010) | 0.0060 (0.0054–0.0066) | 0.140 (0.120–0.164) |
Note.—Stegodyphus lineatus was used as outgroup. In parenthesis are 95% confidence limits that are obtained by bootstrapping.
Substitution Patterns of X Chromosome versus Autosome
The X-linked dN/dS ratios were 0.140 in S. africanus and 0.177 in S. mimosarum, and significantly larger than the autosomal dN/dS ratios of 0.114 in S. africanus and 0.131 in S. mimosarum (randomization tests: P = 0.018 and P = 0.004, fig. 3 and table 1). In both species, we found a significantly lower synonymous substitution rate on the X-linked genes (dSX) compared with autosomal genes (dSA) (for S. africanus dSX/dSA = 0.72; randomization test: P < 0.001; for S. mimosarum dSX/dSA = 0.63; randomization test: P < 0.001, table 1).
Genetic Diversity on X Chromosomes and Autosomes
From RAD sequencing, we obtained 24,321 RAD loci (3,440 X-linked) from the outcrossing S. africanus and 20,665 RAD loci (2,783 X-linked) from the inbreeding S. mimosarum. Using the S. mimosarum reference genome (Sanggaard et al. 2014) we found that 1.16% of the RAD loci are located in protein coding regions. We estimated total diversity in three S. africanus and five S. mimosarum populations, and found that all S. mimosarum populations have reduced diversity on both X chromosomes and autosomes compared with S. africanus (both reduced by ∼85%) (fig. 4). We note that the diversity estimates presented here are highly similar to those obtained by Settepani et al. (2017) who analyzed the same RAD sequence data using a different pipeline. Variation in diversity across scaffolds may reflect different rates of loss of diversity, which is in accordance with linked selection playing a predominant role in loss of diversity. In S. mimosarum, on average 56% of the autosome scaffolds and 61% of the X-linked scaffolds had a diversity of 0 (supplementary fig. 3, Supplementary Material online), preventing us from meaningful inference of the variation in loss of diversity across scaffolds, as the variation among these 0-diversity scaffolds is lost due to the zero boundary. This was not the case for S. africanus, where only 3% and 9% of autosome and X-linked scaffolds, respectively, had diversity estimates of 0 (supplementary fig. 3, Supplementary Material online), and we therefore contrasted variation in diversity across X chromosome scaffolds to autosome scaffolds by the coefficient of variation (CV). We find that diversity varies significantly more among X-linked scaffolds than among autosome scaffolds consistent with a stronger role for natural selection in removing diversity in regions of the X chromosome than on the autosomes, by either selective sweeps or background selection (fig. 5). Estimates of piX/piA are more or less constant among subsocial S. africanus populations, but varies significantly among social S. mimosarum populations (S. africanus: F2,99 = 0.003; P = 0.99, S. mimosarum: F4,146 = 4.63; P < 0.01) (fig. 6). Averaged across populations, the X to autosome diversity ratio (piX/piA) is 0.57 (95% CI: 0.55–0.60) for S. africanus, which is lower than the 0.75 expected with an equal contribution of the two sexes. piX/piA of S. mimosarum, 0.72 (95% CI: 0.65–0.79), was not significantly different from the 0.75 expected, but significantly higher than in S. africanus (χ2(1) = 4.25; P = 0.04) (fig. 6).
Fig. 4.

Genetic diversity estimated from RAD data for X chromosomes (X) and autosomes (A) from three populations of Stegodyphus africanus (WRF, PON and KRU) and five populations of S. mimosarum (MAH, SAK, TANA, WEE and PON). We used data from between 5 and 10 individuals per loci from each population depending on coverage. Error bars represent 95% confidence limits obtained by bootstrapping.
Fig. 5.
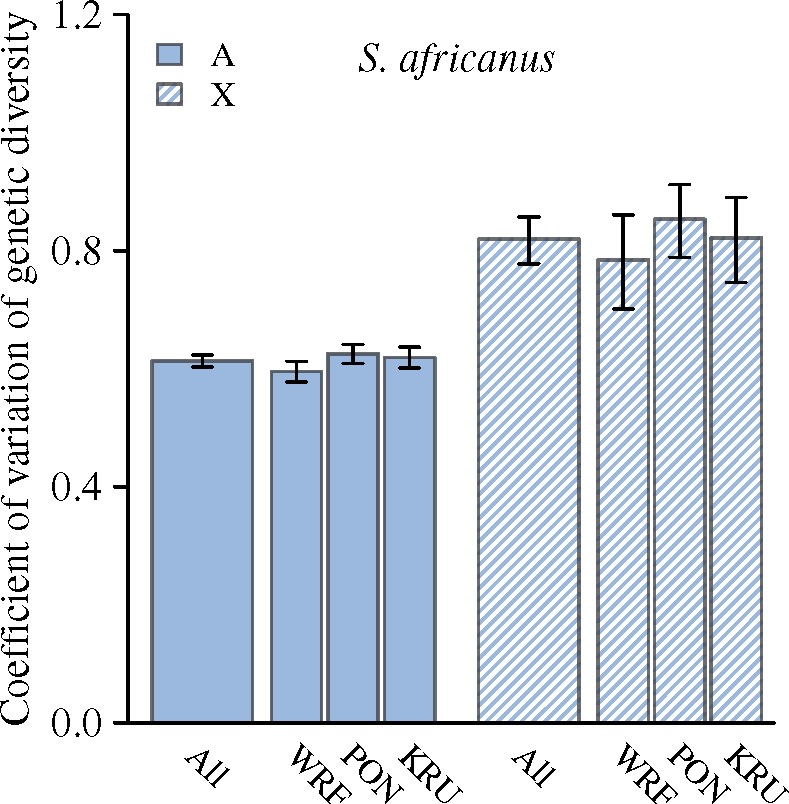
Comparison of the coefficient of variation (CV) of genetic diversity among scaffolds assigned to the X chromosomes and autosomes. Only in Stegodyphus africanus, was genetic diversity sufficiently large to allow this comparison. WRF, PON and KRU represent the three sampled S. africanus populations, while ALL is the average per species. CVs were estimated as SD/average. Error bars represent 95% confidence limits obtained by bootstrapping.
Fig. 6.

Ratios of X chromosome to autosome genetic diversity (piX/piA) based on pi estimates presented in figure 5. Estimates are presented for three populations of Stegodyphus africanus (WRF, PON and KRU) and five populations of S. mimosarum (MAH, SAK, TANA, WEE and PON), as well as the species average (ALL). Significant differences (indicated by different letters) between populations within each species were investigated using F-tests and Tukey’s HSD method for post hoc comparisons. Error bars represent 95% confidence limits obtained by bootstrapping.
Population size fluctuations reduces effective population size on X chromosomes relatively more than on autosomes (Pool and Nielsen 2007, 2008; Schou et al. 2017). Populations of social spiders such as S. mimosarum undergo recurrent population size fluctuations due to propagule dispersal of single-mated females and high-population turnover rates (Bilde et al. 2007; Settepani et al. 2014, 2017). Population size fluctuations can therefore potentially explain the fluctuating piX/piA among S. mimosarum populations. We used simulations to quantitatively investigate the effects of recurrent population size fluctuations on piX/piA using fastsimcoal2 (Excoffier et al. 2013). We found that recurrent population size fluctuations with realistic parameters for S. mimosarum can significantly reduce piX/piA (supplementary fig. 4, Supplementary Material online). piX/piA is influenced more by few founders (5 chromosomes vs. 50 chromosomes) and to a lesser extent by slower growth after a founder event (100 generations vs. 50 generations between founder events).
A McDonald–Kreitman test was performed using polymorphisms from the S. mimosarum RAD loci located in protein coding genes and divergences from the transcriptome sequences. In total, we identified 150 synonymous and 140 nonsynonymous polymorphisms at the X chromosomes and 1,433 synonymous and 1,198 nonsynonymous polymorphisms at the autosomes. In the S. mimosarum lineage, we identified 563 synonymous and 337 nonsynonymous substitutions at the X chromosomes and 15,599 synonymous and 7,370 nonsynonymous substitutions at the autosomes. Alpha estimates were estimated to be negative for both X chromosomes and autosomes (−0.56 and −0.77, respectively), suggesting that many nonsynonymous mutations are segregating likely because they are slightly deleterious.
X Chromosome Substitution Rates and Sex-Biased Mutation Rates
We find that the synonymous divergence of X chromosomes is lower than for autosomes in both species estimated from transcriptome data (dSX/dSA 0.72 in S. africanus and 0.63 in S. mimosarum; table 1). This divergence ratio does not account for differences in coalescence times of X chromosomes and autosomes caused by differences in effective population size in the ancestor of S. africanus and S. mimosarum. Since the effective population size of X chromosomes is smaller than that of autosomes, the X chromosomes are expected to coalesce faster than autosomes in the ancestral species. The difference in synonymous divergence estimates of X chromosomes and autosomes is therefore not solely due to different mutation rates, but also different times to accumulate substitutions. To correct for different coalescence times in the ancestral species, we assumed an ancestral population size (NA) of 300,000 (Settepani et al. 2017), a sex ratio of 1:1, and species split time of 1 My (using the mutation rate from Mattila et al. 2012). Under these assumptions, the predicted time to coalescence of X chromosomes is 85% of that of the autosomes (see supplementary fig. 5, Supplementary Material online). Based on the adjusted dSX/dSA divergence ratio from transcriptome data (S. africanus: 0.85, S. mimosarum: 0.74), we estimate the male-to-female substitution ratio (α) (Miyata et al. 1987) to 2.6 in S. africanus and 8.1 in S. mimosarum. In addition, we calculated a synonymous divergence ratio based on RAD data (dRADX/dRADA) in S. mimosarum, taking advantage of the fact that the Madagascan and South African populations are genetically isolated from each other. The estimated dRADX/dRADA divergence ratio is 0.85, and 0.89 when adjusting for different coalescence times in the ancestral population (supplementary fig. 5, Supplementary Material online). Using the adjusted dRADX/dRADA divergence ratio, we get an α estimate of 1.98.
Discussion
The method used to identify X-linked scaffolds in this study is applicable for species with X0 or heterogametic sex determination, where X chromosomes are sufficiently large for sperm cells with and without the X chromosomes to be separated using flow cytometry. Large full-genome sequencing initiatives to sequence 5,000 insect and insect-related genomes (i5K) (Evans et al. 2013), and the Global Invertebrate Genomics Alliance (GIGA) (Bracken-Grissom et al. 2014) can directly benefit from our approach and allow a large number of sex chromosome systems to be investigated in order to disentangle hypotheses regarding their involvement in meiotic drive (Jaenike 2001; Unckless et al. 2015), sexual conflict (Andres and Morrow 2003; Mank et al. 2014), and speciation (Presgraves 2008; Kitano et al. 2009).
Faster-X Evolution in S. mimosarum and S. africanus
We found evidence for faster-X evolution in both S. mimosarum and S. africanus, providing the first case of faster-X evolution in spiders (see supplementary table 1, Supplementary Material online, for a survey of previous faster-X investigations) (Garrigan et al. 2014; Kousathanas et al. 2014; Sackton et al. 2014). Faster-X can be caused by drift or adaptive substitutions at the X chromosomes. To test if faster-X is caused by adaptive evolution, we used transcriptome data and RAD sequences located in exons to estimate the proportion of substitutions that are fixed by adaptive evolution using the McDonald–Kreitman test (McDonald and Kreitman 1991). Negative α values were obtained for both X chromosomes and autosomes, suggesting that slightly deleterious mutations segregate. We can therefore not conclude from this analysis to which extent faster-X is caused by drift or adaptive evolution. Estimating the proportion of adaptive substitution in the presence of segregating slightly deleterious mutations would require targeted sequencing of protein coding loci in multiple individuals (Eyre-Walker and Keightley 2009). Two other observations from our data are however informative and consistent with adaptive evolution contributing to faster-X in this system. The effective population size of S. mimosarum was reduced by ∼90% during the evolution of social behavior (Settepani et al. 2017). Such an increase in genetic drift has caused an increase in autosomal dN/dS of only 15% (0.131 vs. 0.114). In comparison, a much lower difference in effective population size of X chromosomes and autosomes is associated with substantial increase in dN/dS of 35% (0.177 vs. 0.131) in S. mimosarum and 22% (0.140 vs. 0.114) in S. africanus, supporting that the increase in dN/dS of X chromosomes is not only caused by genetic drift. Adaptive evolution is further supported by the finding that diversity along the X chromosomes varies more than along the autosomes in S. africanus, suggesting that selective sweeps are more prominent on the X chromosomes, a phenomenon also observed in primates (Nam et al. 2017). Finally, in support of a prominent role of drift causing faster-X, we find NeX/NeA < 0.75 in S. africanus (as estimated by piX/piA). However, if the difference in diversity on X (piX) and A (piA) is caused by a lower mutation rate at the X chromosomes and not drift, this is unlikely to have an effect on adaptive substitutions (Vicoso and Charlesworth 2009). Indeed our data suggests a lower X chromosome mutation rate (see X Chromosome Mutation Rate below), and the effects of genetic drift on dN/dS may not be as strong as suggested by the deviation of NeX/NeA from 0.75.
An alternative and nonexclusive explanation of faster-X is a lower recombination rate of X chromosomes compared with autosomes, arising as X chromosomes unlike autosomes only recombine in females. A reduced recombination rate on X chromosomes is predicted to increase the effect of linked selection, which would increase dN/dS due to fixation of slightly deleterious mutations. This should produce a negative correlation between recombination rate and rate of nonsynonymous substitutions, as reported in, for example, Drosophila (Assis et al. 2012).
The potential for “faster-X” evolution depends on the difference between the effective population sizes of X chromosomes (NeX) and autosomes (NeA). In species with a female-biased sex ratio as observed in S. mimosarum, the difference between NeX and NeA is expected to be lower compared with species with equal sex ratio. Such a scenario provides a wider range of dominance levels where beneficial mutations at the X chromosomes are more rapidly fixed (Vicoso and Charlesworth 2009), making species with biased sex ratio more prone to “faster-X” evolution. However, according to our diversity estimates of X chromosomes and autosomes, we do not find support for intensified faster-X in S. mimosarum relative to S. africanus (S. mimosarum, X(dN/dS)/A(dN/dS): 1.35, S. africanus, X(dN/dS)/A(dN/dS): 1.22; P = 0.92). As S. mimosarum was used for assignment of scaffolds to X chromosomes or autosomes, usage of the same assignment in S. africanus and thereby the species comparisons made above, relies on no independent rearrangements occurring between X chromosomes and autosomes. Cytogenetic analyses of S. mimosarum and S. africanus have shown that the X chromosomes appear highly similar (Forman M, personal communication), supporting the assumption that no major X chromosome rearrangements occurred since the species split.
Genetic Diversity on X Chromosomes and Autosomes
Our previous studies showed that the social species has a much smaller effective population size and a high rate of population turnover (Settepani et al. 2014, 2017). In agreement with this, we observed considerably higher genetic diversity in S. africanus along with a lower dN/dS ratio suggesting that purifying selection is more efficient in the outbreeding species.
The finding of an X to autosome diversity ratio (piX/piA) in S. africanus lower than the expectation of 0.75 (no sex ratio bias) suggests that additional evolutionary forces, such as differences in mutation rates and/or selection may reduce diversity on X chromosomes at a higher rate than on autosomes. Mutation rate on the X chromosomes was inferred to be lower than on the autosomes, which at least partly explains the low piX/piA in S. africanus. Selection is known to cause loss of genetic diversity not only in the selected loci but also in flanking regions due to genetic hitchhiking (Smith and Haigh 1974; Begun and Aquadro 1992) and background selection (Charlesworth 2012). The effect of removing diversity by linked selection is predicted to be larger in genomic regions where recombination rates are small, as for X chromosomes that do not recombine in males. The finding of lower diversity on X chromosomes may therefore partly be due to selection. Exposure of recessive variants on X chromosomes to selection in males may enforce this effect, however, the lower effective population size of the X chromosomes may cause selection to be less efficient on X chromosome loci, potentially reducing this effect. The social S. mimosarum has a primary female-biased sex ratio (Lubin and Bilde 2007; Vanthournout et al. 2018), so a higher piX/piA is expected compared with the subsocial S. africanus if the operational sex ratio is also female biased (Ellegren 2009). In agreement with this expectation, piX/piA in S. mimosarum was higher than in S. africanus. We propose that this is due to similar evolutionary forces as discussed for S. africanus, which decrease piX/piA, and the additional effect of female bias that increases piX/piA.
Social spiders are cooperative breeders with reproductive skew so only a fraction of females reproduce (Lubin and Bilde 2007; Junghanns et al. 2017), but it is currently unclear how large a proportion of females that reproduce, and therefore what the operational sex ratio is. With everything else equal, using the difference in piX/piA between the two species makes it possible to estimate the operational sex ratio. The point estimate of piX/piA (0.72) is consistent with an operational female bias between 1:8 and 1:9, and the lower boundary of the confidence limits suggests that the operational female bias is stronger than 1:2 (fig. 7). However, previous studies suggest that the population sizes of social species fluctuate substantially due to recurrent founder events associated with population extinction/recolonization dynamics (Crouch and Lubin 2001; Bilde et al. 2007; Settepani et al. 2017). Population size fluctuations affect diversity on X chromosomes more than diversity on autosomes, and therefore also the piX/piA ratio due to the Pool–Nielsen effect (Pool and Nielsen 2007). We simulated recurrent founder events and showed that piX/piA values constantly lower than equilibrium (estimated by simulating a constant population size) can be reached when founder events are frequent. Depending on the stage in the Pool–Nielsen cycle following a founder event at which the dynamic equilibrium is modeled, population dynamics with recurrent founder events would explain the variation observed in piX/piA among the S. mimosarum populations. The actual effect of female bias on piX/piA may therefore be larger than we observed due to a possible counteracting effect of population size fluctuations, and consequently the operational sex ratio even more female biased (supplementary fig. 6, Supplementary Material online).
Fig. 7.

Theoretically expected piX/piA as a function of male to female sex ratio (black dots). The expected piX/piA is standardized according to the finding that Stegodyphus africanus has a lower piX/piA than the expected 0.75, which we infer to be caused by a lower X chromosome mutation rate and the effect of linked selection, and assume to have a similar effect in S. mimosarum. Point estimates of piX/piA for the two species are depicted with dotted lines, and for S. mimosarum, the 95% confidence limits of this estimate are shown.
X Chromosome Mutation Rate
We found lower synonymous divergence on X chromosomes compared with autosomes suggesting a lower mutation rate on X than for the autosomes in both species. Importantly, this finding persisted when taking differences in coalescence time of X chromosomes and autosomes in the ancestral species into account. A lower mutation rate on X chromosomes can have several causes. One possibility is that the mutation rate is lower on the X chromosomes simply due to different sequence composition of the X chromosomes and autosomes. However, to our knowledge there is no evidence from previous studies that this is a plausible explanation. Another possible cause is a lower recombination rate of X chromosomes, which only recombine in females, than of autosomes which recombine in both sexes. Since recombination can be a source of mutations (Arbeithuber et al. 2015), the mutation rate on X chromosomes is expected to be lower than on autosomes, but the overall effect is not expected to be very high due to the relatively low number of recombination events on the X-chromosome per generation. Another possibility is that mutations are male-biased. Since X chromosomes spend 1/3 of their time in males and 2/3 in females, a male-biased mutation rate will cause a lower mutation rate at X chromosome compared with autosomes. A male-biased mutation rate has been found in several vertebrate species, and has been interpreted to be due to more cell divisions in spermatogenesis than in oogenesis. However, in short lived species like spiders and other invertebrates, the number of cell divisions in spermatogenesis and oogenesis is often similar, like in, for example, Drosophila (Drost and Lee 1998). Recent evidence mainly from humans suggests an alternative cause of a male-biased mutation rate, namely that mutation rate simply is higher in spermatogenesis than in oogenesis. No evidence for such an effect in spiders exists, but as we find none of the aforementioned explanations to be convincing, we suggest this alternative as a possibility.
Conclusions
This first analysis of DNA sequence evolution of X chromosomes in spiders reveals faster-X evolution in two sister-species that differ in mating systems, population dynamics and sex ratio bias. The extent of faster-X evolution is similar in the two species, contrary to theoretical predictions when sex ratios diverge from 50% to 50%. Contrasting the relative genetic diversity on X chromosomes and autosomes in a social inbreeding and a subsocial outcrossing species revealed higher piX/piA, and larger variation of piX/piA among populations in the social inbreeding species. These findings are consistent with the effects of female bias and Pool–Nielsen effects caused by frequent population size fluctuations in the social inbreeding S. mimosarum. Finally, we infer that the X chromosome mutation rate is lower than the autosome mutation rate in both species, potentially caused by a higher mutation rate in spermatogenesis than in oogenesis.
Materials and Methods
Study System
The spider genus Stegodyphus (family Eresidae) contains more than 20 species. Three of the species have an independently derived social behavior (fig. 1) (Johannesen et al. 2007; Settepani et al. 2016), which is consistently associated with a female-biased sex ratio, reproductive skew and an inbreeding mating system, also named the “social syndrome” (Lubin and Bilde 2007). Family groups of social species live and breed in closed nests that propagate within populations by nest fission and by long distance dispersal through ballooning of mated females (Lubin and Bilde 2007). In comparison, the subsocial species have equal sex ratios, no reproductive skew and are outcrossing (Bilde et al. 2005; Lubin and Bilde 2007).
Data Sets
RAD Sequence Data of Sperm Cells
To allocate reference scaffolds to an autosome or an X chromosome, we used flow cytometry (Garner et al. 2013) to sort free nuclei from S. mimosarum sperm cells, and subsequently RAD sequencing the DNA (fig. 2). Free nuclei from sperm cells were obtained by trypsin treatment and their DNA was stained with propidium iodide (Vindelov et al. 1983; Aron et al. 2003; Vanthournout et al. 2014). The nuclei were sorted based on DNA content into on a BD Biosciences FACSAria cell sorter (Argon laser emitting at 488 nm), into a sample with the two X chromosomes (“Sample X1X2”) and one without the two X chromosomes (“Sample 0”). From each of the two samples, paired-end RAD sequencing libraries were constructed using the protocol described in (Poland et al. 2012), with the following modifications: 0.5 µl of BSA was added to the Restriction Mastermix and an AMPure Beads clean-up and size selection step was implemented after PCR amplification. The libraries were sequenced using the Illumina HiSeq 2000 platform (100 bp paired-end).
Transcriptome Sequence Data
To enable inference of the coding substitution patterns between S. africanus and S. mimosarum, we obtained transcriptomes of the two species as well as an outgroup species (S. lineatus). Libraries of an S. lineatus and an S. africanus female were constructed using Illumina’s TruSeq Stranded mRNA LT Sample Prep Kit, and sequenced on an Illumina HiSeq2000 platform (100 bp paired-end). For S. mimosarum, quality filtered transcriptome data, also sequenced on an Illumina HiSeq 2000 platform (100 bp paired-end), from a previous study was used (Sanggaard et al. 2014).
RAD Sequence Data of Populations
To estimate molecular diversity of autosomes and X chromosomes in S. mimosarum and S. africanus, we used quality filtered RAD sequenced reads (100 bp paired-end) from a previously published study (Settepani et al. 2017). This data set contained individual data from 49 S. mimosarum females (each sampled from its own distinct nest) and 27 S. africanus females, with an average of 3.6 million clean reads per individual. The S. mimosarum females were sampled from five populations (fig. 1); ten from each of four populations (MAH, SAK, TANA, WEE) and nine from one population (PON). Three of the S. mimosarum populations are located in Madagascar (MAH, SAK, TANA) and two in South Africa (WEE, PON). The S. africanus females were sampled from three South African populations (WRF, PON, KRU) (fig. 1), with eight, ten, and nine, respectively).
Data Analyses
Identifying Scaffolds from the X Chromosomes
The RAD sequence reads from the sorted sperm cells were quality trimmed using the FASTX toolkit (http://hannonlab.cshl.edu/fastx_toolkit). We discarded reads containing a base with a Phred quality score <10, as well as reads with an average Phred quality score <30. More clean reads were obtained from “Sample 0” than “Sample X1X2,” and it was therefore subsampled to obtain same number of reads from both samples (1,034,261 reads). The clean data from the two samples (“Sample 0” and “Sample X1X2”) were mapped separately to the reference genome sequence of S. mimosarum (Sanggaard et al. 2014), using CLC Genomics Workbench 7 (default parameters). The reference genome consists of ∼23,000 scaffolds (N50 = 480,636 bp) and 45,000 contigs (N50 = 17,272 bp). Scaffolds for which at least 100 reads from “Sample X1X2” mapped (3,490 in total), was considered to have a potential X chromosome origin. The number of reads mapped from “Sample 0” was hereafter divided by the sum of the corrected number of reads mapped from “Sample 0” and “Sample X1X2.” We call this proportion P0.
Given a high-quality sorting of nuclei, we expect a bimodal distribution of P0. One mode will contain the distribution for the scaffolds belonging to the X chromosomes and the other will contain the distribution for the scaffolds belonging to the autosomes. The first distribution is expected to have an average just >0, as the sorting of the two nuclei types is imperfect. The second distribution is expected to have an average just >0.5, since the reads from “Sample X1X2” will be mapped to more scaffolds (both X chromosomes and autosomes scaffolds) than the reads from “Sample 0” (only autosomes). How much >0.5 depends on the distribution of RAD loci on X chromosomes and autosomes, and the precision of the sorting of the two nuclei types. A Bayesian mixture analysis was performed in order to separate the two distributions and estimate their proportion, mean, and variance (fig. 2; see also Supplementary Material online). The two identified distributions overlapped slightly, with 0.119 and 0.500 as the means of the distribution predicted to be composed of X chromosome and autosome scaffolds, respectively. When determining what minimum P0 to use as a cut-off for a scaffold to be considered an autosome, we tested three different cut-offs (0.119, 0.3, and 0.5). This was necessary due to the overlap of distributions in the autosomal peak (supplementary fig. 1, Supplementary Material online). Using transcriptomic data and RAD sequencing data on each of the three cut-offs, we estimated pi and dN/dS ratio for the autosomes, respectively. These two measures were consistent across the three cut-offs, and in particular between 0.3 and 0.5 (supplementary figs. 7 and 8, Supplementary Material online). Based on this comparison, and an estimated false positive rate of 2.5% (supplementary table 2, Supplementary Material online) we continued with P0 = 0.3 as the lower cut-off for the full set of analyses. A false positive rate of 2.5% was also used as to determine the upper cut-off for assigning scaffolds as belonging to the X chromosomes (P0 = 0.239).
Molecular Evolution at X Chromosomes and Autosomes
The raw sequences of all three species were quality trimmed using the FASTX toolkit (http://hannonlab.cshl.edu/fastx_toolkit). We discarded reads containing a position with a Phred quality score <10, as well as reads with an average Phred quality score <30. The clean data from all three species were mapped separately to a gene list of the S. mimosarum genome (Sanggaard et al. 2014) consisting of 26,314 loci all beginning with a start codon (ATG) using CLC Genomics Workbench 7 (default parameters). For each species, loci with average coverage <3 were initially removed. Consensus bases were called in all positions with coverage 8 or higher, while positions with coverage between 3 and 7 were masked and not included in downstream analyses. Ambiguous bases (IUPAC) were called when a base was supported by at least three reads and/or if its proportion was >10%. Only consensus sequences with <2.5% ambiguous bases were retained. The resulting consensus sequences were grouped based on their mapping to the S. mimosarum gene list by assuming orthology and subsequently aligned across species using PRANK (Loytynoja and Goldman 2008). Alignments were manually edited assuming that frame shifts were caused by sequencing or assembly errors. In total, 8,302 alignments with sequences from all three species were obtained, of which 285 belonged to X chromosome scaffolds and 8,017 to autosome scaffolds. All codons that could not be translated into an amino acid for a given species (because of Ns or ambiguous nucleotides) were identified, and the codons were removed from all three species. Synonymous (dS) substitution rates, nonsynonymous (dN) substitution rates, and dN/dS ratios were estimated for X chromosomes and autosomes separately in both S. mimosarum and S. africanus using PAML ver. 4.6 (Yang 2007). 95% confidence limits of dN, dS, and dN/dS were estimated by bootstrapping over the genes (n = 1,000) and producing one overall (across genes) estimate of dN, dS, and dN/dS for each sampling.
Molecular Diversity at X Chromosomes and Autosomes
A RAD reference was constructed for both S. mimosarum and S. africanus in two steps. First, all sequences represented by at least three identical reads were obtained using a custom program in all individuals separately (“clc_find_maximal,” see Supplementary Material online for more information). In the second step, species-specific RAD references were created by grouping all the resulting sequences from conspecific individuals with >98% similarity using a custom program (“clc_find_groups,” for more detail, see Supplementary Material online). The resulting RAD reference sets were mapped to the genome sequence of S. mimosarum (Sanggaard et al. 2014), and in cases with more than one reference sequence mapped to same position, all but one were removed using a custom script (“remove_dup.tcsh,” for more detail, see Supplementary Material online), giving two final RAD reference sets, one for each species. Each individual was subsequently mapped to these RAD reference sets using CLC Genomics Workbench 7, and consensus sequences were extracted from all mappings having a minimum of 8 reads and a maximum of 40 reads. Ambiguous bases (IUPAC) were called when the least frequent base was supported by at least three reads and/or if its proportion was >10%, but also considering the read quality score as implemented in the CLC Genomics Workbench 7. If a consensus sequence had >2.5% ambiguous bases it was discarded assuming that the mapped reads originated from more than one genomic position. For each consensus sequence, we called two alleles that were subsequently aligned per locus for all individuals within each population using PRANK (Loytynoja and Goldman 2008). We discarded alignments with less than five individuals represented, and separated remaining alignments into X chromosome and autosome based on the mapping of the RAD reference sets to the S. mimosarum genome scaffolds (see above). Since S. africanus is closely related to S. mimosarum, we interpreted the S. africanus RADs mapping to S. mimosarum X chromosome scaffolds as X chromosomes in S. africanus as well. For each set of alignments, all the alignments were concatenated, with missing sequences written as gaps, and split into equally long subalignments. This length was identical across all populations, X chromosome sets and autosome sets. This universal length of the subalignments was set such that the population with smallest X chromosome coverage had 15 subalignments (KRU: 136,432 bp). Within population genetic diversity (Tajima 1983) was calculated for each subalignment using the package ape in R (Paradis et al. 2004; R Core Team 2015), and average pi was calculated for X chromosomes and autosomes for each population. 95% confidence limits were estimated by bootstrapping over the sub alignments (n = 10,000).
McDonald–Kreitman Test
Rad sequence data from all S. mimosarum individuals were mapped to the reference genome using bwa (Li and Durbin 2009). Polymorphic positions were called in positions with minimum coverage of 10× using Samtools and bcftools (Li et al. 2009). Sites that were polymorphic in the RAD sequence data and sites that differed between RAD sequence data and the reference genome were considered. snpEff was used to identify variants located in protein coding positions, and if they were synonymous or nonsynonymous (Cingolani et al. 2012). The number of synonymous and nonsynonymous substitutions on X chromosomes and autosomes were taken from PAML analyses described earlier.
Variation in Diversity between X Chromosomes and Autosomes
Alignments of RAD loci from separate scaffolds were concatenated, and pi was estimated per scaffold with three or more RAD loci using the package ape (Paradis et al. 2004) in R (R Core Team 2016). Coefficient of variation was estimated for autosome and X chromosome scaffolds separately for each population using the estimator SD/average.
Simulations
We simulated DNA sequences under a recurrent bottleneck scenario using fastsimcoal2 (Excoffier et al. 2013). This was done with two different population sizes, 20,000 and 15,000 representing autosomes and X chromosomes, respectively, and using a mutation rate of 1.2E-8. These parameters were chosen to reach diversity similar to the estimates obtained from the RAD sequence data. Data were simulated to mimic our RAD sequence data by simulating 20,000 independent loci of 100 bp. Data were simulated under four different bottlenecks scenarios; 50 and 100 generations between bottlenecks combined with magnitude of bottlenecks of 1% and 10% (supplementary fig. 9, Supplementary Material online). Pi was estimated at different time points using the package ape (Paradis et al. 2004) in R (R Core Team 2016).
Statistical Analyses
When testing for species differences in piX/piA it was necessary to account for populations using a random effect in a mixed model in the package lme4 (Bates et al. 2015) in R (R Core Team 2016). Data used for this test were the subalignments of equal length created for the bootstrapping (see above). For each population, we grouped the autosomal subalignments in as many groups as there were subalignments of the X chromosomes. We then calculated the median (due to a highly skewed distribution of pi in S. mimosarum which has high frequency of scaffolds with zero pi) pi for each autosomal group and paired it randomly with an X chromosome subalignment, in this way, we got several independent estimates of piX/piA for each population. The statistical significance of the effect of species was assessed using a likelihood ratio test. To further test for population differentiation within species, we constructed a linear model for each species, containing population as the only predictor variable, and used F-tests and Tukey’s HSD method for post hoc comparisons. To test for differences in dN/dS between autosomes and X chromosomes within a species, we used a randomization test in which we permuted chromosomal origin (autosome or X chromosome) of all the genes (n permutations = 1,000) and estimated one overall (across genes) estimate of dN/dS for genes assigned to autosome or X chromosome in each sampling. We then estimated X(dN/dS)−A(dN/dS) for each permutation, and used this as a test-statistic in a two-tailed test by comparison to the observed difference. We used the same approach when testing for differences in dS, but here we used the ratio dSX/dSA as a test-statistic. A similar approach was used to test for differences in A(dN/dS) or in X(dN/dS) between the two species, except here we permuted the species origin of each gene and used the test-statistics Aafricanus (dN/dS)−Amimosarum (dN/dS)- and Xafricanus (dN/dS)−Xmimosarum (dN/dS). Finally, when analyzing whether the difference in dN/dS between X-linked and autosomal genes differs between S. mimosarum and S. africanus, we used (X(dN/dS)/A(dN/dS))africanus−(X(dN/dS)/A(dN/dS))mimosarum as a test-statistic.
X Chromosome Mutation Rate
We estimated the male-to-female mutation rate from synonymous divergence under the assumption that the synonymous mutation rate equals the synonymous substitution rate (Kimura 1983), by comparing synonymous divergence at X chromosomes and autosomes. We used the formula kx/kA = (2/3)(2+α)/(1+α) following Miyata et al. (1987), where k is the synonymous sequence divergence. We obtained two independent estimates; 1) synonymous divergence (dS) between the two species estimated from transcriptome data, and 2) divergence between the two genetically isolated groups of S. mimosarum populations from Madagascar and South Africa, respectively, estimated from RAD data. The latter analysis was done under the assumption that RAD loci evolve neutrally. To adjust for different times to accumulate substitutions for X chromosomes and autosomes due to different coalescence times of X chromosomes and autosomes in the ancestral species/population caused by differences in Ne, we used coalescence calculations to adjust kx/kA. These calculations are based on coalescence times in the ancestral species/population, which is a function of effective ancestral population sizes (NA). Approximate NA estimates were obtained from Settepani et al. (2017).
Supplementary Material
Supplementary data are available at Molecular Biology and Evolution online.
Supplementary Material
Acknowledgments
The study was supported by a grant from the European Research Council (ERC StG-2011_282163) to T.B. We thank the FACS Core Facility (Aarhus University) where flow cytometric sorting was performed. We also thank Anne Aagaard Lauridsen and Shenglin Liu for useful suggestions to the manuscript. We thank Marie Rosenstand Hansen for technical assistance. Sequence data can be downloaded from NCBI under the BioProject ID: PRJNA453114.
References
- Andres JA, Morrow EH.. 2003. The origin of interlocus sexual conflict: is sex-linkage important? J Evol Biol. 162:219–223. [DOI] [PubMed] [Google Scholar]
- Arbeithuber B, Betancourt AJ, Ebner T, Tiemann-Boege I.. 2015. Crossovers are associated with mutation and biased gene conversion at recombination hotspots. Proc Natl Acad Sci U S A. 1127:2109–2114. [DOI] [PMC free article] [PubMed] [Google Scholar]
- Arbiza L, Gottipati S, Siepel A, Keinan A.. 2014. Contrasting X-linked and autosomal diversity across 14 human populations. Am J Hum Genet. 946:827–844. [DOI] [PMC free article] [PubMed] [Google Scholar]
- Aron S, De Menten L, Bockstaele DV.. 2003. Brood sex ratio determination by flow cytometry in ants. Mol Ecol Resourc. 3:471–475. [Google Scholar]
- Assis R, Zhou Q, Bachtrog D.. 2012. Sex-biased transcriptome evolution in Drosophila. Genome Biol Evol. 411:1189–1200. [DOI] [PMC free article] [PubMed] [Google Scholar]
- Bates D, Machler M, Bolker BM, Walker SC.. 2015. Fitting linear mixed-effects models using lme4. J Stat Softw. 67:1–48. [Google Scholar]
- Begun DJ, Aquadro CF.. 1992. Levels of naturally occurring DNA polymorphism correlate with recombination rates in D. melanogaster. Nature 3566369:519–520. [DOI] [PubMed] [Google Scholar]
- Betancourt AJ, Presgraves DC, Swanson WJ.. 2002. A test for faster X evolution in Drosophila. Mol Biol Evol. 1910:1816–1819. [DOI] [PubMed] [Google Scholar]
- Bilde T, Coates KS, Birkhofer K, Bird T, Maklakov AA, Lubin Y, Aviles L.. 2007. Survival benefits select for group living in a social spider despite reproductive costs. J Evol Biol. 206:2412–2426. [DOI] [PubMed] [Google Scholar]
- Bilde T, Lubin Y, Smith D, Schneider JM, Maklakov AA.. 2005. The transition to social inbred mating systems in spiders: role of inbreeding tolerance in a subsocial predecessor. Evolution 591:160–174. [PubMed] [Google Scholar]
- Bracken-Grissom H, Collins AG, Collins T, Crandall K, Distel D, Dunn C, Giribet G, Haddock S, Knowlton N, Martindale M, et al. 2014. The Global Invertebrate Genomics Alliance (GIGA): developing community resources to study diverse invertebrate genomes. J Hered. 1051:1–18. [DOI] [PMC free article] [PubMed] [Google Scholar]
- Carneiro M, Albert FW, Melo-Ferreira J, Galtier N, Gayral P, Blanco-Aguiar JA, Villafuerte R, Nachman MW, Ferrand N.. 2012. Evidence for widespread positive and purifying selection across the European rabbit (Oryctolagus cuniculus) genome. Mol Biol Evol. 297:1837–1849. [DOI] [PMC free article] [PubMed] [Google Scholar]
- Charlesworth B. 2009. Effective population size and patterns of molecular evolution and variation. Nat Rev Genet. 103:195–205. [DOI] [PubMed] [Google Scholar]
- Charlesworth B. 2012. The effects of deleterious mutations on evolution at linked sites. Genetics 1901:5–22. [DOI] [PMC free article] [PubMed] [Google Scholar]
- Charlesworth B, Campos JL, Jackson BC.. 2018. Faster‐X evolution: theory and evidence from Drosophila. Mol Ecol. 2719:3753–3771. [DOI] [PubMed] [Google Scholar]
- Charlesworth B, Coyne JA, Barton NH.. 1987. The relative rates of evolution of sex-chromosomes and autosomes. Am Nat. 1301:113–146. [Google Scholar]
- Cingolani P, Platts A, Wang LL, Coon M, Nguyen T, Wang L, Land SJ, Lu XY, Ruden DM.. 2012. A program for annotating and predicting the effects of single nucleotide polymorphisms, SnpEff: SNPs in the genome of Drosophila melanogaster strain w(1118); iso-2; iso-3. Fly 62:80–92. [DOI] [PMC free article] [PubMed] [Google Scholar]
- Counterman BA, Ortiz-Barrientos D, Noor M.. 2004. Using comparative genomic data to test for fast-x evolution. Evolution 583:656–660. [PubMed] [Google Scholar]
- Crouch T, Lubin Y.. 2001. Population stability and extinction in a social spider Stegodyphus mimosarum (Araneae: eresidae). Biol J Linn Soc. 723:409–417. [Google Scholar]
- Cutter AD, Wasmuth JD, Washington NL.. 2008. Patterns of molecular evolution in Caenorhabditis preclude ancient origins of selfing. Genetics 1784:2093–2104. [DOI] [PMC free article] [PubMed] [Google Scholar]
- Drost JB, Lee WR.. 1998. The developmental basis for germline mosaicism in mouse and Drosophila melanogaster. Genetica 102-3:421–443. [PubMed] [Google Scholar]
- Ellegren H. 2007. Characteristics, causes and evolutionary consequences of male-biased mutation. Proc R Soc B. 2741606:1–10. [DOI] [PMC free article] [PubMed] [Google Scholar]
- Ellegren H. 2009. The different levels of genetic diversity in sex chromosomes and autosomes. Trends Genet. 256:278–284. [DOI] [PubMed] [Google Scholar]
- Ellegren H, Galtier N.. 2016. Determinants of genetic diversity. Nat Rev Genet. 177:422–433. [DOI] [PubMed] [Google Scholar]
- Evans JD, Brown SJ, Hackett KJ, Robinson G, Richards S, Lawson D, Elsik C, Coddington J, Edwards O, Emrich S.. 2013. The i5K initiative: advancing arthropod genomics for knowledge, human health, agriculture, and the environment i5K Consortium. J Hered. 104:595–600. [DOI] [PMC free article] [PubMed] [Google Scholar]
- Excoffier L, Dupanloup I, Huerta-Sanchez E, Sousa VC, Foll M.. 2013. Robust demographic inference from genomic and SNP data. PLoS Genet. 910:e1003905.. [DOI] [PMC free article] [PubMed] [Google Scholar]
- Eyre-Walker A, Keightley PD.. 2009. Estimating the rate of adaptive molecular evolution in the presence of slightly deleterious mutations and population size change. Mol Biol Evol. 269:2097–2108. [DOI] [PubMed] [Google Scholar]
- Garner DL, Evans KM, Seidel GE.. 2013. Sex-sorting sperm using flow cytometry/cell sorting. Methods Mol Biol. 927:279–295. [DOI] [PubMed] [Google Scholar]
- Garrigan D, Kingan SB, Geneva AJ, Vedanayagam JP, Presgraves DC.. 2014. Genome diversity and divergence in Drosophila mauritiana: multiple signatures of Faster X evolution. Genome Biol Evol. 69:2444–2458. [DOI] [PMC free article] [PubMed] [Google Scholar]
- Guo YL, Bechsgaard JS, Slotte T, Neuffer B, Lascoux M, Weigel D, Schierup MH.. 2009. Recent speciation of Capsella rubella from Capsella grandiflora, associated with loss of self-incompatibility and an extreme bottleneck. Proc Natl Acad Sci U S A. 10613:5246–5251. [DOI] [PMC free article] [PubMed] [Google Scholar]
- Hedrick PW. 2007. Sex: differences in mutation, recombination, selection, gene flow, and genetic drift. Evolution 6112:2750–2771. [DOI] [PubMed] [Google Scholar]
- Hu TT, Eisen MB, Thornton KR, Andolfatto P.. 2013. A second-generation assembly of the Drosophila simulans genome provides new insights into patterns of lineage-specific divergence. Genome Res. 231:89–98. [DOI] [PMC free article] [PubMed] [Google Scholar]
- Hutter S, Li HP, Beisswanger S, De Lorenzo D, Stephan W.. 2007. Distinctly different sex ratios in African and European populations of Drosophila melanogaster inferred from chromosomewide single nucleotide polymorphism data. Genetics 1771:469–480. [DOI] [PMC free article] [PubMed] [Google Scholar]
- Hvilsom C, Qian Y, Bataillon T, Li YR, Mailund T, Salle B, Carlsen F, Li RQ, Zheng HC, Jiang T, et al. 2012. Extensive X-linked adaptive evolution in central chimpanzees. Proc Natl Acad Sci U S A. 1096:2054–2059. [DOI] [PMC free article] [PubMed] [Google Scholar]
- Jaenike J. 2001. Sex chromosome meiotic drive. Annu Rev Ecol Syst. 321:25–49. [Google Scholar]
- Jaquiery J, Peccoud J, Ouisse T, Legeai F, Prunier-Leterme N, Gouin A, Nouhaud P, Brisson JA, Bickel R, Purandare S, et al. 2018. Disentangling the causes for Faster-X evolution in Aphids. Genome Biol Evol. 102:507–520. [DOI] [PMC free article] [PubMed] [Google Scholar]
- Jaquiery J, Stoeckel S, Rispe C, Mieuzet L, Legeai F, Simon JC.. 2012. Accelerated evolution of sex chromosomes in aphids, an X0 system. Mol Biol Evol. 292:837–847. [DOI] [PubMed] [Google Scholar]
- Johannesen J, Lubin Y, Smith DR, Bilde T, Schneider JM.. 2007. The age and evolution of sociality in Stegodyphus spiders: a molecular phylogenetic perspective. Proc R Soc B. 2741607:231–237. [DOI] [PMC free article] [PubMed] [Google Scholar]
- Junghanns A, Holm C, Schou MF, Sorensen AB, Uhl G, Bilde T.. 2017. Extreme allomaternal care and unequal task participation by unmated females in a cooperatively breeding spider. Anim Behav. 132:101–107. [Google Scholar]
- Kimura M. 1983. The neutral theory of molecular evolution. Cambridge: Cambridge University Press. [Google Scholar]
- Kitano J, Ross JA, Mori S, Kume M, Jones FC, Chan YF, Absher DM, Grimwood J, Schmutz J, Myers RM, et al. 2009. A role for a neo-sex chromosome in stickleback speciation. Nature 4617267:1079–1083. [DOI] [PMC free article] [PubMed] [Google Scholar]
- Kousathanas A, Halligan DL, Keightley PD.. 2014. Faster-X adaptive protein evolution in house mice. Genetics 1964:1131. [DOI] [PMC free article] [PubMed] [Google Scholar]
- Li H, Durbin R.. 2009. Fast and accurate short read alignment with Burrows-Wheeler transform. Bioinformatics 2514:1754–1760. [DOI] [PMC free article] [PubMed] [Google Scholar]
- Li H, Handsaker B, Wysoker A, Fennell T, Ruan J, Homer N, Marth G, Abecasis G, Durbin R, Genome Project Data P.. 2009. The Sequence Alignment/Map format and SAMtools. Bioinformatics 2516:2078–2079. [DOI] [PMC free article] [PubMed] [Google Scholar]
- Loytynoja A, Goldman N.. 2008. Phylogeny-aware gap placement prevents errors in sequence alignment and evolutionary analysis. Science 3205883:1632–1635. [DOI] [PubMed] [Google Scholar]
- Lu J, Wu CI.. 2005. Weak selection revealed by the whole-genome comparison of the X chromosome and autosomes of human and chimpanzee. Proc Natl Acad Sci U S A. 10211:4063–4067. [DOI] [PMC free article] [PubMed] [Google Scholar]
- Lubin Y, Bilde T.. 2007. The evolution of sociality in spiders. Advances in the study of behavior, 37: 83–145. [Google Scholar]
- Mank JE, Axelsson E, Ellegren H.. 2007. Fast-X on the Z: rapid evolution of sex-linked genes in birds. Genome Res. 175:618–624. [DOI] [PMC free article] [PubMed] [Google Scholar]
- Mank JE, Hosken DJ, Wedell N.. 2014. Conflict on the sex chromosomes: cause, effect, and complexity. Cold Spring Harb Perspect Biol. 6. [DOI] [PMC free article] [PubMed] [Google Scholar]
- Mank JE, Nam K, Ellegren H.. 2010. Faster-Z evolution is predominantly due to genetic drift. Mol Biol Evol. 273:661–670. [DOI] [PubMed] [Google Scholar]
- Mattila TM, Bechsgaard JS, Hansen TT, Schierup MH, Bilde T.. 2012. Orthologous genes identified by transcriptome sequencing in the spider genus Stegodyphus. BMC Genomics 13:70.. [DOI] [PMC free article] [PubMed] [Google Scholar]
- McDonald JH, Kreitman M.. 1991. Adaptive protein evolution ar the adh locus in Drosophila. Nature 3516328:652–654. [DOI] [PubMed] [Google Scholar]
- Miyata T, Hayashida H, Kuma K, Mitsuyasu K, Yasunaga T.. 1987. Male-driven molecular evolution – a model and nucleotide sequence analysis. Cold Spring Harb Symp Quant Biol. 52:863–867. [DOI] [PubMed] [Google Scholar]
- Nam K, Munch K, Mailund T, Nater A, Greminger MP, Krutzen M, Marques-Bonet T, Schierup MH.. 2017. Evidence that the rate of strong selective sweeps increases with population size in the great apes. Proc Natl Acad Sci U S A. 1147:1613–1618. [DOI] [PMC free article] [PubMed] [Google Scholar]
- Paradis E, Claude J, Strimmer K.. 2004. APE: analyses of phylogenetics and evolution in R language. Bioinformatics 202:289–290. [DOI] [PubMed] [Google Scholar]
- Poland JA, Brown PJ, Sorrells ME, Jannink JL.. 2012. Development of high-density genetic maps for barley and wheat using a novel two-enzyme genotyping-by-sequencing approach. PLoS One 72:e32253.. [DOI] [PMC free article] [PubMed] [Google Scholar]
- Pool JE, Corbett-Detig RB, Sugino RP, Stevens KA, Cardeno CM, Crepeau MW, Duchen P, Emerson JJ, Saelao P, Begun DJ, et al. 2012. Population genomics of sub-Saharan Drosophila melanogaster: African diversity and non-African admixture. PLoS Genet. 812:e1003080. [DOI] [PMC free article] [PubMed] [Google Scholar]
- Pool JE, Nielsen R.. 2007. Population size changes reshape genomic patterns of diversity. Evolution 6112:3001–3006. [DOI] [PMC free article] [PubMed] [Google Scholar]
- Pool JE, Nielsen R.. 2008. The impact of founder events on chromosomal variability in multiply mating species. Mol Biol Evol. 258:1728–1736. [DOI] [PMC free article] [PubMed] [Google Scholar]
- Presgraves DC. 2008. Sex chromosomes and speciation in Drosophila. Trends Genet. 247:336–343. [DOI] [PMC free article] [PubMed] [Google Scholar]
- R Core Team. 2015. R: a language and environment for statistical computing. Vienna (Austria: ): R Foundation for Statistical Computing. [Google Scholar]
- R Core Team. 2016. R: a language and environment for statistical computing. Vienna (Austria: ): R Foundation for Statistical Computing. [Google Scholar]
- Rousselle M, Faivre N, Ballenghien M, Galtier N, Nabholz B.. 2016. Hemizygosity enhances purifying selection: lack of Fast-Z evolution in two Satyrine butterflies. Genome Biol Evol. 810:3108–3119. [DOI] [PMC free article] [PubMed] [Google Scholar]
- Sackton TB, Corbett-Detig RB, Nagaraju J, Vaishna L, Arunkumar KP, Hartl DL.. 2014. Positive selection drives Faster-Z evolution in silkmoths. Evolution 688:2331–2342. [DOI] [PMC free article] [PubMed] [Google Scholar]
- Salomon M, Lubin Y.. 2007. Cooperative breeding increases reproductive success in the social spider Stegodyphus dumicola (Araneae, Eresidae). Behav Ecol Sociobiol. 6111:1743–1750. [Google Scholar]
- Sanggaard KW, Bechsgaard JS, Fang XD, Duan JJ, Dyrlund TF, Gupta V, Jiang XT, Cheng L, Fan DD, Feng Y, et al. 2014. Spider genomes provide insight into composition and evolution of venom and silk. Nat Commun. 5:Article number: 3765. [DOI] [PMC free article] [PubMed] [Google Scholar]
- Schou MF, Loeschcke V, Bechsgaard J, Schlotterer C, Kristensen TN.. 2017. Unexpected high genetic diversity in small populations suggests maintenance by associative overdominance. Mol Ecol. 2623:6510–6523. [DOI] [PubMed] [Google Scholar]
- Settepani V, Bechsgaard J, Bilde T.. 2014. Low genetic diversity and strong but shallow population differentiation suggests genetic homogenization by metapopulation dynamics in a social spider. J Evol Biol. 2712:2850–2855. [DOI] [PubMed] [Google Scholar]
- Settepani V, Bechsgaard J, Bilde T.. 2016. Phylogenetic analysis suggests that sociality is associated with reduced effectiveness of selection. Ecol Evol. 62:469–477. [DOI] [PMC free article] [PubMed] [Google Scholar]
- Settepani V, Schou MF, Greve M, Grinsted L, Bechsgaard J, Bilde T.. 2017. Evolution of sociality in spiders leads to depleted genomic diversity at both population and species levels. Mol Ecol. 2616:4197–4210. [DOI] [PubMed] [Google Scholar]
- Smith JM, Haigh J.. 1974. The hitch-hiking effect of a favourable gene. Genet Res. 2301:23–25. [PubMed] [Google Scholar]
- Supek F, Vlahovicek K.. 2004. INCA: synonymous codon usage analysis and clustering by means of self-organizing map. Bioinformatics 2014:2329–2330. [DOI] [PubMed] [Google Scholar]
- Tajima F. 1983. Evolutionary relationship of DNA-sequences in finite populations. Genetics 1052:437–460. [DOI] [PMC free article] [PubMed] [Google Scholar]
- Thornton K, Bachtrog D, Andolfatto P.. 2006. X chromosomes and autosomes evolve at similar rates in Drosophila: no evidence for faster-X protein evolution. Genome Res. 164:498–504. [DOI] [PMC free article] [PubMed] [Google Scholar]
- Torgerson DG, Singh RS.. 2006. Enhanced adaptive evolution of sperm-expressed genes on the mammalian X chromosome. Heredity 961:39–44. [DOI] [PubMed] [Google Scholar]
- Unckless RL, Larracuente AM, Clark AG.. 2015. Sex-ratio meiotic drive and Y-linked resistance in Drosophila affinis. Genetics 1993:831–840. [DOI] [PMC free article] [PubMed] [Google Scholar]
- Vanthournout B, Busck M, Bechsgaard J, Hendrickx F, Schramm S, Bilde T.. 2018. Male spiders control offspring sex ratio through greater production of female-determining sperm. Proc R Soc B. 2851875:20172887.. [DOI] [PMC free article] [PubMed] [Google Scholar]
- Vanthournout B, Deswarte K, Hammad H, Bilde T, Lambrecht B, Hendrickx F.. 2014. Flow cytometric sexing of spider sperm reveals an equal sperm production ratio in a female-biased species. Biol Lett. 10:20140159. [DOI] [PMC free article] [PubMed] [Google Scholar]
- Vicoso B, Charlesworth B.. 2006. Evolution on the X chromosome: unusual patterns and processes. Nat Rev Genet. 78:645–653. [DOI] [PubMed] [Google Scholar]
- Vicoso B, Charlesworth B.. 2009. Effective population size and the faster-X effect: an extended model. Evolution 639:2413–2426. [DOI] [PubMed] [Google Scholar]
- Vindelov LL, Christensen IJ, Nissen NI.. 1983. A detergent-trypsin method for the preparation of nuclei for flow cytometric DNA analysis. Cytometry 35:323–327. [DOI] [PubMed] [Google Scholar]
- Wright AE, Harrison PW, Zimmer F, Montgomery SH, Pointer MA, Mank JE.. 2015. Variation in promiscuity and sexual selection drives avian rate of Faster-Z evolution. Mol Ecol. 246:1218–1235. [DOI] [PMC free article] [PubMed] [Google Scholar]
- Xu K, Oh S, Park T, Presgraves DC, Yi SV.. 2012. Lineage-specific variation in slow- and fast-X evolution in primates. Evolution 666:1751–1761. [DOI] [PubMed] [Google Scholar]
- Yang ZH. 2007. PAML 4: phylogenetic analysis by maximum likelihood. Mol Biol Evol. 248:1586–1591. [DOI] [PubMed] [Google Scholar]
Associated Data
This section collects any data citations, data availability statements, or supplementary materials included in this article.