Abstract
A full quantitative evaluation of the depolarization of light may serve to assess concentrations of depolarizing particles in the retinal pigment epithelium and to investigate their role in retinal diseases in the human eye. Optical coherence tomography and optical frequency domain imaging use spatial incoherent averaging to compute depolarization. Depolarization depends on accurate measurements of the polarization states at the receiver but also on the polarization state incident upon and within the tissue. Neglecting this dependence can result in artifacts and renders depolarization measurements vulnerable to birefringence in the system and in the sample. In this work, we discuss the challenges associated with using a single input polarization state and traditional depolarization metrics such as the degree-of-polarization and depolarization power. We demonstrate quantitative depolarization measurements based on Jones vector synthesis and polar decomposition using fiber-based polarization-sensitive optical frequency domain imaging of the retinal pigment epithelium in a human eye.
Keywords: depolarization, medical imaging, ophthalmology, optical coherence tomography, polarization, single-mode fiber
Graphical Abstract
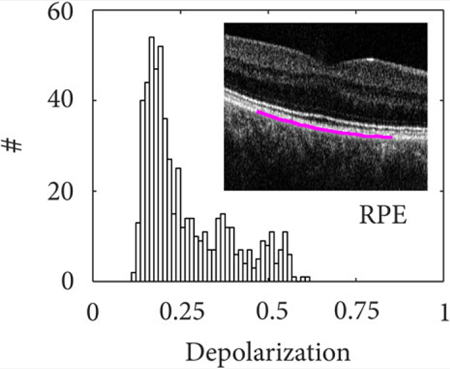
1 |. INTRODUCTION
Depolarization corresponds to the randomization of the polarization state of light and has been used to determine the scattering characteristics of particles with LIDAR [1, 2], and ellipsometry [3], as well as to differentiate the scattering properties of biological tissues [4]. Conventional polarimetry uses partially coherent imaging to directly measure a temporal or spatial average of the fluctuating field [5], in which case part of the detected energy can appear depolarized. Coherent imaging techniques like optical coherence tomography (OCT) only detect fully polarized light, but can use spatial averaging of the measured polarization states to obtain comparable metrics of depolarization [6, 7], which can provide additional tissue contrast.
In ophthalmic OCT, the pigmented epithelia of the iris and retina have been recognized to exhibit pronounced depolarization [7–14]. This characteristic property has enabled automated segmentation of pathologic features such as drusen and atrophic zones, and has allowed the assessment of age-related macular degeneration (AMD) [15–20]. Depolarization measured with OCT has also been used to monitor the healing process and scar formation of thermal injuries in rat skin [21] and to detect lipid-rich areas of coronary atherosclerotic lesions [22] and dental caries [23].
We have previously shown that conventional OCT metrics of depolarization exhibit a strong input state dependence [24]. This can give rise to apparent image texture and makes a quantitative evaluation of depolarization challenging. Fiber-based imaging systems as well as birefringent samples, such as the cornea in the eye, alter the polarization state of the probing OCT light and further undermine the ability to control the input polarization state incident on the tissue of interest. Recently, we have introduced a rigorous formalism that derives a robust measure of (definitive) depolarization and demonstrated its potential with the use of gold nanorods (GNRs) as the source of depolarization [25]. Here, we apply the same reliable metric to measurements of the RPE in a human volunteer in vivo and demonstrate independence of the input state and the unknown corneal retardation, enabling an accurate and quantitative analysis of RPE depolarization.
2 |. METHODS
2.1 |. Experimental setup
The optical frequency domain imaging (OFDI) system was described in detail previously [26]. Briefly, light emitted by the laser (Axsun Technologies, Inc.) swept a bandwidth of 110 nm (29 THz) centered at a wavelength of 1.04 μm at a repetition rate of 100 kHz with a linewidth of 11 GHz (coherence length of 12 mm). The optical power incident on the eye was 1.6 mW. In the sample arm, light was directed to a polarization delay unit (PDU) where two orthogonal polarization states were generated. In the PDU, light was split using a 50/50 fiber coupler and each output traveled a different path length through air before being recombined by a fiber-based polarization beam splitter (PBS). This created a different optical path delay for the two polarization states, multiplexing them along depth within a single wavelength-sweep. In-line fiber polarization controllers were used to align the orientation of the polarization states to the PBS inputs, which effectively generated two orthogonal polarization states that were sent simultaneously to the sample. A fiber polarization controller and an optional polarimeter (Thorlabs, PAX1000IR2) in place of the sample enabled controlling the effective polarization state incident on the eye. At the receiver, the collected sample light back-scattered by the tissue was combined with the reference light and projected on two orthogonal polarization channels. The relative phase between the two channels enabled retrieval of the Jones vector corresponding to the scattered field. Moreover, the multiplexed illumination states (linear basis) cast the Jones matrix for all depths from a single wavelength sweep. A microscope cover slip was positioned in one of the polarization detection channels to provide a calibration signal that was used to remove an artificial phase difference, induced by timing jitter, between the depth-encoded input polarization states [27]. Chromatic dispersion was compensated numerically [28, 29]. Cross-sectional images contained 2000 A-scans at steps of 4.4 μm, spanning 8.8 mm in lateral direction. Volumes were recorded across a transverse distance of 270 μm at steps of 18 μm. The axial resolution was approximately 10 μm in air and the axial pixel spacing was 4.86 μm in air. The diffraction-limited spot size on the retina was estimated to be 18 μm. The speckle size spanned approximately 2 pixels in the axial direction and 4 pixels in the lateral direction.
2.2 |. Evaluation of depolarization in the RPE
To evaluate and compare different depolarization metrics, we repeatedly imaged the fovea of a human volunteer with the two depth-multiplexed input polarization states. Using the polarization controllers and the polarimeter, the polarization states of the light incident on the eye were adjusted to specific input values. Figure 1 presents a typical cross-sectional image spanning the fovea of the volunteer’s eye. In the intensity image of Figure 1, the three posterior layers of the retina [inner and outer photoreceptor segment (IS/OS), end tips of the photoreceptors (ETPR), RPE] can be seen clearly and present similar reflectivity. The corresponding depolarization image in Figure 1 confirms that the RPE scrambles the polarization state of backscattered light. Throughout this work, depolarization of the RPE was evaluated with a Hanning kernel with a full width at half maximum of approximately 4 × 4 speckles. Evaluation of the RPE depolarization used automated segmentation of the pigment epithelium in the intensity data, based on detection of the highest intensity gradient at the RPE interface [30], as indicated by the blue line in Figure 1B. The central 3 mm of the segmented layer was used as the region of interest to evaluate the mean and the SD of the depolarization values, and to perform statistical comparison.
FIGURE 1.

Cross-sectional images of the human fovea in vivo. The intensity and depolarization (Δ) image is shown. The segmented RPE is plotted on top of the depolarization image (blue curve) and corresponds to the region used to evaluate depolarization. The data set spans 8.8 mm in lateral and 1.8 mm in axial direction
3 |. DEGREE OF POLARIZATION
3.1 |. Theory
Depolarization refers to the randomization of the incident polarization state by processes associated with scattering [6], diattenuation [25] and retardance [21], which can vary in space [5–7], time [31–33] and/or wavelength [34–36]. Depolarization is the result of incoherent superposition of pure, fully polarized states, leading to a mixed state. Mixing can take place intrinsically during detection in case of partially coherent imaging systems [5]. Coherent imaging systems, on the other hand, detect the coherent superposition of the contribution from individual scatterers, which always results in measured pure states, modeled by the Jones vector |Ψ〉. In OCT, an incoherent ensemble is obtained only after detection, by incoherently averaging pure states in a small spatial neighborhood around each pixel. Any mixed state can be described as the superposition of the coherency matrix of the underlying pure states , where index s indicates the underlying pure states and ps is their occurrence [25]. The eigenvalues υ1, 2 of ρ/Trρ describe polarization entropy and formally connect it with DOP [25, 37],
| (1) |
The more traditional expression of the degree of polarization is obtained using the four real Stokes parameters. Because in OCT and OFDI the incoherent ensemble is generated synthetically, the term degree of polarization uniformity has been applied and the spatially averaged Stokes components are used, where ⟨⟩ denotes the ensemble average. The four Stokes parameters are given by the four matrix elements of with , and . Because the construction of this mixed state satisfies the superposition principle, we continue to use the traditional DOP denomination throughout this manuscript. If the Stokes vectors were normalized before computing their spatial average, this principle would be violated. For the remainder of this work, we visualize DOP as depolarization, ΔDOP = 1 − DOP, to make it comparable with other depolarization metrics.
For a quantitative evaluation of depolarization, it is crucial to account for the size of the incoherent ensemble, that is, the size of the spatial kernel used for averaging. Speckle is characteristic of the source wavelength-sweep spectrum and the spatial resolution and provides the governing metric for a direct comparison of depolarization values between imaging systems and samples. Together with the number of pure states, that is, speckle, in the operator, the measured depolarization increases. To demonstrate this in more detail, we imaged gold nanorod (GNR) mixtures as a depolarizing phantom. Note that for this experiment, we used a microscope (not ophthalmoscope) OFDI system as described in Ref. [25]. The GNRs (0.4 nM) increasingly depolarize the incoherently averaged polarization states with growing kernel size (Figure 2 red curve), following closely the depolarization obtained from simulated fully depolarized measurements (black line). The ability to tailor the averaging kernel (density operator) after the measurement offers a distinct advantage for depolarization measurements with a coherent imaging system. A large kernel increases the dynamic range of a depolarization measurement and offers improved differentiation of partially depolarizing samples but reduces spatial resolution and increases the risk of averaging across non-homogeneous tissue structure. To measure depolarization from the RPE, the kernel size was adjusted to 4 by 4 speckles, finding a compromise between spatial resolution and dynamic range.
FIGURE 2.
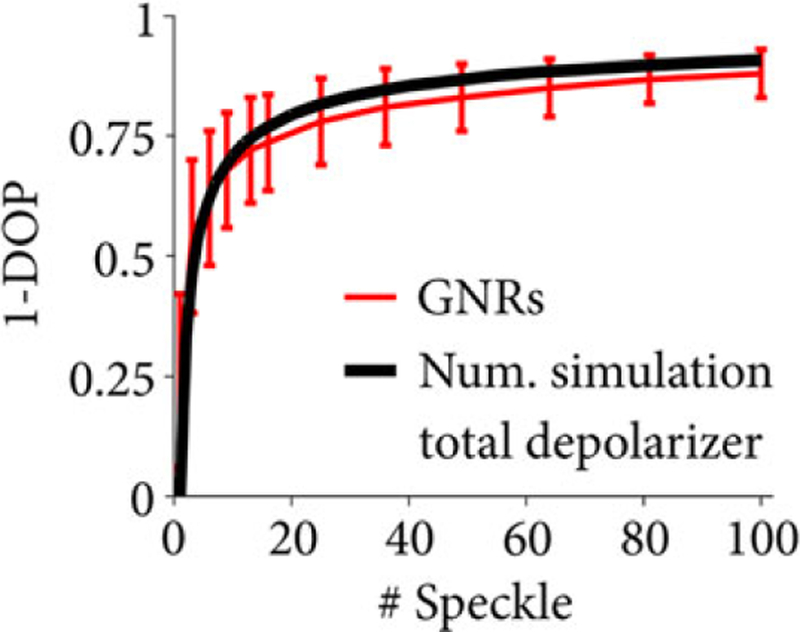
A depolarization measurement depends on the number of observables used in the averaging kernel (density operator). Depolarization increases with kernel size as the degree of coherence of the coherent measurement decreases. The knowledge of kernel size is crucial for the interpretation of a depolarization measurement
3.2 |. Dependency on probing state
We previously demonstrated the dependency of DOP on the input polarization state for diattenuating GNRs [25] and a birefringent phantom [24]. Here, we image the RPE in vivo and confirm that these mechanisms are generally valid. Scattering by randomly oriented, anisotropic, ellipsoidal particles of a size comparable to the wavelength depolarizes light, as scattering dominantly occurs along the long (diattenuating) axis. A probing linear state may align with either the long or short axis of the particle, resulting in the preservation or loss of these states. In contrast, a circular input state probes the sample with both linear bases in parallel, leading to equal scattering amplitude at any azimuthal particle orientation, thereby yielding high depolarization [25]. Depolarization from singly scattering and diattenuating particles only affects the backscattered light, and hence the signal from behind such a depolarizing layer may again be polarized.
Figure 3 illustrates the measured depolarization of the IS/OS layer (Figure 3A,B) and RPE layer (Figure 3C–F). For each case, the Poincaré sphere with normalized Stokes vectors and a depolarization histogram are shown for 600 mixed states, computed across 16 speckles and recorded at the same RPE cross-section over a time span of 12 seconds. Note that, although the system used two incident polarization states, only one polarization state was used to compute ΔDOP and the other one was ignored for this analysis. The Stokes vectors are color-coded to indicate depolarization, which is inversely proportional to the vector magnitude. The IS/OS layer maintains the polarization state resulting in a small Stokes vector cloud concentrated around the input polarization state. The vector magnitude is close to unity and exhibits no depolarization as can also be seen in the histogram in Figure 3B. We contrast this result to the RPE layer that exhibits strong polarization scrambling. The input polarization state at the RPE was not controlled in this case but remained constant during acquisition. Sample motion as well as scanning inaccuracies caused randomized mixed states throughout the Poincaré sphere. The reduced Stokes vector magnitude indicates a mean depolarization of approximately 0.45 (Figure 3C,D). Figure 3E shows the measured Stokes vectors from the RPE where the polarization controller in the sample arm was toggled during the 12 seconds acquisition, thereby changing the polarization state incident on the sample. Note that the change in input state with time was negligible compared to the A-line rate. The different input states lead to a vastly changing Stokes vector magnitude in the Poincaré sphere and a depolarization ranging from 0.15 to 0.6. The L-shaped distribution seen in the histogram (Figure 3F) may be caused by the dominance of linear over circular polarization states when randomly changing the input polarization states. These results clearly demonstrate that an unkown input polarization state and changes of the input state due to uncontrolled movement of the single-mode fiber severely hamper quantitative depolarization measurements.
FIGURE 3.
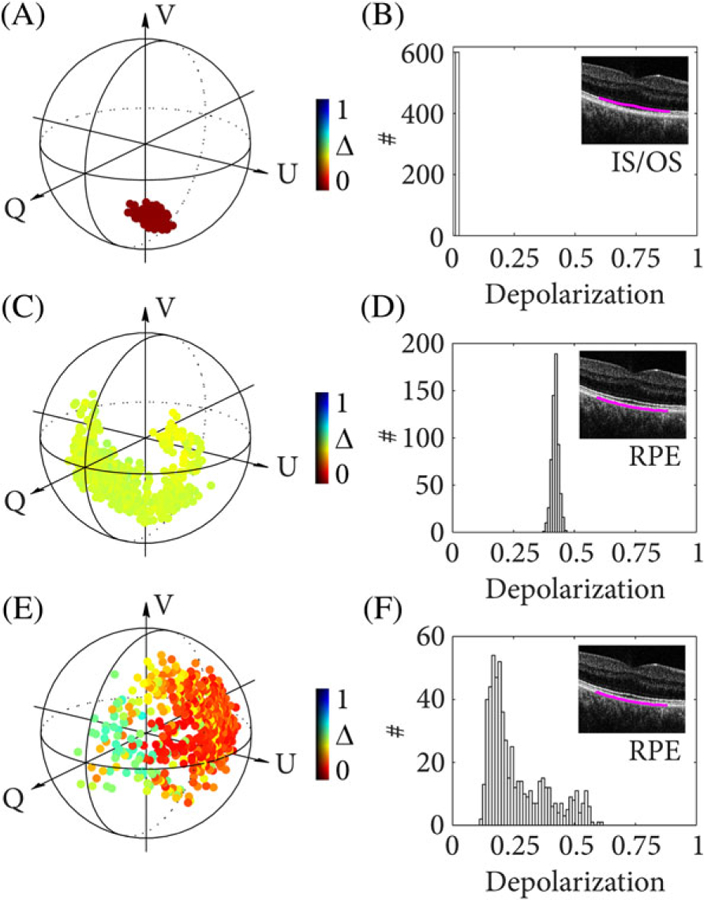
The Poincaré sphere showing computed mixed states and histograms for depolarization (ΔDOP = 1 − DOP) from 600 measurements at the same location in the IS/OS (A), (B) and RPE (C-F). The polarization state incident at the sample was kept constant in (C), (D) and was arbitrarily altered by toggling a polarization controller in the sample arm in (E), (F)
We further highlight the dependency on the probing state by imaging the RPE under controlled conditions. Before taking a measurement, the polarization state incident on the eye was calibrated to a known polarization state using a polarimeter. Qualitative results are shown in Figure 4. Figure 5 shows more detailed quantitative results, where the depolarization was averaged across the automatically identified region of interest in three adjacent cross-sections. The probing state was varied from linear horizontal to linear 45° polarization (θ, blue) and from linear horizontal to circular polarization (ϕ, red). Depolarization (Δ) remains low for linear input polarization states (blue points). A linear state therefore leads to reduced sensitivity and dynamic range for depolarization measurements. Depolarization increases for elliptical states and reaches maximum sensitivity and dynamic range for circularly polarized input light (red points), which may be explained by the ellipsoidally shaped melanin particles of the RPE [38, 39]. The quantitative results in Figure 5 indicate how the depolarization changes as a function of azimuth angle, with more than two-fold increase from linearly to circularly polarized light. This is similar to the previous results with depolarization from GNRs [25].
FIGURE 4.
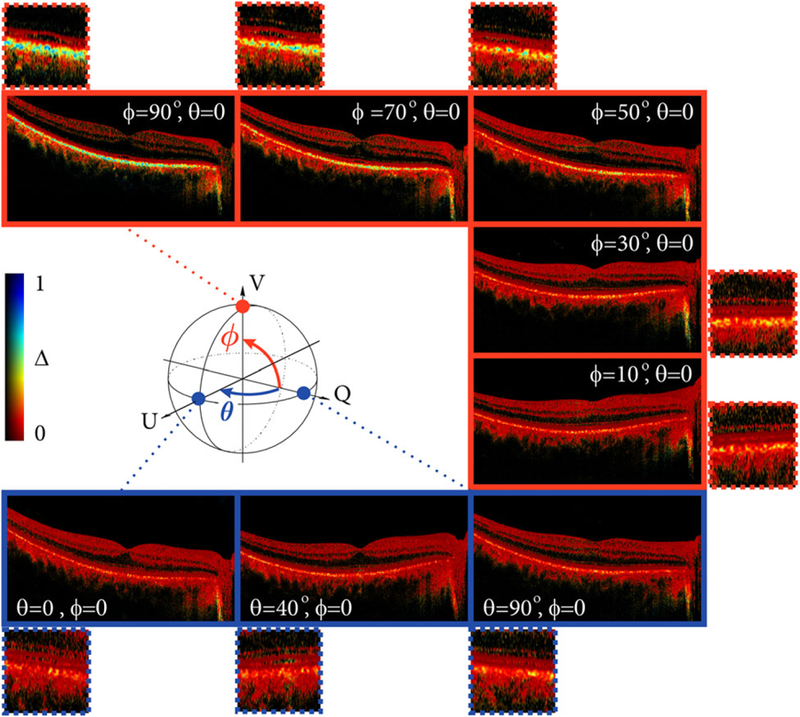
Cross-sectional images of the fovea showing depolarization (ΔDOP = 1 − DOP). The polarization state incident at the sample was calibrated using a polarimeter at the location of the sample. The Poincaré sphere illustrates the variation of input states. The polarization states were varied from linear horizontal to linear 45° polarization (θ, blue) and from linear horizontal to circular polarization (ϕ, red)
FIGURE 5.
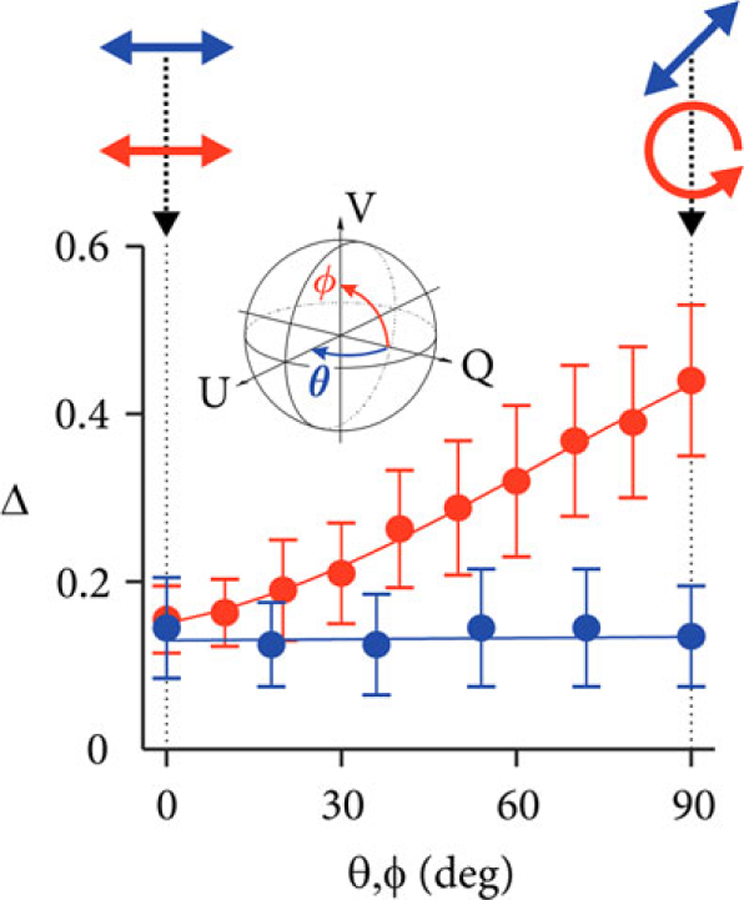
Quantitative analysis of depolarization (ΔDOP = 1 − DOP) of the RPE similar to the qualitative images shown in Figure 4. The polarization state incident at the sample was calibrated using a polarimeter at the location of the sample. The inset illustrates the variation of input states on the Poincaré sphere. The polarization states were varied from linear horizontal to linear 45° polarization (θ, blue points) and from linear horizontal to circular polarization (ϕ, red points)
To obtain maximum depolarization in a fiber based system, the input state can be referenced remotely to the eigenvectors (eigenpolarization) of a birefringent medium using a small portion of the input light [25, 40]. Alternatively, a measurement of the optical power (a small fraction of the sample illumination) after a linear polarizer can be used to calibrate a linear polarization state and thus obtain circular polarization after a quarter waveplate in front of the sample, adjusted at 45° with respect to the polarizer optic axis. This, however, is insufficient if the sample is birefringent since the polarization state would vary during propagation, resulting in a bias and underestimation of depolarization [24, 25]. All polarization-sensitive OFDI systems that use a single input polarization state are subject to this ambiguity. Note that many biological tissues exhibit birefringence, including the cornea [41], retinal nerve fiber layer [8, 42] and sclera [43] in the human eye, as well as tissue containing muscle, collagen and myelin, which emphasizes the need for an absolute measure of depolarization that is independent of the probing state.
4 |. DEFINITIVE DEPOLARIZATION
4.1 |. Theory
To overcome the shortcomings of the ΔDOP metric, the full Jones matrix, rather than a single Jones vector should be considered. The tomograms corresponding to the two orthogonal input states incident on the object simultaneously directly reveal the Jones matrix at sample depth z, Ψ(z) = Jout S(z)TS (z)JinI, where I is the identity matrix corresponding to the linearly polarized basis of the two orthogonal input states, Jin is the system input Jones matrix describing propagation from the polarization delay unit to the sample, S is the transformation through the sample to depth z and Jout describes the transformation from the sample to the polarization diverse receiver. The system was assumed free of polarization mode dispersion and any statistical variation of pure states in Ψ is solely caused by the sample S. The columns of Ψ provide two pure states, |Ψ1, 2, each of which can be used to obtain ΔDOP as described above. To obtain a measure of depolarization that is independent of the specific states JinI incident on the sample, Ψ can be transformed into a Müller-Jones matrix, where ⊗ is the Kronecker product and . Similar to the density operator of a mixed state, an ensemble of Jones matrices or Müller-Jones matrices is represented by a Müller matrix [37, 44], . Whereas DOP describes the depolarization of a specific input state, the full Müller matrix characterizes the sample and is independent of the effective incident or depth-dependent polarization state [24] and allows computing the depolarization power (index) [24, 45]. We previously have shown experimentally that this is similar to the average between ΔDOP = 1 − DOP for horizontal (ΔQ), 45°(ΔU) and circular (ΔV) input states [24]. This provides a robust and unambiguous measure of depolarization but only gives the average of the principle depolarization factors and does not offer the maximum detection sensitivity and dynamic range for a depolarization measurement that would be obtained when using circularly polarized light.
With an incident set of orthogonal states, it is possible to retrospectively synthesize this optimum state leading to maximum depolarization. This is true even when the polarization states incident on the sample are unknown. Two polarization states orthogonal in Jones space, |Ψ1, 2〉, offer a set of independent basis vectors that uniquely express other states as a linear combination in the vector space. Using this Jones vector synthesis (JVS), the optimum state is expressed as , where δ and φ are adjusted to maximize depolarization [25]. Polar decomposition of the retrieved Müller matrix offers the algebraic tool to determine this optimum input state efficiently at each location throughout the tomogram. A detailed description can be found in Ref. [25]. The polar decomposition (PD) separates any Müller matrix M into three components: a diattenuator, Mμ, followed by a retarder, MR, then followed by a depolarizing element, MΔ, isolating the depolarizing element MΔ = MMμ−1MR−1 from the non-depolarizing contribution [46]. MΔ = [1, 0; P, mΔ] can be further decomposed into the polarizance, P, and a three by three matrix acting only on the polarized components of the Stokes vector, mΔ. Assuming negligible polarizance, the eigenvalues and eigenvectors of mΔ entirely characterizes the sample depolarization properties. Selecting the eigenvector corresponding to the smallest of three eigenvalues, υΔmin inflicts the maximum possible depolarization, visualized as Δmax = 1 − υΔmin for display [25].
4.2 |. Definitive depolarization of the RPE
Using both depth-encoded input polarization states available in the data sets used for the DOP analysis above, we performed Jones vector synthesis and polar decomposition. The ΔDOP in Figure 6A exhibits poor depolarization from the RPE that would make the monitoring of disease progression challenging. The input polarization state was calibrated to be linearly polarized at the eye in this case, corresponding to the most unfavorable scenario for DOP measurements. In the case of Figure 6A, only one PDU polarization channel was used to compute ΔDOP and the other one was ignored for this analysis. JVS was applied by iteratively updating δ and φ and converging to maximum depolarization within a selected region of interest in the RPE. The solution is expected to correspond to circular polarization at the RPE and accordingly provide maximum depolarization as seen in Figure 6B. Finding a solution for each pixel using JVS seems feasible but is computationally expensive. In a scenario of multiple depolarizing sites and a sample that is birefringent, JVS compromises depolarization before or after a birefringent sample region if only optimized for a selected region of interest [25]. To obtain definitive depolarization irrespective of birefringence and probing states, we computed Δmax, visualized in Figure 6C. This approach yields maximum depolarization at any sample location and thus offers a definitive measurement that allows quantitative comparison. The image contrast for JVS and PD is similar because the eye does not have significant variations in its birefringence in the tissue layers that precede the RPE. However, it has been shown that PD outperforms JVS in more complex (strongly birefringent) samples [25]. Furthermore, applying JVS could be challenging when using rotating catheters, where the probing state is continuously changed across A-lines and where polar decomposition provides the locally strongest definitive depolarization more effectively.
FIGURE 6. Cross-sectional images of the fovea in vivo.
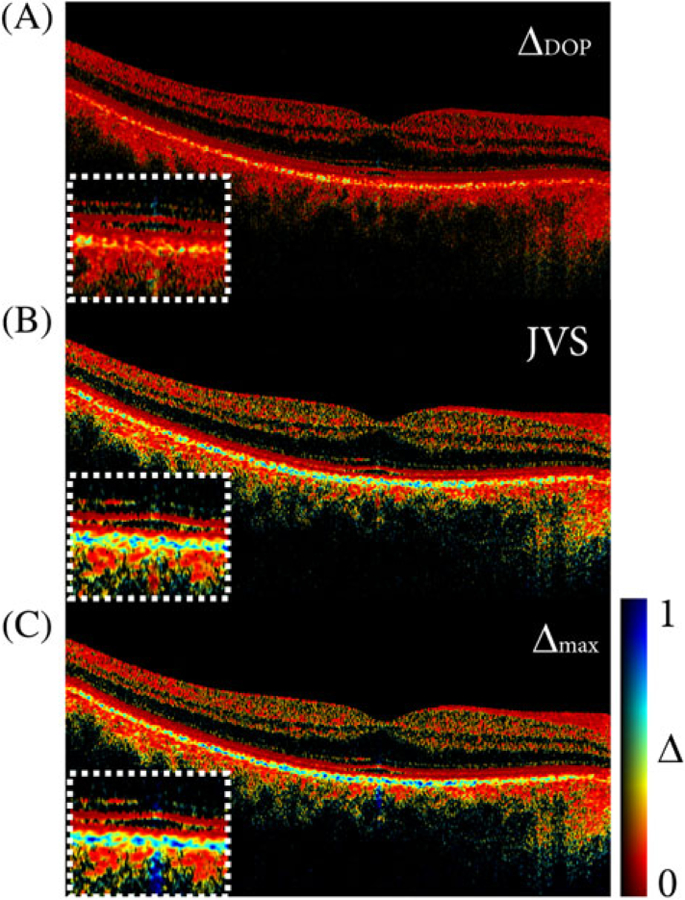
(A) Depolarization based on the DOP for a linearly polarized input state.
(B) Depolarization based on Jones vector synthesis (JVS).
(C) Depolarization based on Müller matrix polar decomposition (PD), showing Δmax. All images were obtained from the same data set. A fixed color scale was used to compare the difference in dynamic range
Finally, in Table 1 we compare the two different depolarization metrics, ΔDOP and Δmax for varying (controlled) input polarization states (Sin). Unlike ΔDOP, Δmax always describes the maximum depolarization from the RPE. The principle depolarization factor remains constant for all input states with a mean value of 0.45. Even for a circular input polarization state, polar decomposition provided higher depolarization from the RPE compared to ΔDOP. We attribute this observation to the fact that other components of the eye (eg, the cornea) are slightly birefringent and alter the input polarization from its calibrated circular state in front of the eye upon propagation to the RPE. Δmax was marginally fluctuating across different input polarization states. Nonparametric statistical testing (Mann-Whitney U test) revealed the insignificance of this fluctuation. The independent measurements were shown to be statistically equivalent with a P-value of 0.052 when comparing all distributions of the different input polarization states, confirming the null-hypothesis that the samples are from equal distributions. For further validation, P-values between 0.064 and 0.83 were obtained when comparing Δmax from the various input polarization states with Δmax from the data set of a linearly polarized input state, all supporting the null-hypothesis. In contrast, comparing the ΔDOP measurements among the different input states resulted in P-values below 10−4, highlighting the significant statistical difference between these measurements. The statistical robustness of Δmax makes it an attractive metric for quantitative analysis of depolarization.
TABLE 1.
Comparison of ΔDOP and Δmax for different polarization states incident at the eye ϕ and θ correspond to latitudinal and longitudinal angles on the Poincaré sphere, respectively. Sin corresponds to the calibrated input state. Numbers in parentheses show SD
| θ (∘) | ϕ (∘) | Sin | 1-DOP | Δmax |
|---|---|---|---|---|
| 90 | 0 | [1 0 0] | 0.18(0.1) | 0.44(0.17) |
| 0 | 0 | [0 1 0] | 0.17(0.1) | 0.43(0.15) |
| 0 | 10 | [0 0.98 0.17] | 0.18(0.1) | 0.42(0.16) |
| 0 | 20 | [0 0.94 0.34] | 0.22(0.1) | 0.47(0.18) |
| 0 | 30 | [0 0.87 0.5] | 0.24(0.12) | 0.45(0.19) |
| 0 | 40 | [0 0.77 0.64] | 0.26(0.13) | 0.44(0.17) |
| 0 | 50 | [0 0.64 0.77] | 0.29(0.15) | 0.44(0.17) |
| 0 | 60 | [0 0.5 0.87] | 0.32(0.16) | 0.45(0.16) |
| 0 | 70 | [0 0.34 0.94] | 0.34(0.15) | 0.47(0.18) |
| 0 | 80 | [0 0.17 0.98] | 0.38(0.17) | 0.45(0.18) |
| 0 | 90 | [0 0 1] | 0.41(0.17) | 0.48(0.19) |
5 |. OUTLOOK AND CONCLUSION
Conventional measurements of the degree of polarization depend on the orientation of the polarization state and thus are vulnerable to sample birefringence. Accurate and robust measures of depolarization may improve the diagnostic capabilities, for example when identifying the presence of lipid in coronary arteries or assessing pathologic features to monitor AMD in the eye. In OFDI, a metric of depolarization can be obtained synthetically by reconstructing a mixed state from coherent measurements through a spatial density operator. The operator size is crucial for an unambiguous and quantitative comparison of depolarization. We have demonstrated that circularly polarized light offers maximum detection sensitivity and dynamic range for a depolarization measurement in the RPE. However, controlling the incident polarization state is not sufficient if a sample is birefringent. Jones vector synthesis offers maximum depolarization from unknown input states but fails for more complex samples and systems with changing fiber birefringence (eg, rotating fiber catheters). Polar decomposition of Müller matrices provides the principle depolarization factors and maximum sample depolarization, thereby allowing a full quantitative depolarization analysis.
ACKNOWLEDGMENTS
This work was supported in part by the National Institute of Health (NIH) grant P41EB-015903 and by Heidelberg Engineering.
Funding information
Heidelberg Engineering; National Institutes of Health, Grant/Award Number: P41EB-015903
Footnotes
Financial disclosure
W.-Y.O., B.V. and B.E.B. are inventors on patents assigned to Massachusetts General Hospital that relate to the subject matter of this report. As such, they may share in royalties associated with the license of such patents.
REFERENCES
- [1].Schotland RM, Sassen K, Stone R, J. Appl. Meteorol 1971, 10(5), 1011. [Google Scholar]
- [2].Gross A, Post MJ, Hall FF, Appl. Opt 1984, 23(15), 2518. [DOI] [PubMed] [Google Scholar]
- [3].Williams MW, Appl. Opt 1986, 25(20), 3616. [DOI] [PubMed] [Google Scholar]
- [4].Guo X, Wood MFG, Ghosh N, Vitkin IA, Appl. Opt 2010, 49(2), 153. [DOI] [PubMed] [Google Scholar]
- [5].Puentes G, Voigt D, Aiello A, Woerdman JP, Opt. Lett 2005, 30(23), 3216. [DOI] [PubMed] [Google Scholar]
- [6].Adie SG, Hillman TR, Sampson DD, Opt. Express 2007, 15(26), 18033. [DOI] [PubMed] [Google Scholar]
- [7].Götzinger E, Pircher M, Geitzenauer W, Ahlers C, Baumann B, Michels S, Schmidt-Erfurth U, Hitzenberger CK, Opt. Express 2008, 16(21), 16410. [DOI] [PMC free article] [PubMed] [Google Scholar]
- [8].Cense B, Chen TC, Park BH, Pierce MC, de Boer JF, Invest. Ophthalmol. Vis. Sci 2004, 45(8), 2606. [DOI] [PubMed] [Google Scholar]
- [9].Miura M, Yamanari M, Iwasaki T, Elsner AE, Makita S, Yatagai T, Yasuno Y, Invest. Ophthalmol. Vis. Sci 2008, 49(6), 2661. [DOI] [PMC free article] [PubMed] [Google Scholar]
- [10].Michels S, Pircher M, Geitzenauer W, Simader C, Götzinger E, Findl O, Schmidt-Erfurth U, Hitzenberger CK, Br. J. Ophthalmol 2008, 92(2), 204. [DOI] [PubMed] [Google Scholar]
- [11].Pircher M, Götzinger E, Leitgeb R, Sattmann H, Findl O, Hitzenberger C, Opt. Express 2004, 12(24), 5940. [DOI] [PubMed] [Google Scholar]
- [12].Yamanari M, Makita S, Yasuno Y, Opt. Express 2008, 16(8), 5892. [DOI] [PubMed] [Google Scholar]
- [13].Pircher M, Hitzenberger CK, Schmidt-Erfurth U, Prog. Retin. Eye Res 2011, 30(6), 431. [DOI] [PMC free article] [PubMed] [Google Scholar]
- [14].Pircher M, Goetzinger E, Leitgeb R, Hitzenberger CK, Phys. Med. Biol 2004, 49(7), 1257. [DOI] [PubMed] [Google Scholar]
- [15].Baumann B, Götzinger E, Pircher M, Hitzenberger CK, J. Biophoton 2009, 2(6–7), 426. [DOI] [PubMed] [Google Scholar]
- [16].Baumann B, Götzinger E, Pircher M, Sattmann H, J. Biomed. Opt 2010, 15(6), 061704 10.1117/1.3499420. [DOI] [PMC free article] [PubMed] [Google Scholar]
- [17].Ahlers C, Götzinger E, Pircher M, Golbaz I, Prager F, Schütze C, Baumann, Hitzenberger CK, Schmidt-Erfurth U, Invest. Ophthalmol. Vis. Sci 2009, 51(4), 2149. [DOI] [PMC free article] [PubMed] [Google Scholar]
- [18].Schütze C, Ritter M, Blum R, Zotter S, Baumann B, Pircher M, Hitzenberger K, Schmidt-Erfurth U, Retina 2014, 34(11), 2208. [DOI] [PubMed] [Google Scholar]
- [19].Schlanitz FG, Baumann B, Kundi M, Sacu S, Baratsits M, Scheschy U, Shahlaee, Mittermüller TJ, Montuoro A, Roberts P, Pircher M, Hitzenberger CK, Schmidt-Erfurth U, Br. J. Ophthalmol 2017, 101, 198. [DOI] [PMC free article] [PubMed] [Google Scholar]
- [20].Roberts P, Baumann B, Lammer J, Gerendas B, Kroisamer J, Bühl W, Pircher M, Hitzenberger CK, Schmidt-Erfurth U, Sacu S, Retina 2016, 57(4), 1595. [DOI] [PubMed] [Google Scholar]
- [21].Lo WCY, Villiger M, Golberg A, Broelsch GF, Khan S, Lian CG, Austen WG, Yarmush M, Bouma BE, Invest J, Dermatol 2016, 136(1), 84. [DOI] [PMC free article] [PubMed] [Google Scholar]
- [22].Villiger M, Otsuka K, Karanasos A, Doradla P, Ren J, Lippok N, Shishkov M, Daemen J, Diletti R, van Geuns R-J, Zijlstra F, van Soest G, Libby P, Regar E, Nadkarni SK, Bouma BE, JACC Cardiovasc. Imaging 2017. [DOI] [PMC free article] [PubMed]
- [23].Golde J, Tetschke F, Walther J, Rosenauer T, Hempel F, Hannig C, Koch E, Kirsten L, J. Biomed. Opt 2018, 23(7), 071203 10.1117/1.JBO.23.7.071203. [DOI] [PubMed] [Google Scholar]
- [24].Lippok N, Villiger M, Bouma BE, Opt. Lett 2015, 40(17), 3954. [DOI] [PMC free article] [PubMed] [Google Scholar]
- [25].Lippok N, Villiger M, Albanese A, Meijer EFJ, Chung K, Padera TP, Bhatia SN, Bouma BE, Nat. Photonics 2017, 11, 583. [DOI] [PMC free article] [PubMed] [Google Scholar]
- [26].Braaf B, Donner S, Nam AS, Bouma BE, Vakoc BJ, Biomed. Opt. Express 2018, 9(2), 486. [DOI] [PMC free article] [PubMed] [Google Scholar]
- [27].Braaf B, Vermeer KA, Sicam VADP, van Zeeburg E, van Meurs JC, de Boer JF, Opt. Express 2011, 19(22), 20889. [DOI] [PubMed] [Google Scholar]
- [28].Cense B, Nassif NA, Chen TC, Pierce MC, Yun SH, Park BH, Bouma BE, Tearney GJ, de Boer JF, Opt. Express 2004, 12, 2435. [DOI] [PubMed] [Google Scholar]
- [29].Lippok N, Coen S, Nielsen P, Vanholsbeeck F, Opt. Express 2012, 20(21), 23398. [DOI] [PubMed] [Google Scholar]
- [30].Braaf B, Vienola KV, Sheehy CK, Yang Q, Vermeer KA, Tiruveedhula P, Arathorn DW, Roorda A, de Boer JF, Biomed. Opt. Express 2013, 4(1), 51. [DOI] [PMC free article] [PubMed] [Google Scholar]
- [31].Götzinger E, Pircher M, Baumann B, Schmoll T, Sattmann H, Leitgeb RA, Hitzenberger CK, Opt. Express 2011, 19(15), 14568. [DOI] [PMC free article] [PubMed] [Google Scholar]
- [32].Setala T, Shevchenko A, Kaivola M, Friberg AT, Phys. Rev. A 2008, 78, 033817. [Google Scholar]
- [33].Réfrégier P, Setala T, Friberg AT, Proc. SPIE: Physical Optics, 8171, 2011 10.1117/12.896894. [DOI] [Google Scholar]
- [34].Baumann B, Zotter S, Pircher M, Götzinger E, Rauscher S, Glösmann M, Lammer J, Schmidt-Erfurth U, Gröger M, Hitzenberger CK, J. Mod. Opt 2015, 62(21), 1758. [DOI] [PMC free article] [PubMed] [Google Scholar]
- [35].Villiger M, Zhang EZ, Nadkarni S, Oh W-Y, Bouma BE, Vakoc BE, Opt. Lett 2013, 38(6), 923. [DOI] [PMC free article] [PubMed] [Google Scholar]
- [36].Gordon JP, Kogelnik H, PNAS 2000, 97(9), 4541. [DOI] [PMC free article] [PubMed] [Google Scholar]
- [37].Kim K, Mandel L, Wolf E, J. Opt. Soc. Am. A 1987, 4(3), 433. [Google Scholar]
- [38].Baumann B, Baumann SO, Konegger T, Pircher M, Götzinger E, Schlanitz F, Schütze C, Sattmann H, Litschauer M, Schmidt-Erfurth U, Hitzenberger CK, Biomed. Opt. Express 2012, 3(7), 1670. [DOI] [PMC free article] [PubMed] [Google Scholar]
- [39].Baumann B, Schirmer J, Rauscher S, Fialová S, Glösmann M, Augustin M, Pircher M, Gröger M, Hitzenberger CK, Invest. Ophthal- mol. Vis. Sci 2015, 56, 7462. [DOI] [PubMed] [Google Scholar]
- [40].Lippok N, Villiger M, Jun C, Bouma BE, Opt. Lett 2015, 40(9), 2025. [DOI] [PMC free article] [PubMed] [Google Scholar]
- [41].Götzinger E, Pircher M, Sticker M, Fercher AF, Hitzenberger CK, J. Biomed. Opt 2004, 9(1), 94. [DOI] [PubMed] [Google Scholar]
- [42].Cense B, Chen TC, Park BH, Pierce MC, de Boer JF, Opt. Lett 2002, 27(18), 1610. [DOI] [PubMed] [Google Scholar]
- [43].Baumann B, Götzinger E, Pircher M, Hitzenberger CK, Opt. Express 2007, 15(3), 1054. [DOI] [PMC free article] [PubMed] [Google Scholar]
- [44].Simon BN, Simon S, Mukunda N, Gori F, Santarsiero M, Borghi R, Simon R, J. Opt. Soc. Am. A 2010, 27(2), 188. [DOI] [PubMed] [Google Scholar]
- [45].Gil JJ, Bernabeu E, Optica Acta 1986, 33(2), 185. [Google Scholar]
- [46].Lu SY, Chipman RA, J. Opt. Soc. Am. A 1996, 13(5), 1106. [Google Scholar]


