Abstract
Purpose:
Blood oxygen level dependent (BOLD) MRI based on R2* measurements can provide insights into tumor vascular oxygenation. However, measurements are susceptible to blood flow, which may vary accompanying a hyperoxic gas challenge. We investigated flow sensitivity by comparing R2* measurements with and without flow suppression (fs) in two orthotopic lung xenograft tumor models.
Methods:
H460 (n=20) and A549 (n=20) human lung tumor xenografts were induced by surgical implantation of cancer cells in the right lung of nude rats. MRI was performed at 4.7 T after tumors reached 5–8 mm diameter. A multi-echo gradient echo MRI sequence was acquired with and without spatial saturation bands on each side of the imaging plane to evaluate the effect of flow on R2*. fs and non-fs R2* MRI measurements were interleaved during an oxygen breathing challenge (from air to 100% O2). T2*-weighted signal intensity changes (ΔSI(%)) and R2* measurements were obtained for regions of interest and on a voxel-by-voxel basis and discrepancies quantified with Bland-Altman analysis.
Results:
Flow suppression affected ΔSI(%) and R2* measurements in each tumor model. Average discrepancy and limits of agreement from Bland-Altman analyses revealed greater flow-related bias in A549 than H460.
Conclusion:
The effect of flow on R2*, and hence BOLD, was tumor model dependent with measurements being more sensitive in well-perfused A549 tumors.
Keywords: Flow-suppression, oxygen-sensitive MRI, hypoxia, blood oxygen level dependent (BOLD), lung cancer
Introduction:
Hypoxia is associated with tumor aggressiveness, metastatic spread and resistance to various treatments, particularly radiation therapy [1–3]. Several studies have demonstrated the connection of hypoxia with poor prognosis in lung cancer. Through examination of tumor samples from surgery, hypoxia-inducible factor (HIF)-1α [4, 5] and HIF-2α [4] have been identified as independent prognostic indicators in non-small-cell lung cancer (NSCLC). Eppendorf polarographic electrodes were used intra-operatively to measure human lung tumor oxygenation directly and relative hypoxia correlated with elevated levels of osteopontin, CAIX and poor prognosis in terms of local relapse and overall survival [6]. Imaging methods have also been explored including PET based on 18FMISO or 60Cu-ATSM [7, 8]. These studies provided evidence that hypoxia in lung cancer impacts treatment outcomes; however, the invasive nature of assessment techniques or the need for radioactive isotopes limited the feasibility of repeat measurements and general adoption of the techniques into clinic.
MR imaging methods have been developed to provide information regarding tumor oxygenation [9–11]. R2* is sensitive to the concentration of deoxyhemoglobin and changes in compartmentalized deoxyhemoglobin yield BOLD contrast [12–14]. Both semi quantitative T2*-weighted signal intensity changes and quantitative R2* measurements have been explored and gained popularity in cancer imaging due to the simplicity of the technique and clinical translatability [11, 15–18]. An intervention, such as hyperoxic gas challenge, is frequently used to perturb the biological system to obtain additional information on tumor oxygenation [12, 18–25]. However, BOLD signal is affected by a number of physiological factors in addition to oxygenation, notably blood flow, vascular volume, hematocrit and the Hill coefficient for oxygen binding to hemoglobin (itself sensitive to 2, 3-DPG, CO2 and pH [26]). Indeed, early studies coined the concept “flow and oxygen level dependent” (FLOOD) MRI contrast [27, 28], and a breathing gas intervention, such as oxygen challenge, may induce changes in blood flow, potentially affecting the BOLD signal [29].
The extent to which BOLD (viz R2*) is sensitive to potential flow changes has not previously been quantified in lung cancer models. We expected it to be particularly relevant and challenging for orthotopic lung tumors giving the proximity to major blood vessels and the potential motion artifacts. We have now examined and quantified the effect of flow on BOLD measurement by comparing two sequences with different flow suppression (fs) settings applied to two orthotopic lung xenograft tumor models.
Methods:
Cell Preparation
Luciferase transfected human lung tumor cells were kindly provided by Professor John Minna. Briefly, the A549-luc and H460-luc human lung cancer cells (ATCC, Manassas, VA) were established using a lentivirus encoding the luciferase gene driven by a ubiquitin promoter. Stable clones were then isolated by G418 selection. The cells were incubated in Dulbecco’s modified Eagle’s medium (DMEM) with 10% fetal bovine serum (FBS), 1% L-glutamine and 1% penicillin-streptomycin at 37 oC with 5% CO2. Once 80% confluence was reached, the cells were harvested, and suspended in serum-free medium and 50% Matrigel (BD Biosciences, Mississauga, Canada).
Surgical Orthotopic Tumor model
All animal procedures were approved by the Institutional Animal Care and Use Committee of the University of Texas Southwestern Medical Center. The surgical procedure was described previously [30]. Briefly, female nude rats (8–10 weeks old, 150–200 g; National Cancer Institute, Frederick, MD) were anesthetized and placed onto a Hallowell tilting workstation (Hallowell EMC, Pittsfield, MA). One to two drops of 2% lidocaine were applied to the back of the mouth to locally anesthetize the epiglottis. The rats were then intubated and connected to the ventilator. Anesthesia was maintained with 2% isoflurane in oxygen, and the ventilator was set to achieve a tidal volume of approximately 10 ml/kg and a respiratory rate of 79–90 breaths/min. A 1–2 cm incision was made in the shaved and cleaned skin over the 5th and 6th ribs on the right side of the chest and the muscle was bluntly dissected. The chest wall was opened with an incision through the 5th and 6th intercostal space. The bottom lobe of the right lung was carefully exteriorized using curved forceps, and a portion of the tissue was clamped with a microvascular clamp. A cell suspension (3×10⁶ H460-luc or A549-luc human lung cancer cells in 15 μl) was injected into the isolated lung using a 28-gauge insulin syringe with a total of 40 rats (20 with H460-luc and 20 with A549-luc).
Bioluminescence imaging (BLI)
BLI was performed weekly using an IVIS® Lumina or Spectrum Imaging System (Xenogen/Caliper Life Sciences, Alameda, CA). Rats were anesthetized by 2% isoflurane inhalation followed by SC injection of D-luciferin (150 mg/kg; Gold Biotechnology, St. Louis, MO) [30]. BLI was acquired 10 min after luciferin injection with typical images shown in Supporting Information Figure S1.
MRI
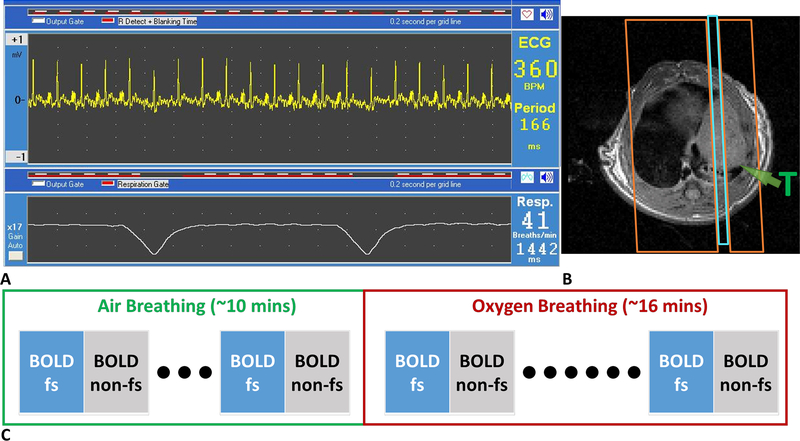
MRI was performed using a horizontal bore 4.7-T magnet (Agilent Technologies, Santa Clara, CA, USA) with a Doty rat body coil (Doty Scientific, Columbia, SC, USA). Animals were anesthetized with isoflurane (2%) in air (1 L/min) and kept warm with a circulating warm water blanket. Body temperature and respiration were monitored with a small animal physiological monitoring system (Small Animal Instruments Inc., Stony Brook, NY) throughout the experiment. Shimming was performed on the water resonance achieving a half-maximum linewidth of 150 Hz or narrower on each occasion. T1-weighted images were acquired to provide anatomical information using a fast spin-echo (FSE) sequence: TR = 500 ms; effective TE = 10 ms; echo train length = 2; slice thickness =2 mm; field of view 50 × 50 or 55 × 55 mm; and matrix size 128 × 128. BOLD MRI (multi-echo gradient echo; TR = 150 ms, ten echo times from 2 to 29 ms, flip angle = 20°) was acquired with the intervention of an oxygen breathing challenge (from air to 100% O2). Images were acquired in the sagittal plane. BOLD was acquired with ECG and respiratory triggering to reduce motion artifacts (Fig. 1A). Spatial saturation bands were placed on each side of the imaging plane (Fig. 1B) for flow suppression (fs). Five sets of maps interleaved with and without fs were acquired during air breathing and eight sets during oxygen breathing (Fig. 1C).
Figure 1. BOLD experiment design to assess flow sensitivity.
A. ECG and respiration trigger setting. B. Placement of spatial saturation bands (orange boxes) on both sides of imaging plane (blue box). Green arrow indicates a single nodular tumor in the lung. C. The scan scheme shows the interleaved acquisition of BOLD with and without flow suppression (fs).
Histology
Following MRI some animals were sacrificed and tumors resected for histology. Tissues were placed in liquid nitrogen and formalin. Slides for hematoxylin and eosin (H&E) were fixed in 4% PFA, rinsed and then subjected to a progressive staining line containing Leica Selectech reagents (Hematoxylin 560 and Alcoholic Eosin-Y 515) according to well established standard protocols [21, 31]. At the time of imaging, multiple 1600 × 1200 pixel subfields were acquired to cover the entire tumor and surrounding tissue at 10x objective magnification on a Nikon E600 compound photomicroscope (Melville, NY) equipped with epi-fluorescence and bright-field illumination, an Applied Scientific Instruments x-y-z motorized stage (Eugene, OR) and Nikon DS-Fi2 CCD camera. Stage registry, illumination and camera were controlled by Nikon Imaging Solution Elements v4.20.00 software.
Data Analysis
Data were processed on a voxel by voxel basis using Matlab and statistical analysis performed on both voxel by voxel and regional basis. Regions of interest were identified and outlined using respiratory- and ECG-triggered T1-weighted images.
R2* was generated by fitting the signal intensity of the multi-echo gradient echo images to TE as a monoexponential function on a voxel-by-voxel basis:
| [Eq. 1], |
where SI is the signal intensity at each TE, S0 represents the net magnetization. A constant k was included as a precaution for possible long T2 component in the voxel, but was ultimately found to be close to zero most of the time or at maximum about 2% of S0. Starting values of S0 and R2* for curve fitting were calculated by first solving Eq. 1 based on SI at the first two TE values [20, 32]. R2>0.8 was set as a threshold to ensure curve fitting reliability.
The change of R2* (ΔR2*) due to 100% O2 challenge was then calculated as:
| [Eq. 2] |
Semi-quantitative percentage signal intensity changes (ΔSI(%)) were calculated using the images acquired at TE = 8 ms. ΔSI(%) was calculated as:
| [Eq. 3], |
where is the mean signal intensity during air breathing and is the mean signal intensity of the last five time points during 100% O2 breathing. The TE = 8 ms was chosen to match the typical R2* of about 120 s−1.
Discrepancy of measurements in all four parameters (R2*air, R2*O2, ΔR2* and ΔSI(%)) with fs and non-fs settings was quantified with Bland-Altman analysis to obtain the average and standard deviation of discrepancy. Differences of two sequences were taken as non-fs minus fs. Student’s t-tests were used to investigate if there were significant differences in ΔSI(%), R2*(air), R2*(O2) and ΔR2* between H460 and A549 tumors. Paired t-tests were conducted to examine if there were significant differences in R2*(air), R2*(O2), ΔR2* and ΔSI(%) between fs and non-fs.
Results:
Characteristics of BOLD in the two lung tumor models
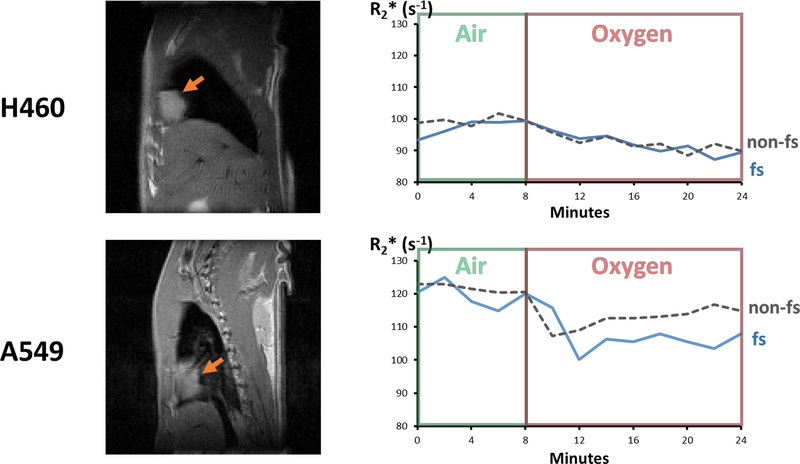
Interleaved BOLD sequences with and without fs were successfully acquired in 38 of 40 orthotopic lung tumors. Two A549 tumors were so small as to provide very few voxels in the MRI plane and obvious through plane partial volume effects and these were omitted from analysis. The effectiveness of flow suppression was emphasized by comparison of signal intensity (S0) maps (Supporting Information Figure S2). Dynamic R2* measurements with and without fs responded similarly to the oxygen breathing challenge over time, as shown for size matched H460 and A549 tumors (Fig. 2). A range of responses was observed (Supporting Information Figure S3), however most tumors showed a positive change in the semi-quantitative signal intensity ΔSI(%) and negative quantitative ΔR2* indicating improved oxygenation in response to oxygen breathing challenge. Comparing the two tumor types, more A549 tumors were responsive (83%) than H460 (55%).
Figure 2. R2* response to oxygen breathing challenge in size-matched H460 and A549 orthotopic lung tumor xenografts growing in right lung of nude rats.
Left: sagittal T1-weighted images showing central tumor cross section. Orange arrows indicate tumors in the lung. Right: dynamic variation in mean tumor R2* with respect to oxygen breathing challenge using flow suppressed or non-flow suppressed acquisition.
H460 tumors had significantly lower mean R2* than A549 while rats breathed air or oxygen, as assessed with or without fs (Table 1). Meanwhile, A549 tumors showed a significant response to oxygen breathing challenge, which was significantly greater than for H460 when fs was applied. Paired t-tests showed that quantitative R2* measurements were significantly different with and without fs for A549 tumors, but only for air breathing in H460.
Table 1. Summary of fs and non-fs BOLD measurements in H460 and A549 tumors.
From A to D: ΔSI(%), R2*(air), R2*(O2) and ΔR2*. Values in the cells are mean±std (range: minimum to maximum). p-values were calculated from unpaired two-sample Student’s t-test for H460 vs. A549 and paired t-test for fs vs. non-fs.
| A. ΔSI(%) | |||
|---|---|---|---|
| fs | non-fs | p-value (fs vs non-fs) | |
| H460 | 2.1±9.4 (−27.1 to 16.9) | 3.4±8.9 (−20.0 to 19.5) | 0.048* |
| A549 | 8.7±12.9 (−9.5 to 43.1) | 10.0±10.9 (−9.1 to 32.2) | 0.45 |
| p-value (H460 vs A549) | 0.076 | 0.046* | |
| B. R2*air(s−1) | |||
|---|---|---|---|
| fs | non-fs | p-value (fs vs non-fs) | |
| H460 | 86.2±19.8 (55.9 to 128.5) | 87.3±20.0 (56.4 to 129.3) | 0.0009* |
| A549 | 116.4±21.9 (85.0 to 171.6) | 119.4±22.2 (83.8 to 166.7) | 0.017* |
| p-value (H460 vs A549) | 8×10⁻⁵* | 4×10⁻⁵* | |
| C. R2*O2(s−1) | |||
|---|---|---|---|
| fs | non-fs | p-value (fs vs non-fs) | |
| H460 | 86.3±21.7 (54.5 to 133.1) | 86.7±21.8 (51.2 to 133.2) | 0.4 |
| A549 | 109.4±20.1 (79.1 to 146.3) | 115.1±22.5 (80.7 to 145.9) | 1×10⁻⁴* |
| p-value (H460 vs A549) | 0.002* | 0.0003* | |
| D. ΔR2*(s−1) | |||
|---|---|---|---|
| fs | non-fs | p-value (fs vs non-fs) | |
| H460 | 0.1±5.5 (−10.1 to 11.9) | −0.7±5.7 (−9.8 to 12.4) | 0.12 |
| A549 | −7.1±8.1 (−25.3 to 4.3) | −4.3±7.9 (−21.2 to 9.2) | 0.007* |
| p-value (H460 vs A549) | 0.03* | 0.11 | |
indicates p<0.05.
Flow effects on average values of tumor ROIs
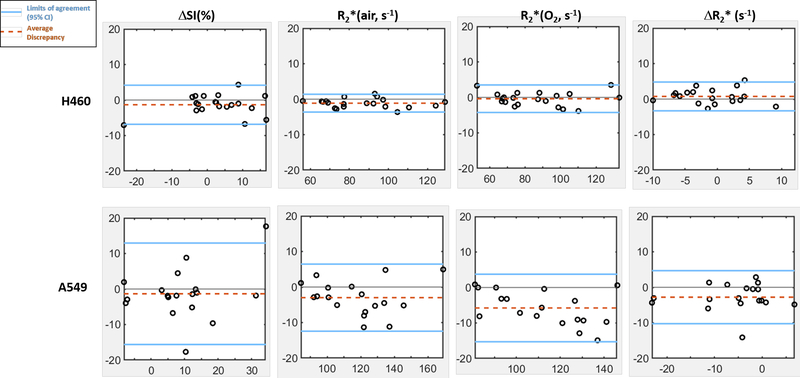
Bland-Altman analyses of mean tumor values of H460 (n=20) and A549 (n=18) tumors indicated that the sensitivity of BOLD measurement to flow is tumor type dependent (Fig. 3). Specifically, the average discrepancy (dotted orange line) indicated greater differences between the measurements of fs and non-fs BOLD in A549 than H460. The limits of agreement (solid blue line; defined as 95% confidence interval) were also greater in A549 than H460, suggesting a higher sensitivity to flow effects in A549. The limits of agreement for the semi quantitative ΔSI(%) were much wider compared with the quantitative measurements (R2*(air), R2*(O2) and ΔR2*).
Figure 3. Higher flow-related discrepancy in mean ROI values was observed in A549 than H460 tumors (H460: n=20; A549: n=18).
In each Bland-Altman plot, y-axis is the difference of measurements with and without fs and x-axis is the average of the two measurements. Solid blue lines show the limits of agreement, defined as 95% confidence interval (1.96 x standard deviation), and the dotted orange lines represent the average discrepancy. Greater average discrepancy was observed in A549 tumors in all BOLD measurements except ΔSI(%). Wider limits of agreement were found in A549 in all four BOLD measurements.
Flow effects on spatial patterns
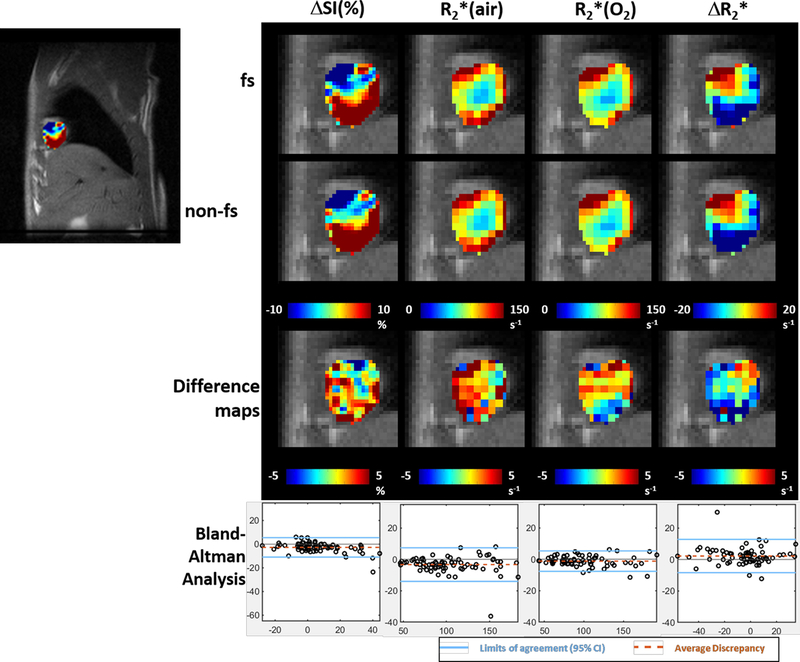
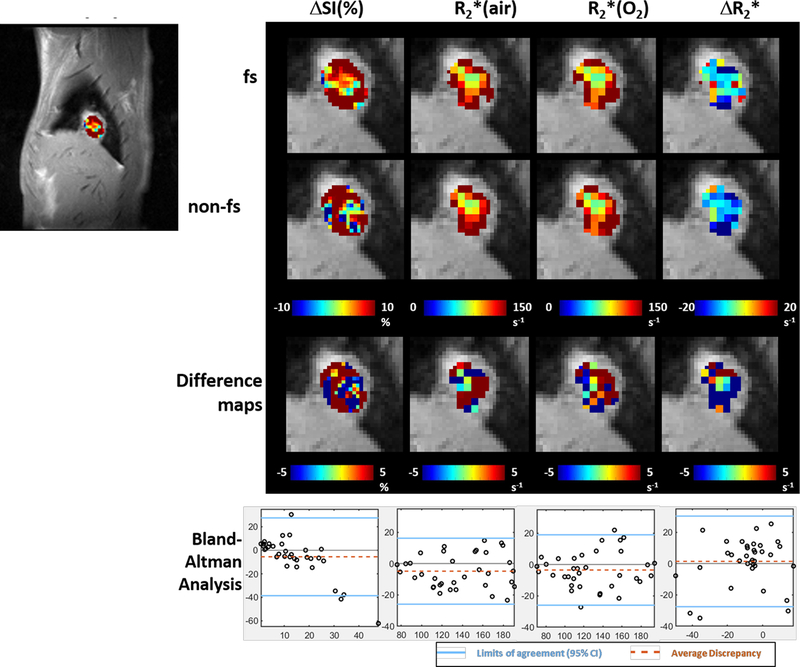
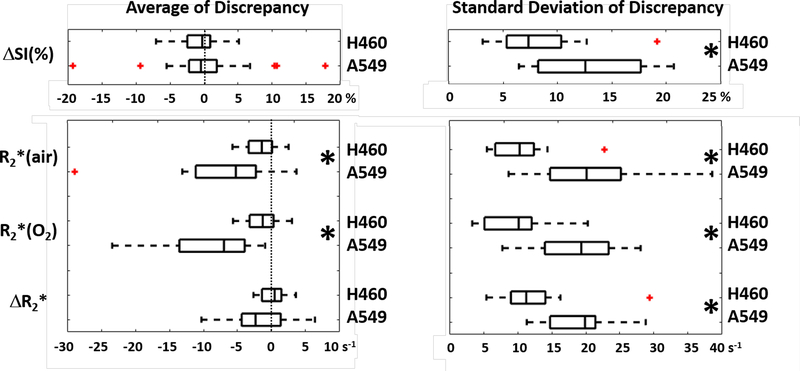
Distinct intratumoral heterogeneity was observed in all parametric maps in both tumor models (Figs. 4 and 5). Voxel-by-voxel comparison of fs and non-fs BOLD parametric maps appeared similar, but Bland-Altman analysis revealed larger average discrepancy and wider limits of agreement in spatial patterns of A549 compared to H460 tumors (Fig. 6).
Figure 4. Parametric maps of an H460 lung tumor showed high similarity in spatial patterns.
Far left ΔSI(%) map overlaid on sagittal image of orthotopic lung tumor. Color images show expanded parametric maps: from left to right: ΔSI(%), R2*(air), R2*(oxygen) and ΔR2*. From top to bottom: maps with fs, without fs, difference maps (non-fs minus fs), Bland-Altman analysis on voxels from the maps. In Bland-Altman plot, y-axis is the difference of measurements from the two settings and x-axis is the average of the two settings. Solid blue lines show the limits of agreement which is defined at 95% confidence interval and the dotted orange lines represent the average discrepancy.
Figure 5. Parametric maps of an A549 lung tumor showed high similarity in spatial patterns with greater discrepancy compared to H460.
Far left ΔSI(%) map overlaid on sagittal image of orthotopic lung tumor. Color images show expanded parametric maps: from left to right: ΔSI(%), R2*(air), R2*(oxygen) and ΔR2*. From top to bottom: maps from fs setting, non-fs setting, difference maps (non-fs setting – fs setting), Bland-Altman analysis on voxels from the maps above. In Bland-Altman plot, y-axis is difference of measurements from the two settings and x-axis is the average of the two settings. The solid blue lines show the limits of agreement and the dotted orange lines represent the average discrepancy.
Figure 6. Higher flow-related discrepancy in spatial patterns was observed in A549 than H460 tumors (H460: n=20; A549: n=18).
Greater average and standard deviation of discrepancy was found in A549 compared to H460 tumors. Left panel: Average discrepancy of BOLD ΔSI(%), R2*(air), R2*(oxygen) and ΔR2* from fs and non-fs settings. Zero discrepancy (i.e., no difference) is marked with dotted lines. Right panel: standard deviation of discrepancy of BOLD ΔSI(%), R2*(air), R2*(oxygen) and ΔR2* from fs and non-fs settings. Smaller values indicate better agreement. * indicates p<0.05. The Tukey boxplots indicate median, and inter quartile range and whiskers extend 1.5x further providing about 99% of distribution. Outliers are indicated in red.
Histological differences revealed by H&E
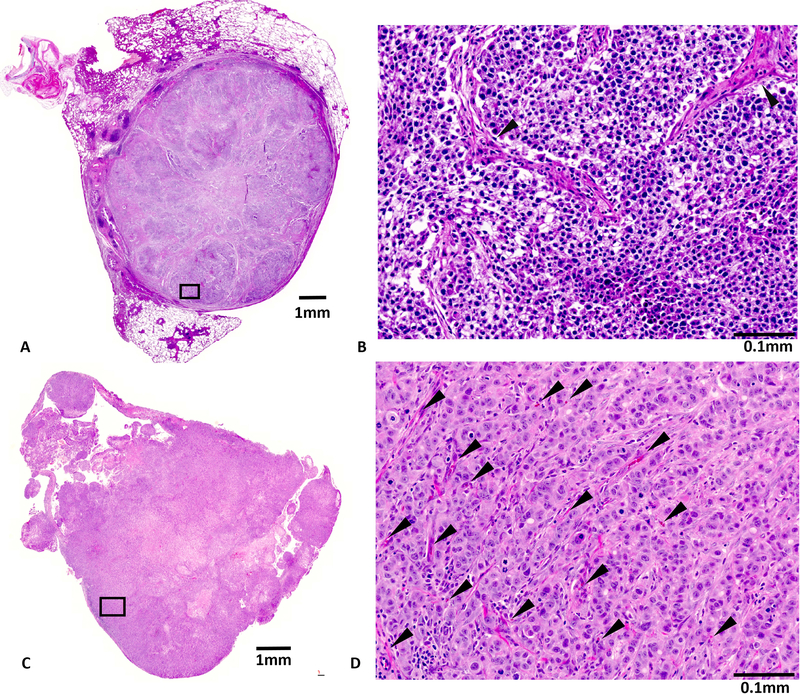
Histology revealed extensive avascular areas in H460 (Fig. 7 A&B), while A549 was well vascularized (Fig. 7 C&D) and each tumor type showed only small areas of necrosis.
Figure 7. Histology of H460 and A549 tumors.
H&E staining of whole mount slices and expanded regions. (A) The H460 tumor appeared to be rather avascular with extensive desmoplastic reaction and some necrotic regions. (B) No vessels can be identified in the expanded region. Arrows indicate fibroblasts. (C) The A549 tumor appeared to be very well vascularized in most parts of the tumor with some necrotic areas in the center. (D) Expanded region. Arrows indicate blood vessels.
Discussion:
Oxygen sensitive MRI was successful in orthotopic lung tumors growing in rats with respect to oxygen breathing challenge. Respiratory- and ECG-triggering facilitated effective acquisition of quantitative R2* maps with or without flow suppression. The general trends in responses were similar with or without flow suppression, but Bland Altman analysis revealed significant bias in the measurements for the better vascularized A549 tumor in the absence of flow suppression.
Many studies have considered flow effects on BOLD signal response [33, 34], but most have focused on vasodilation rather than flow itself. The pioneering work of Griffiths et al. examined hyperoxic and hypercapnic gases and reported very different behavior in various tumors [35] which could be related to the extent of vascularization [27, 36]. Notably, well perfused G3H tumors showed strong effects, whereas poorly perfused RIF-1 showed much less [35] and these differences were related to radiation response [37]. Historically carbogen (95%O2 plus 5%CO2) was a favored intervention in radiation oncology, but increasingly oxygen is being evaluated, as applied here, to avoid the respiratory distress.
In early studies, we applied a pulse burst saturation sequence prior to echo planar imaging (EPI) to detect semi quantitative BOLD responses in Dunning prostate AT1 tumors, which effectively removed flow effects [14, 38]. EPI is particularly effective at revealing changes in susceptibility associated with hemoglobin saturation, but is also subject to image distortions, whereas gradient recalled echo (GRE) sequences provide much better image definition. Saturation bands are widely used to reduce motion, flow and vessel/CSF pulsation artifacts [39, 40]. It is also used routinely in time-of-flight (TOF) MR angiography [41–43]. However, those applications are mostly focused on the flow effect of large blood vessels with rapid blood flow. The vascular network in tumors is often chaotic, tortuous and with irregular diameters and flow rate.
The effect of flow is well-known with respect to BOLD measurements. Howe et al. demonstrated the flow effect on traditional BOLD measurements and suggested the term FLOOD (Flow and Oxygen level Dependent contrast) to emphasize the importance of flow in tumor studies [27, 28]. They suggested additional measurements to account for flow when interpreting BOLD results. The FLOOD studies particularly focused on blood flow modifiers (carbogen or carbogen + nicotinamide). Oxygen breathing is known to affect blood pressure and may cause vascular contraction and therefore a change blood flow, but this is mostly observed in normal vasculature [44]. Due to the lack of systemic regulation and smooth muscle lining in tumor vasculature, oxygen challenges are often assumed to have less effect on the blood flow in tumors, especially in subcutaneous models with associated ectopic vasculature.
In this study, we implemented a simple spatial saturation technique to remove the flow component and compared the measurements with the standard non-fs BOLD measurements. Susceptibility artefacts from tissue/air interfaces are a major challenge for gradient echo imaging of tumors in the lung. Images were inspected to avoid inclusion of areas of severe partial volume at the edge of small tumors and a threshold R2> 0.8 was applied for acceptable R2* curve fitting on each voxel. We quantified the flow effect on four BOLD measurements (ΔSI(%), R2*(air), R2*(O2) and ΔR2*) using two different orthotopic lung cancer rat models. We found that flow affected all four BOLD measurements in each tumor type, however, the sensitivity to the flow effect was different depending on the type of measurement and tumor model. Bias in measurements from flow was much smaller in the poorly vascularized H460 tumors, as compared with A549 tumors based on the Bland Altman analysis (Figs. 3–6). Considering either regions of interest defining the tumors (Fig. 3) or assessing individual voxels (Fig. 6), the average discrepancy observed with or without fs was much smaller in H460 than A549 tumors.
Histology revealed that the two tumor types have very different vascular patterns when growing in the orthotopic location in rats. H460 were sparsely vascularized, whereas the A549 had extensive capillaries (Fig. 7). The architecture of A549 tumors was also different in the orthotopic setting compared to the subcutaneous site, where a multinodular structure was observed with very sparse vasculature generally limited to the stromal bed around the nodules [32]. This is also distinct from the vasculature reported for A549 growing subcutaneously in nude mice [45]. Others have reported substantially different patterns of vasculature and hypoxia in lung tumors developing spontaneously in transgenic mice or implanted subcutaneously (SC) or orthotopically [46, 47]. The significantly higher R2* in A549 tumors is consistent with extensive vasculature. We previously reported a typical BOLD signal response of 2 to 3 % for subcutaneous A549 compared with the 8 to 10% observed in the orthotopic setting using the same pulse sequence, though with the different TE required to match the observed T2*. A more rigorous comparison is R2*, which indicated ~120 s−1 for orthotopic A549 tumors here versus 58 s−1 for subcutaneous tumors [32]. We note that some values are greater than typically reported for tumors previously, but previous studies of SC tumors reported a mean value of 101.4 s−1 was reported for G3H prolactinomas (with a range 75–140 s−1) [37] and values as high as 110 s−1 for DU-145 tumors and 130 s−1 for PC3 tumors at 4.7 T [48]. We are unaware of other studies of orthotopic lung tumors using oxygen sensitive MRI. Although, other studies have examined human lung tumor xenografts growing subcutaneously in rats [32] and mice [49].
We note relatively few previous reports of oxygen sensitive MRI in lung tumors. Ohno et al. did incidentally report on a lung tumor and stated that there was minimal BOLD response to oxygen breathing challenge compared to the surrounding lung [50]. Small studies of oxygen sensitive MRI have been reported for human lung tumors, which indicated detectable BOLD changes [51] and recently R1 changes [52] with respect to an oxygen gas breathing challenge. Most studies of human lung have focused on COPD and asthma, thereby examining the lung itself [53–55]. Indeed, oxygen enhanced MRI of the lung is becoming an increasingly popular [56, 57].
Conclusions:
Flow suppression affects BOLD measurements including semi quantitative ΔSI(%) and quantitative R2*. The range of discrepancy was smaller in quantitative measurements than the semi-quantitative ΔSI. High similarity was found in spatial patterns when comparing maps with and without flow-suppression. ROI and spatial pattern analysis showed higher sensitivity to flow in A549 than H460 tumors, which was in agreement with histological results.
Supplementary Material
Acknowledgement:
We are grateful for the collegial advice of Drs. Robert Timmerman, John Minna, Masaya Takahashi, Shanrong Zhang and Zhongwei Zhang and technical support of James Campbell and Jeni Gerberich. The study was supported in part by funds from the Cancer Prevention and Research Institute of Texas (CPRIT MIRA RP120670-P3 and -P4) and infrastructure supported by 1P30 CA142543, P41 EB015908 and an ARRA stimulus supplement to 1U24 CA126608.
Footnotes
Presented in part at Joint Annual Meeting ISMRM-ESMRMB, Paris 2018
References:
- 1.Tatum JL, Kelloff GJ, Gillies RJ, Arbeit JM, Brown JM, Chao KSC, Chapman JD, Eckelman WC, Fyles AW, Giaccia AJ, Hill RP, Koch CJ, Krishna MC, Krohn KA, Lewis JS, Mason RP, Melillo G, Padhani AR, Powis G, Rajendran JG, Reba R, Robinson SP, Semenza GL, Swartz HM, Vaupel P, Yang D, Croft B, Hoffman J, Liu GY, Stone H, and Sullivan D Hypoxia: Importance in tumor biology, noninvasive measurement by imaging, and value of its measurement in the management of cancer therapy. Int. J. Radiat. Biol 2006; 82, 699–757. [DOI] [PubMed] [Google Scholar]
- 2.Horsman MR, Mortensen LS, Petersen JB, Busk M, and Overgaard J Imaging hypoxia to improve radiotherapy outcome. Nat Rev Clin Oncol 2012; 9, 674–687. [DOI] [PubMed] [Google Scholar]
- 3.Hunter FW, Wouters BG, and Wilson WR Hypoxia-activated prodrugs: paths forward in the era of personalised medicine. Br J Cancer 2016; 114, 1071–1077. [DOI] [PMC free article] [PubMed] [Google Scholar]
- 4.Giatromanolaki A, Koukourakis MI, Sivridis E, Turley H, Talks K, Pezzella F, Gatter KC, and Harris AL Relation of hypoxia inducible factor 1α and 2α in operable non-small cell lung cancer to angiogenic/molecular profile of tumours and survival. British Journal Of Cancer 2001; 85, 881. [DOI] [PMC free article] [PubMed] [Google Scholar]
- 5.Swinson DEB, Jones JL, Cox G, Richardson D, Harris AL, and O’Byrne KJ Hypoxia‐inducible factor‐1α in non small cell lung cancer: Relation to growth factor, protease and apoptosis pathways. International Journal of Cancer 2004; 111, 43–50. [DOI] [PubMed] [Google Scholar]
- 6.Le QT, Chen E, Salim A, Cao HB, Kong CS, Whyte R, Donington J, Cannon W, Wakelee H, Tibshirani R, Mitchell JD, Richardson D, O’Byrne KJ, Koong AC, and Giaccia AJ An evaluation of tumor oxygenation and gene expression in patients with early stage non-small cell lung cancers. Clin. Cancer Res. 2006; 12, 1507–1514. [DOI] [PubMed] [Google Scholar]
- 7.Dehdashti F, Grigsby PW, Mintun MA, Lewis JS, Siegel BA, and Welch MJ Assessing tumor hypoxia in cervical cancer by positron emission tomography with 60Cu-ATSM: Relationship to therapeutic response--a preliminary report. Int. J. Radiat. Oncol. Biol. Phys 2003; 55, 1233–1238. [DOI] [PubMed] [Google Scholar]
- 8.Eschmann SM, Paulsen F, Reimold M, Dittmann H, Welz S, Reischl G, Machulla HJ, and Bares R Prognostic impact of hypoxia imaging with F-18-misonidazole PET in non-small cell lung cancer and head and neck cancer before radiotherapy. J. Nucl. Med 2005; 46, 253–260. [PubMed] [Google Scholar]
- 9.Mason RP, Zhao D, Pacheco-Torres J, Cui W, Kodibagkar VD, Gulaka PK, Hao G, Thorpe P, Hahn EW, and Peschke P Multimodality imaging of hypoxia in preclinical settings. QJ Nucl. Med. Mol. Imaging 2010; 54, 259–280. [PMC free article] [PubMed] [Google Scholar]
- 10.O’Connor JPB, Boult JKR, Jamin Y, Babur M, Finegan KG, Williams KJ, Little RA, Jackson A, Parker GJM, Reynolds AR, Waterton JC, and Robinson SP Oxygen-Enhanced MRI Accurately Identifies, Quantifies, and Maps Tumor Hypoxia in Preclinical Cancer Models. Cancer Res 2016; 76, 787–795. [DOI] [PMC free article] [PubMed] [Google Scholar]
- 11.Colliez F, Gallez B, and Jordan BF Assessing Tumor Oxygenation for Predicting Outcome in Radiation Oncology: A Review of Studies Correlating Tumor Hypoxic Status and Outcome in the Preclinical and Clinical Settings. Frontiers in Oncology 2017; 7, [DOI] [PMC free article] [PubMed] [Google Scholar]
- 12.Baudelet C, and Gallez B How does blood oxygen level-dependent (BOLD) contrast correlate with oxygen partial pressure (pO2) inside tumors? Magn. Reson. Med 2002; 48, 980–986. [DOI] [PubMed] [Google Scholar]
- 13.Al-Hallaq HA, River JN, Zamora M, Oikawa H, and Karczmar GS Correlation of magnetic resonance and oxygen microelectrode measurements of carbogen-induced changes in tumor oxygenation. Int. J. Radiat. Oncol. Biol. Phys 1998; 41, 151–159. [DOI] [PubMed] [Google Scholar]
- 14.Zhao D, Jiang L, Hahn EW, and Mason RP Comparison of 1H blood oxygen level-dependent (BOLD) and 19F MRI to investigate tumor oxygenation. Magn. Reson. Med 2009; 62, 357–364. [DOI] [PMC free article] [PubMed] [Google Scholar]
- 15.Hallac RR, Ding Y, Yuan Q, McColl RW, Lea J, Sims RD, Weatherall PT, and Mason RP Oxygenation in cervical cancer and normal uterine cervix assessed using blood oxygenation level-dependent (BOLD) MRI at 3T. NMR Biomed 2012; 25, 1321–1330. [DOI] [PMC free article] [PubMed] [Google Scholar]
- 16.Jiang L, Weatherall PT, McColl RW, Tripathy D, and Mason RP Blood oxygenation level-dependent (BOLD) contrast magnetic resonance imaging (MRI) for prediction of breast cancer chemotherapy response: A pilot study. J. Magn. Reson. Imaging 2013; 37, 1083–1092. [DOI] [PubMed] [Google Scholar]
- 17.Remmele S, Sprinkart AM, Muller A, Traber F, von Lehe M, Gieseke J, Flacke S, Willinek WA, Schild HH, Senegas J, Keupp J, and Murtz P Dynamic and simultaneous MR measurement of R1 and R2*changes during respiratory challenges for the assessment of blood and tissue oxygenation. Magn. Reson. Med 2013; 70, 136–146. [DOI] [PubMed] [Google Scholar]
- 18.O’Connor JPB, Naish JH, Jackson A, Waterton JC, Watson Y, Cheung S, Buckley DL, McGrath DM, Buonaccorsi GA, Mills SJ, Roberts C, Jayson GC, and Parker GJM Comparison of Normal Tissue R-1 and R-2* Modulation by Oxygen and Carbogen. Magn. Reson. Med 2009; 61, 75–83. [DOI] [PubMed] [Google Scholar]
- 19.Al-Hallaq HA, Fan XB, Zamora M, River JN, Moulder JE, and Karczmar GS Spectrally inhomogeneous BOLD contrast changes detected in rodent tumors with high spectral and spatial resolution MRI. NMR Biomed 2002; 15, 28–36. [DOI] [PubMed] [Google Scholar]
- 20.Hallac RR, Zhou H, Pidikiti R, Song K, Stojadinovic S, Zhao D, Solberg T, Peschke P, and Mason RP Correlations of noninvasive BOLD and TOLD MRI with pO2 and relevance to tumor radiation response. Magn. Reson. Med 2014; 71, 1863–1873. [DOI] [PMC free article] [PubMed] [Google Scholar]
- 21.Zhao D, Pacheco-Torres J, Hallac RR, White D, Peschke P, Cerdán S, and Mason RP Dynamic oxygen challenge evaluated by NMR T1 and T2* – insights into tumor oxygenation. NMR Biomed 2015; 28, 937–947. [DOI] [PMC free article] [PubMed] [Google Scholar]
- 22.Winter JD, Akens MK, and Cheng H-LM Quantitative MRI assessment of VX2 tumour oxygenation changes in response to hyperoxia and hypercapnia. Phys. Med. Biol. 2011; 56, 1225. [DOI] [PubMed] [Google Scholar]
- 23.Bane O, Besa C, Wagner M, Oesingmann N, Zhu HF, Fiel MI, and Taouli B Feasibility and reproducibility of BOLD and TOLD measurements in the liver with oxygen and carbogen gas challenge in healthy volunteers and patients with hepatocellular carcinoma. Journal of Magnetic Resonance Imaging 2016; 43, 866–876. [DOI] [PMC free article] [PubMed] [Google Scholar]
- 24.Rakow-Penner R, Daniel B, and Glover GH Detecting Blood Oxygen Level-Dependent (BOLD) Contrast in the Breast. J. Magn. Reson. Imaging 2010; 32, 120–129. [DOI] [PubMed] [Google Scholar]
- 25.Taylor NJ, Baddeley H, Goodchild KA, Powell MEB, Thoumine M, Culver LA, Stirling JJ, Saunders MI, Hoskin PJ, Phillips H, Padhani AR, and Griffiths JR BOLD MRI of human tumor oxygenation during carbogen breathing. J. Magn. Reson. Imaging 2001; 14, 156–163. [DOI] [PubMed] [Google Scholar]
- 26.Dash RK, Korman B, and Bassingthwaighte JB Simple Accurate Mathematical Models of Blood HbO(2) and HbCO(2) Dissociation Curves at Varied Physiological Conditions–Evaluation and Comparison with other Models. European journal of applied physiology 2016; 116, 97–113. [DOI] [PMC free article] [PubMed] [Google Scholar]
- 27.Howe FA, Robinson SP, McIntyre DJO, Stubbs M, and Griffiths JR Issues in flow and oxygenation dependent contrast (FLOOD) imaging of tumours. NMR Biomed 2001; 14, 497–506. [DOI] [PubMed] [Google Scholar]
- 28.Howe FA, Robinson SP, Rodrigues LM, and Griffiths JR Flow and oxygenation dependent (FLOOD) contrast MR imaging to monitor the response of rat tumors to carbogen breathing. Magn. Reson. Imaging 1999; 17, 1307–1318. [DOI] [PubMed] [Google Scholar]
- 29.Robinson SP, Howe FA, and Griffiths JR Noninvasive monitoring of carbogen-induced changes in tumor blood flow and oxygenation by functional MRI. Int. J. Radiat. Oncol. Biol. Phys 1995; 33, 855–859. [DOI] [PubMed] [Google Scholar]
- 30.Zhang Z, Wodzak M, Belzile O, Zhou H, Sishc B, Yan H, Stojadinovic S, Mason RP, Brekken RA, Chopra R, Story MD, Timmerman R, and Saha D Effective Rat Lung Tumor Model for Stereotactic Body Radiation Therapy. Radiat. Res 2016; 185, 616–622. [DOI] [PMC free article] [PubMed] [Google Scholar]
- 31.White DA, Zhang Z, Li L, Gerberich J, Stojadinovic S, Peschke P, and Mason RP Developing oxygen-enhanced magnetic resonance imaging as a prognostic biomarker of radiation response. Cancer Letters 2016; 380, 69–77. [DOI] [PMC free article] [PubMed] [Google Scholar]
- 32.Zhou H, Zhang Z, Denney R, Williams JS, Gerberich J, Stojadinovic S, Saha D, Shelton JM, and Mason RP Tumor physiological changes during hypofractionated stereotactic body radiation therapy assessed using multi-parametric magnetic resonance imaging. Oncotarget 2017; 8, 37464–37477. [DOI] [PMC free article] [PubMed] [Google Scholar]
- 33.Howe FA, Robinson SP, and Griffiths JR Modification of tumour perfusion and oxygenation monitored by gradient recalled echo MRI and P-31 MRS. Nmr in Biomedicine 1996; 9, 208–216. [DOI] [PubMed] [Google Scholar]
- 34.Glover GH, Lemieux SK, Drangova M, and Pauly JM Decomposition of inflow and blood oxygen level-dependent (BOLD) effects with dual-echo spiral gradient-recalled echo (GRE) fMRI. Magnetic Resonance in Medicine 1996; 35, 299–308. [DOI] [PubMed] [Google Scholar]
- 35.Robinson SP, Rodrigues LM, Ojugo ASE, McSheey PMJ, Howe FA, and Griffiths JR The response to carbogen breathing in experimental tumour models monitored by gradient-recalled echo magnetic resonance imaging. Br. J. Cancer 1997; 75, 1000–1006. [DOI] [PMC free article] [PubMed] [Google Scholar]
- 36.Robinson SP, Rijken P, Howe FA, McSheehy PMJ, van der Sanden BPJ, Heerschap A, Stubbs M, van der Kogel AJ, and Griffiths JR Tumor vascular architecture and function evaluated by non-invasive susceptibility MRI methods and immunohistochemistry. J. Magn. Reson. Imaging 2003; 17, 445–454. [DOI] [PubMed] [Google Scholar]
- 37.Rodrigues LM, Howe FA, Griffiths JR, and Robinson SP Tumor R-2 * is a prognostic indicator of acute radiotherapeutic response in rodent tumors. J. Magn. Reson. Imaging 2004; 19, 482–488. [DOI] [PubMed] [Google Scholar]
- 38.Jiang L, Zhao D, Constantinescu A, and Mason RP Comparison of BOLD contrast and Gd-DTPA Dynamic Contrast Enhanced imaging in rat prostate tumor. Magn. Reson. Med 2004; 51, 953–960. [DOI] [PubMed] [Google Scholar]
- 39.Felmlee JP, and Ehman RL Spatial presaturation - a method for suppressing flow artifacts and improving depiction of vascular anatomy in MR imaging. Radiology 1987; 164, 559–564. [DOI] [PubMed] [Google Scholar]
- 40.Edelman RR, Atkinson DJ, Silver MS, Loaiza FL, and Warren WS FRODO pulse sequences - a new means of eliminating motion, flow, and wraparound artifacts. Radiology 1988; 166, 231–236. [DOI] [PubMed] [Google Scholar]
- 41.Rosen BR, Wedeen VJ, and Brady TJ Selective saturation NMR imaging. Journal of Computer Assisted Tomography 1984; 8, 813–818. [DOI] [PubMed] [Google Scholar]
- 42.Pike GB, Hu BS, Glover GH, and Enzmann DR Magnetization transfer time-of-flight magnetic-resonance angiography. Magn.Reson.Med 1992; 25, 372–379. [DOI] [PubMed] [Google Scholar]
- 43.Robson PM, Madhuranthakam AJ, Smith MP, Sun MRM, Dai WY, Rofsky NM, Pedrosa I, and Alsop DC Volumetric Arterial Spin-labeled Perfusion Imaging of the Kidneys with a Three-dimensional Fast Spin Echo Acquisition. Academic Radiology 2016; 23, 144–154. [DOI] [PMC free article] [PubMed] [Google Scholar]
- 44.Neeman M, Dafni H, Bukhari O, Braun RD, and Dewhirst MW In vivo BOLD contrast MRI mapping of subcutaneous vascular function and maturation: Validation by intravital microscopy. Magn. Reson. Med 2001; 45, 887–898. [DOI] [PubMed] [Google Scholar]
- 45.Gu FF, Hu CL, Tai ZG, Yao C, Tian J, Zhang LJ, Xia QM, Gong CN, Gao Y, and Gao S Tumour microenvironment-responsive lipoic acid nanoparticles for targeted delivery of docetaxel to lung cancer. Scientific Reports 2016; 6, [DOI] [PMC free article] [PubMed] [Google Scholar]
- 46.Vilalta M, Hughes NP, Von Eyben R, Giaccia AJ, and Graves EE Patterns of Vasculature in Mouse Models of Lung Cancer Are Dependent on Location. Molecular Imaging and Biology 2017; 19, 215–224. [DOI] [PMC free article] [PubMed] [Google Scholar]
- 47.Graves EE, Vilalta M, Cecic IK, Erler JT, Tran PT, Felsher D, Sayles L, Sweet-Cordero A, Le QT, and Giaccia AJ Hypoxia in Models of Lung Cancer: Implications for Targeted Therapeutics. Clin. Cancer Res 2010; 16, 4843–4852. [DOI] [PMC free article] [PubMed] [Google Scholar]
- 48.Alonzi R, Padhani AR, Maxwell RJ, Taylor NJ, Stirling JJ, Wilson JI, d’Arcy JA, Collins DJ, Saunders MI, and Hoskin PJ Carbogen breathing increases prostate cancer oxygenation: a translational MRI study in murine xenografts and humans. Br J Cancer 2009; 100, 644–648. [DOI] [PMC free article] [PubMed] [Google Scholar]
- 49.Amorino GP, Lee H, Holburn GE, Paschal CB, Hercules SK, Shyr Y, Steffen RP, and Choy H Enhancement of tumor oxygenation and radiation response by the allosteric effector of hemoglobin, RSR13. Radiation Research 2001; 156, 294–300. [DOI] [PubMed] [Google Scholar]
- 50.Ohno Y, Hatabu H, Higashino T, Nogami M, Takenaka D, Watanabe H, Van Cauteren M, Yoshimura M, Satouchi M, Nishimura Y, and Sugimura K Oxygen-enhanced MR Imaging: Correlation with Postsurgical Lung Function in Patients with Lung Cancer. Radiology 2005; 236, 704–711. [DOI] [PubMed] [Google Scholar]
- 51.Yuan Q, Ding Y, Hallac RR, Sims RD, Weatherall PT, Boike T, Timmerman R, and Mason RP Feasibility of BOLD Magnetic Resonance Imaging of Lung Tumors at 3 T. In Proc. ISMRM p. 1093, Stockholm, Sweden (2010) [Google Scholar]
- 52.Salem S, Little R, Featherstone A, Babur M, Mistry H, Cheung S, Watson Y, Tessyman V, AsselinM C, Jackson A, Williams K, Parker G, Faivre-Finn C, and O’Connor JPB Oxygen enhanced-MRI detects radiotherapy-induced change in hypoxia in xenograft models and lung cancer patients In Proc. Intl. Soc. Mag. Reson. Med Vol. 26 p. 123, Paris, France (2018) [Google Scholar]
- 53.Togao O, Ohno Y, Dimitrov I, Hsia CC, and Takahashi M Ventilation/Perfusion Imaging of the Lung Using Ultra-short Echo Time (UTE) MRI in an Animal Model of Pulmonary Embolism. J. Magn. Reson. Imaging 2011; 34, 539–546. [DOI] [PMC free article] [PubMed] [Google Scholar]
- 54.Naish JH, Parker GJM, Beatty PC, Jackson A, Young SS, Waterton JC, and Taylor CJ Improved quantitative dynamic regional oxygen-enhanced pulmonary imaging using image registration. Magnetic Resonance in Medicine 2005; 54, 464–469. [DOI] [PubMed] [Google Scholar]
- 55.Edelman RR, Hatabu H, Tadamura E, Li W, and Prasad PV Noninvasive assessment of regional ventilation in the human lung using oxygen-enhanced magnetic resonance imaging. Nature Medicine 1996; 2, 1236–1239. [DOI] [PubMed] [Google Scholar]
- 56.Bauman G, Pusterla O, Santini F, and Bieri O Dynamic and steady-state oxygen-dependent lung relaxometry using inversion recovery ultra-fast steady-state free precession imaging at 1.5 T. Magnetic Resonance in Medicine 2018; 79, 839–845. [DOI] [PubMed] [Google Scholar]
- 57.Pusterla O, Bauman G, and Bieri O Three-dimensional oxygen-enhanced MRI of the human lung at 1.5T with ultra-fast balanced steady-state free precession. Magnetic Resonance in Medicine 2018; 79, 246–255. [DOI] [PubMed] [Google Scholar]
Associated Data
This section collects any data citations, data availability statements, or supplementary materials included in this article.


