

Abstract
Mitofusins (Mfns) are dynamin-related GTPases that mediate mitochondrial outer-membrane fusion, a process that is required for mitochondrial and cellular health. In Mfn1 and Mfn2 paralogs, a conserved phenylalanine (Phe-202 (Mfn1) and Phe-223 (Mfn2)) located in the GTPase domain on a conserved β strand is part of an aromatic network in the core of this domain. To gain insight into the poorly understood mechanism of Mfn-mediated membrane fusion, here we characterize a Mitofusin mutant variant etiologically linked to Charcot–Marie–Tooth syndrome. From analysis of mitochondrial structure in cells and mitochondrial fusion in vitro, we found that conversion of Phe-202 to leucine in either Mfn1 or Mfn2 diminishes the fusion activity of heterotypic complexes with both Mfn1 and Mfn2 and abolishes fusion activity of homotypic complexes. Using coimmunoprecipitation and native gel analysis, we further dissect the steps of mitochondrial fusion and demonstrate that the mutant variant has normal tethering activity but impaired higher-order nucleotide-dependent assembly. The defective coupling of tethering to membrane fusion observed here suggests that nucleotide-dependent self-assembly of Mitofusin is required after tethering to promote membrane fusion.
Keywords: Charcot-Marie-Tooth disease (CMT), fusion protein, membrane fusion, GTPase, mitochondria, organelle, structure-function, dynamin related protein (DRP), mitochondrial network, tethering
Introduction
Mitochondria play many important roles in critical cellular pathways, including metabolism, cellular signaling, and cell death. Mitochondria are highly dynamic organelles that form an interconnected network through ongoing fusion, division, and movement (1). These activities are required to maintain both the structure and function of the mitochondrial network. This is crucial for the health of cells as aberrant mitochondrial structures have been observed in many pathological states and neurodegenerative disorders (1–7). Both mitochondrial fusion and division are mediated by large GTPase proteins of the dynamin-related protein (DRP)2 family. In vertebrates, mitochondrial outer-membrane fusion is mediated by two paralogous membrane fusion DRPs, Mitofusin 1 and Mitofusin 2 (Mfn1 and Mfn2, respectively) (8). Mitochondrial outer-membrane fusion is temporally coupled to mitochondrial inner-membrane fusion, which is facilitated by optic atrophy 1 (Opa1) (9–12). As paralogs, Mfn1 and Mfn2 share high sequence identity and similarity (8) but are functionally and mechanistically distinct (13–15). For example, heterozygous point mutations only in Mfn2 lead to the peripheral neuropathy Charcot–Marie–Tooth syndrome type 2A (CMT2A), which causes progressive loss of function and sensation in the extremities (16, 17). In addition, in contrast to a reticular and connected network in WT cells, Mfn1-null and Mfn2-null mouse embryonic fibroblasts (MEFs) both have fragmented mitochondrial networks, suggesting that Mfn1 and Mfn2 work together to create a connected mitochondrial network (14). Indeed, Mfn1 and Mfn2 have been shown to form functionally distinct homotypic and heterotypic complexes (15, 18). Together, these reports illustrate that the heterotypic Mfn1–Mfn2 complexes are the most fusion-competent, whereas the fusion activity of either Mfn1 or Mfn2 homotypic complexes is relatively low.
To date, all DRP family members studied share a characteristic structure, including a globular GTPase domain (G domain) with extended α helical bundle(s) and a membrane-interacting domain. DRPs mediate membrane remodeling events by using GTP binding and hydrolysis to promote self-assembly and conformational changes. For example, to divide mitochondria, Drp1 forms a macromolecular ring around the organelle, which then constricts and disassembles with nucleotide hydrolysis (19–21). In contrast, the molecular mechanisms of Mitofusin-mediated mitochondrial outer-membrane fusion are poorly understood. A Mitofusin is required on both membranes of the fusion pair and together are likely to mediate tethering by interacting in trans (15, 22, 23). The tethered state is predicted to advance to lipid mixing by the progression through the GTP catalytic cycle to stimulate self-assembly, GTP hydrolysis, and conformational changes, which together drive membrane fusion (24).
Similar to the division DRPs, an interface between the GTPase domains of two molecules is required for GTP hydrolysis for the fusion DRPs (25–27). For Atlastin, which mediates homotypic fusion of the endoplasmic reticulum, this interface is formed in trans between fusion partners, and GTP hydrolysis drives conformational changes that lead to membrane fusion (28). A similar tethering mechanism has been proposed for the Mitofusins (25, 29, 30), although another proposed model for mitochondrial tethering requires the C-terminal heptad repeat domain (22). Recent evidence suggests that in yeast, Fzo1-mediated homotypic mitochondrial fusion involves the formation of a ringlike structure in trans where multiple rounds of GTP hydrolysis are required to progress from an early tethering event to membrane fusion (31). In vertebrates, it remains unclear whether higher-order assembly of Mfn1 and Mfn2 is required for tethering and/or fusion.
Here, we present characterization of a mutant variant of the Mitofusins that is etiologically linked to the neurodegenerative disorder CMT2A (32). Although a mitochondrial fusion defect is not apparent in cells, we observe reduced fusion efficiency in our reconstituted mitochondrial in vitro fusion assay. We show that this variant is nonfunctional in homotypic complexes but supports fusion in the context of heterotypic fusion complexes with a WT copy of the opposite Mfn in cis or trans. By assessing Mfn-dependent mitochondrial tethering and nucleotide-dependent assembly, we demonstrate that the mutant variant cannot effectively couple mitochondrial tethering to membrane fusion. This suggests a mechanism of mitochondrial outer-membrane fusion where nucleotide-dependent assembly of Mfn is required following tethering to drive membrane fusion.
Results
Mfn1F202L is a unique GTPase domain mutant variant
To gain insight into the molecular mechanism of mitochondrial outer-membrane tethering and fusion, we performed a functional screen of mutant variants of Mfn1 at highly conserved positions in the GTPase domain. Mfn1-null MEFs have a fragmented mitochondrial network characterized by short, rod-shaped mitochondria due to low rates of mitochondrial fusion (14, 33). We generated 12 mutant variants of Mfn1, selecting positions that were both conserved (in Mfn1, Mfn2, and MARF, the Drosophila Mitofusin) and that were associated with CMT2A in Mfn2 (Table S1). These variants were stably expressed with a C-terminal eGFP tag in Mfn1-null MEFs by viral transduction. The GFP signal colocalized with MitoTracker Red, indicating correct expression and targeting to the mitochondrial outer membrane. In cells with eGFP signal, the structure of the mitochondrial network was assessed as a proxy for fusion activity of the Mitofusin variant expressed. As expected, expression of Mfn1WT-eGFP restored a reticular mitochondrial network, which is defined as having a connected network of mitochondria tubules distributed throughout the cytoplasm (Fig. 1A). Of the 12 mutant variants tested, nine variants did not significantly alter the fragmented mitochondrial network in Mfn1-null cells, consistent with loss of function (Table S1 and Fig. 1A, Mfn1H144R). There were two variants of Mfn1 whose expression restored a reticular mitochondrial network, indicating fusion activity when expressed with endogenous Mfn2 (Table S1 and Fig. 1A, Mfn1F263Y).
Figure 1.

Mfn1 Phe-202 is a highly conserved residue in a central β strand. A, representative images of Mfn1−/− Mfn2+/+ cells stably expressing Mfn1-eGFP or Mfn1F202L-eGFP following retroviral transduction. Mitochondria were labeled with MitoTracker Red CMXRos and visualized by fluorescence microscopy. Images represent maximum intensity projections. Scale bars are 5 μm. B, sequence alignment of Mfn1 F202 region generated using Clustal Omega. The arrow indicates the position of β strand 4G, and the conserved phenylalanine (Mfn1 Phe-202 and Mfn2 Phe-223) is in blue text. C, Mfn1IM crystal structure with Phe-202 highlighted in fuchsia. Critical residues in conserved catalytic domains are highlighted: the P-loop in cornflower blue, G2/switch I in light blue, G3/switch II in dark blue, and G4 in turquoise (Protein Data Bank (PDB) code 5GOE).
The remaining variant, F202L, altered both the distribution and connectivity of the mitochondria in Mfn1-null cells. Expression of Mfn1F202L-eGFP was associated with a highly connected network (Fig. 1A). In some of these cells, the mitochondrial distribution was also affected, with most of the mitochondria coalesced in the perinuclear region. This residue is located in the highly conserved β 4G sheet in the core of the GTPase domain, and the conversion of phenylalanine to leucine in the corresponding Mfn2 residue is associated with CMT2A (Fig. 1, B and C). Given the striking changes in mitochondrial structure and distribution in cells, we chose to further characterize the molecular features of this variant in Mfn1 (F202L) and Mfn2 (F223L).
Because the phenylalanine residue is located in the GTPase domain, we sought to determine whether the enzymatic properties of Mfn1F202L were altered. We utilized the Mfn1 minimal GTPase domain construct (Mfn1IMC) recently used to obtain a high-resolution crystal structure (25). We determined that the Vmax of Mfn1F202L was only slightly lower than that of Mfn1WT (Fig. S1A). Indeed, full kinetic analysis of Mfn1WT and Mfn1F202L demonstrated that the mutant enzyme is similar to WT (Fig. S1B). Together, these data suggest that the basal catalytic activity of Mfn1F202L is only mildly impacted compared with WT. These changes in enzyme kinetics are relatively modest, making it unlikely that they account for the dramatic mitochondrial morphology changes observed in cells, although we cannot rule out this possibility.
Mfn1F202L and Mfn2F223L restored a connected mitochondrial network in cells lacking Mfn1 or Mfn2
We first wanted to assess the function of Mfn1F202L and the equivalent mutant variant in Mfn2, Mfn2F223L, in the presence of the opposite WT paralog utilizing established cell lines lacking Mfn1 (Mfn1-null) or Mfn2 (Mfn2-null), respectively (14). To do this, we generated stable cell lines expressing Mfn1 or Mfn2 with a C-terminal 3xFLAG tag using retroviral transduction in the genetic null background. To ensure that nonphysiological expression levels did not alter protein function, we then expanded and screened clonal populations and selected those with near WT protein levels for further characterization (Fig. S2).
The expression of Mfn1WT-FLAG in Mfn1-null MEFs restored a connected mitochondrial network, whereas transduction with an empty vector did not alter the fragmented mitochondrial structure (Fig. 2, A and B). Consistent with the results from our screen, cells expressing Mfn1F202L-FLAG possessed mitochondria that were highly connected and often coalesced in the perinuclear space. To resolve the mitochondrial structure in cells expressing Mfn1F202L-FLAG, we treated cells with nocodazole to depolymerize microtubules, which has been previously shown to redistribute highly connected mitochondria in cells overexpressing a dominant-negative Drp1 variant to reveal the degree of connectivity (19). Abolishing the microtubule network did not significantly alter the mitochondrial structure in WT or Mfn1WT-FLAG rescue cells (Fig. 2C). Mfn1-null cells transduced with empty vector maintained a fragmented network, although some short, rod-shaped mitochondria were observed after treatment with nocodazole. In contrast, the mitochondria in Mfn1F202L-FLAG–expressing cells were redistributed throughout the cytoplasm following nocodazole treatment, revealing a mitochondrial network that was highly connected in each clonal population (Fig. 2C). Mitochondrial connectivity was further assessed utilizing a mitochondrial matrix–targeted photoactivatable GFP (mt-paGFP). Following activation of paGFP within a 1-μm square, the localization and intensity of paGFP were monitored to assess mitochondrial connectivity, movement, and fusion. Over the course of 50 min, we observed that in WT cells mt-paGFP was reduced in intensity and spread out of the ROI, consistent with diffusion within a connected network and fusion events (Fig. S3A). In contrast, in Mfn1-null empty vector control cells, individual mitochondria with mt-paGFP move from the ROI, but there was limited change in signal intensity and no increased colocalization with red signal, consistent with a disconnected network and few fusion events (Fig. S3B). The clonal populations of Mfn1-null cells expressing Mfn1F202L exhibited similar characteristics to WT controls with both decreased intensity of paGFP and movement out of the ROI (Fig. S3C). Finally, we have quantified the number of individual mitochondria and the mean network size utilizing MiNA (mitochondrial network analysis), and these are also consistent with the conclusion that Mfn1-null cells expressing Mfn1F202L are highly connected (Fig. S3D) (34). Together, these results suggest that Mfn1F202L and endogenous Mfn2 can support mitochondrial fusion, which results in a connected mitochondrial network in these cells.
Figure 2.

Mfn1F202L and Mfn2F223L support mitochondrial fusion when expressed in Mfn1-null and Mfn2-null cells, respectively. A, representative images of clonal populations of Mfn1−/−Mfn2+/+ cells either transduced with empty vector (V) or stably expressing Mfn1-FLAG or Mfn1F202L-FLAG. Mitochondria were labeled with MitoTracker Red CMXRos and visualized by fluorescence microscopy. Images represent maximum intensity projections. Scale bars are 5 μm. The Vector panel is representative of a cell with a fragmented mitochondrial network; the WT and Mfn1-FLAG cells are representative of cells with a reticular mitochondrial network; the Mfn1F202L cell is representative of a cell with a highly connected network. B, quantification of the mitochondrial morphology of cell lines described in A. Error bars indicate mean + S.D. from three blinded experiments (n > 100 cells per cell line per experiment). C, representative images of clonal populations from A treated with 1.5 nm nocodazole for 1 h. Mitochondria were labeled with MitoTracker Red CMXRos and visualized by fluorescence microscopy. Images represent maximum intensity projections. Scale bars are 5 μm. D, representative images of clonal populations of Mfn1+/+ Mfn2−/− cells stably either transduced with empty vector (V) or expressing Mfn2-FLAG or Mfn2F223L-FLAG. Mitochondria were labeled with MitoTracker Red CMXRos and visualized by fluorescence microscopy. Images represent maximum intensity projections. Scale bars are 5 μm. E, quantification of the mitochondrial morphology of cell lines described in D. Error bars indicate mean + S.D. from three blinded experiments (n > 100 cells per cell line per experiment).
Although Mfn1 and Mfn2 share high similarity, several lines of evidence indicate that they are functionally distinct. Therefore, we set out to characterize the equivalent mutant variant in Mfn2, Mfn2F223L, which is associated with CMT2A disease. As described above, we generated stable clonal populations with Mfn2-FLAG expressed in Mfn2-null cells at levels comparable with endogenous protein (Fig. S2B).
As in Mfn1-null cells, expression of Mfn2WT-FLAG in Mfn2-null MEFs restored a reticular mitochondrial network, whereas transduction with an empty vector did not alter the fragmented mitochondrial structure (Fig. 2, D and E). Analysis of Mfn2F223L-FLAG clonal populations revealed that cells expressing this variant possessed a reticular mitochondrial network, similar to that observed in cells expressing Mfn2WT-FLAG. However, the perinuclear clustering of mitochondria was not observed, suggesting that this altered distribution is unique to mutant Mfn1. These data suggest that Mfn2F223L can also support mitochondrial fusion in cells when expressed with a WT Mfn1 partner.
Mfn1F202L requires a WT paralog for fusion activity
Mitochondrial fusion is most efficient when both Mfn1 and Mfn2 are expressed, indicating that the heterotypic fusion complexes are functionally distinct from homotypic complexes. Therefore, we sought to systematically characterize the function of each variant in the presence and absence of either Mfn1 or Mfn2 utilizing WT, Mfn1-null, Mfn2-null, and Mfn1/2-null MEFs. To visualize cells expressing Mfn1F202L or Mfn2F223L, we made use of a C-terminal mNeonGreen tag (Mfn1/2-mNeon), which was brighter and more photostable than Mitofusin-eGFP. These constructs were also expressed at near endogenous levels by viral transduction (Fig. S4), and the mitochondrial morphology was scored in cells with mitochondrial mNeon signal in three independent, blinded experiments.
WT MEFs expressing Mfn1F202L-mNeon appear unaltered, with a connected and distributed mitochondrial network (Fig. 3, A and B). Therefore, the mutant phenotype is recessive and does not interfere with function of endogenous Mitofusin in cells. Consistent with our analysis of clonal populations above, the mitochondrial network in Mfn1-null MEFs expressing Mfn1F202L-mNeon were highly connected and collapsed around the nucleus in about half of the cells. In contrast, in Mfn2-null cells, which possess only Mfn1 homotypic complexes, the expression of Mfn1F202L-mNeon did not alter mitochondrial morphology, and the vast majority of cells had a fragmented network. Finally, when Mfn1F202L-mNeon was expressed alone in Mfn1/2-null cells, we observed fragmented mitochondria that are either distributed or aggregated. In sum, these data indicate that Mfn1F202L does not mediate fusion alone or with Mfn1WT and that it requires Mfn2 for fusion activity.
Figure 3.

Mfn1F202L and Mfn2F223L only support fusion in heterotypic complexes. A, representative images of the indicated cell lines stably expressing Mfn1F202L-mNeon. Mitochondria were labeled with MitoTracker Red CMXRos and visualized by fluorescence microscopy. Images represent maximum intensity projections. Scale bars are 5 μm. B, quantification of the mitochondrial morphology of cell lines described in A. Error bars indicate mean + S.D. from three blinded experiments (n > 100 cells per cell line per experiment). C, representative images of the indicated cell lines stably expressing Mfn2F223L-mNeon. Mitochondria were labeled with MitoTracker Red CMXRos and visualized by fluorescence microscopy. Images represent maximum intensity projections. Scale bars are 5 μm. D, quantification of the mitochondrial morphology of cell lines described in C. Error bars indicate mean + S.D. from three blinded experiments (n > 100 cells per cell line per experiment).
In WT MEFs, Mfn2F223L-mNeon expression also did not alter the mitochondrial network, which remained reticular (Fig. 3, C and D). In Mfn1-null MEFs, the fragmented mitochondrial network did not change with expression of Mfn2F223L-mNeon. This suggests that, similar to Mfn1F202L, Mfn2F223L–Mfn2WT complexes do not support fusion. Consistent with our analysis of clonal populations described above (see Fig. 2, D and E), Mfn2F223L-mNeon expression in Mfn2-null MEFs generated a reticular mitochondrial network. Expression of Mfn2F223L-mNeon in Mfn1/2-null MEFs resulted in a similar phenotype to Mfn1F202L with cells having mitochondrial networks that were fragmented with some cells where the fragments were aggregated, indicating that Mfn2F223L homotypic complexes are not able to support mitochondrial fusion. Collectively, these data suggest that Mfn1F202L and Mfn2F223L only support molecular activities required for fusion in heterotypic fusion complexes with a WT paralog.
One unique property of Mfn1 is that it can functionally complement a subset of Mfn2 mutants altered at conserved positions in the GTPase domain in a heterotypic fusion complex (18). Mfn2W260A is an Mfn2 mutant variant that is predicted to lack nucleotide binding and hydrolysis and has been shown to lack fusion activity in cells when expressed alone (in Mfn1/2-null cells) (25). We tested the function of Mfn2W260A in heterotypic fusion complexes with WT Mfn1 by expressing the mutant in Mfn2-null cells. Similar to Mfn2F223L, we observe that Mfn2W260A-mNeon expression in these cells supports the formation of a reticular mitochondrial network (Fig. S5). Therefore, Mfn2W260A can mediate fusion with Mfn1WT but not alone. In contrast to Mfn1F202L, expression of the Mfn1W239A-mNeon mutant variant in Mfn1-null cells failed to support the formation of a reticular mitochondrial network (Fig. S5). These data suggest that when both Mfn1 and Mfn2 are present, only Mfn1 needs to have GTPase activity to facilitate mitochondrial outer-membrane fusion.
To further test whether Mfn1F202L is in a unique mutant class, we tested whether Mfn1F202L supports fusion with Mfn2W260A. To do this, we generated clonal populations of Mfn1/2-null MEFs stably expressing Mfn1F202L-FLAG at near WT levels (Fig. S6). Utilizing these stable cell lines, we then transduced Mitofusins with a C-terminal mNeon and quantified mitochondrial morphology in cells expressing mNeon.
Consistent with data presented in Fig. 3, A and B, the mitochondrial network in cells expressing only Mfn1F202L-FLAG and transduced with empty vector were fragmented, with some cells also exhibiting a change in distribution as some of the fragmented mitochondria were clustered together (Fig. 4, A and B). As expected, expression of Mfn1WT-mNeon did not alter the mitochondrial structure in these cells, whereas expression of Mfn2WT-mNeon corresponded with a reticular mitochondrial network in the majority of cells. These data support our previous conclusion that Mfn1F202L can facilitate fusion with Mfn2WT but not Mfn1WT. To our knowledge, this is the first report of a mutant variant of Mfn1 that can be functionally complemented by WT Mfn2. In contrast, Mfn2W260A-mNeon did not restore fusion activity with Mfn1F202L-FLAG as we observed fragmented mitochondria in the majority of cells. Therefore, unlike Mfn1WT, Mfn1F202L uniquely requires a variant of Mfn2 with normal catalytic function. Together, this analysis reveals that Mfn1F202L has a molecular defect that makes Mfn1 dependent on the catalytic function of Mfn2, further supporting our conclusion that Mfn1F202L is a unique class of mutant.
Figure 4.
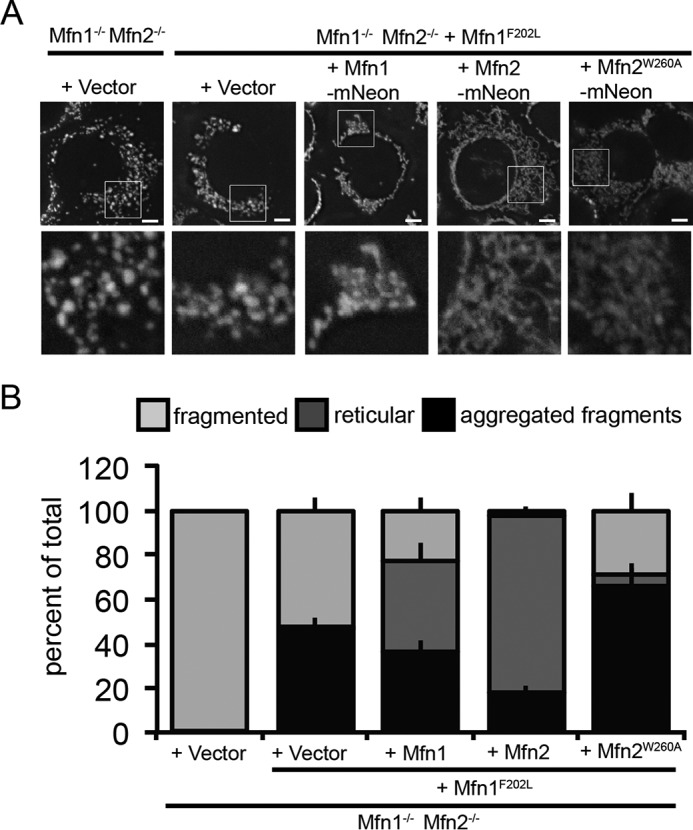
Mfn1F202L requires WT Mfn2 to function in a heterotypic complex. A, representative images of a clonal population of Mfn1−/− Mfn2−/− + Mfn1F202L-FLAG stably expressing the indicated Mfn-mNeon. Mitochondria were labeled with MitoTracker Red CMXRos and visualized by fluorescence microscopy. Images represent maximum intensity projections. Scale bars are 5 μm. B, quantification of the mitochondrial morphology of cell lines described in A. Error bars indicate mean + S.D. from three blinded experiments (n > 100 cells per cell line per experiment).
Mfn1F202L and Mfn2F223L have impaired fusion activity in vitro
In cells, mitochondrial structure is determined by the combined activities of mitochondrial division, fusion, transport, and positioning. To directly assess the fusion activity of Mfn1F202L and Mfn2F223L in the absence of these other factors, we utilized a quantitative in vitro mitochondrial fusion assay (15). Mitochondria were isolated from populations of cells expressing either a matrix-targeted red or cyan fluorescent protein. Following incubation of red and cyan mitochondria with fusion buffer, fluorescence microscopy was used to score fusion events, which are indicated by overlap of the two fluorophores in three dimensions. The fusion activity of the mutants was compared with WT controls performed in parallel and expressed as a relative amount. We assessed protein stability in the reaction conditions and found that the levels of WT and mutant Mitofusin proteins were not significantly altered over the course of the reaction (Fig. S7A).
First, we assessed fusion of mitochondria isolated from the Mfn1-null clonal populations expressing endogenous Mfn2 with either Mfn1WT-FLAG, Mfn1F202L-FLAG, or empty vector described in Fig. 2, A and B. Mitochondria containing Mfn2 and Mfn1-FLAG had a relative rate of fusion that was comparable with WT controls, consistent with complete rescue of the Mfn1-null phenotype (Fig. 5A and Fig. S7B). In contrast, the mitochondria containing Mfn2 and Mfn1F202L possessed only 40% of the fusion activity of WT controls, which was comparable with mitochondria from vector control cells that only express Mfn2 (Fig. 5A).
Figure 5.

Mitochondrial in vitro fusion assay reveals a fusion defect for Mfn1F202L and Mfn2F223L. A, mitochondria were isolated from WT cells (Mfn1+/+ Mfn2+/+), a clonal population of Mfn1WT-expressing Mfn1-null cells (Mfn1WT Mfn2+/+), a clonal population of Mfn1F202L-expressing Mfn1-null cells (Mfn1F202L Mfn2+/+), a clonal population of Mfn1-null cells transduced with empty vector (Mfn1−/− Mfn2+/+), a clonal population of Mfn2WT-expressing Mfn2-null cells (Mfn1+/+ Mfn2WT), a clonal population of Mfn2F223L-expressing Mfn2-null cells (Mfn1+/+ Mfn2F223L), and a clonal population of Mfn2-null cells transduced with empty vector (Mfn1+/+ Mfn2−/−). The indicated mitochondrial combinations were subjected to in vitro fusion conditions at 37 °C for 30 min. B, mitochondria were isolated from WT cells (Mfn1+/+ Mfn2+/+), a clonal population of Mfn1F202L-expressing Mfn1-null cells (Mfn1F202L Mfn2+/+), a clonal population of Mfn1-null cells transduced with empty vector (Mfn1−/− Mfn2+/+), a clonal population of Mfn2F223L-expressing Mfn2-null cells (Mfn1+/+ Mfn2F223L), and a clonal population of Mfn2-null cells transduced with empty vector (Mfn1+/+ Mfn2−/−). The indicated mitochondrial combinations were subjected to in vitro fusion conditions in the presence of cytosol-enriched fraction at 37 °C for 30 min. C, mitochondria were isolated from WT cells (Mfn1+/+ Mfn2+/+), a clonal population of Mfn1F202L-expressing Mfn1-null cells (Mfn1F202L Mfn2+/+), a clonal population of Mfn1-null cells transduced with empty vector (Mfn1−/− Mfn2+/+), a clonal population of Mfn2F223L-expressing Mfn2-null cells (Mfn1+/+ Mfn2F223L), and a clonal population of Mfn2-null cells transduced with empty vector (Mfn1+/+Mfn2−/−). The indicated mitochondrial combinations were subjected to in vitro fusion conditions at 37 °C for 30 min. D, mitochondria were isolated from WT cells (Mfn1+/+ Mfn2+/+), Mfn1-null cells (Mfn1−/− Mfn2+/+), Mfn2-null cells (Mfn1+/+ Mfn2−/−), a clonal population of Mfn1WT-expressing Mfn1/2 double-null cells (Mfn1WT Mfn2−/−), and a clonal population of Mfn1F202L-expressing Mfn1/2 double-null cells (Mfn1F202L Mfn2−/−). The indicated mitochondrial combinations were subjected to in vitro fusion conditions at 37 °C for 60 min. Data are expressed as a percentage of WT control reactions performed in parallel. Error bars indicate mean + S.D. from at least four independent experiments, and paired Student's t test analysis was performed to determine statistical significance *, p < 0.05; n.s., not significant.
Second, we assessed fusion of mitochondria isolated from the Mfn2-null clonal populations expressing endogenous Mfn1 with either Mfn2WT-FLAG, Mfn2F223L-FLAG, or empty vector described in Fig. 2, D and E. As expected, mitochondria isolated from the Mfn2-null cells expressing endogenous Mfn1 and Mfn2-FLAG fused at rates close to WT controls (Fig. 5A and Fig. S7B). Similar to the defect observed with the Mfn1 variant, mitochondria with Mfn1 and Mfn2F223L possessed 30% of WT fusion activity, which was also comparable with mitochondria from vector control cells that only possess Mfn1. This indicates that the replacement of phenylalanine with leucine at this position creates hypomorphic variants of Mfn1 and Mfn2 despite the high degree of mitochondrial connectivity observed in cells.
We considered the possibility that soluble factors in the cytosol were enhancing fusion in cells but were absent in the in vitro fusion assay. To test this, we added crude cytosol-enriched fractions to the in vitro fusion reactions. Consistent with previously published data (15), addition of cytosol increased fusion with WT mitochondrial moderately (∼1.2-fold) (Fig. 5B). For both the Mfn1F202L and Mfn2F223L mutant mitochondria, fusion was also stimulated (∼2-fold) when crude cytosol was included in the reaction conditions (Fig. 5B). This was modestly higher than the stimulation observed with mitochondria isolated from vector control cells. Therefore, cytosolic factors may play a role in compensating for the molecular defect and increase the fusion efficiency in cells.
The low fusion efficiency associated with homotypic Mfn1 or Mfn2 complexes can be significantly increased when partnered with WT mitochondria in trans (Fig. 5C) (15). To determine whether the fusion defects observed with Mfn1F202L and Mfn2F223L are complemented in trans, we performed in vitro fusion reactions with mitochondria isolated from WT cells and mitochondria from Mfn-null cells expressing the mutant variant as described in Fig. 5A. When Mfn1F202L Mfn2WT mitochondria were combined with Mfn1WT Mfn2WT mitochondria, fusion was ∼75% of WT controls, significantly higher than homotypic mutant fusion reactions but similar to heterotypic fusion reactions with WT and Mfn1-null mitochondria (Fig. 5C). Similarly, both Mfn2-null and Mfn1WTMfn2F223L mitochondria fused more efficiently with WT mitochondria than with themselves (Fig. 5C). These data indicate that the mutant variants have little effect on fusion when WT Mfn1–Mfn2 heterotypic complexes can form in trans.
The analysis of mitochondrial fusion in vitro indicates that despite the connected appearance of the mitochondrial network in Mfn1-null cells expressing Mfn1F202L or Mfn2-null cells expressing Mfn2F223L, the Mitofusin variants are functionally compromised. To gain insight into the molecular defect, we further characterized the fusion properties of the Mfn1F202L variant in vitro.
Mfn1F202L requires Mfn2 exclusively in trans
Although our data have established that Mfn1F202L requires WT Mfn2 for fusion activity, we sought to determine whether Mfn2 had to be present on the same membrane, in cis, or whether Mfn2 could complement on the opposite membrane, in trans. To do this, we exploited the in vitro mitochondrial fusion assay and tested specific combinations of Mitofusins both in cis and in trans. As described above, we had generated a clonal population of Mfn1/2-null MEFs expressing Mfn1F202L-FLAG at near WT levels (Fig. S6). Therefore, we could test mitochondrial fusion activity of Mfn1F202L homotypic complexes. We also constructed Mfn1/2-null cells expressing Mfn1WT-FLAG as a control (Fig. S6). Consistent with previously published data (15), mitochondria with only Mfn1WT-FLAG fused at low levels compared with WT controls (Fig. 5D and Fig. S7C). Mitochondria with only Mfn1F202L-FLAG fused significantly less than mitochondria with only Mfn1WT (2.2% and 10.4 of WT, respectively).
For both Mfn1WT and Mfn1F202L, fusion was significantly increased in heterotypic reactions with WT mitochondria (Fig. 5D). To distinguish between complementation by Mfn1, Mfn2, or both in trans, we performed in vitro fusion reactions with mitochondria from either Mfn2-null or Mfn1-null cells in combination with the mitochondria with homotypic Mfn1WT or Mfn1F202L complexes. Mitochondrial fusion was relatively inefficient when Mfn1WT was on both membranes and even lower when Mfn1WT was paired with Mfn1F202L mitochondria. In contrast, mitochondria with either Mfn1F202L or Mfn1WT had significantly higher fusion efficiency when Mfn2 was present in trans, utilizing mitochondria from Mfn1-null cells (38 and 39% of WT controls, respectively). Together, these data indicate that Mfn1F202L has impaired fusion activity that is significantly improved when Mfn2WT is present on the opposite membrane.
Mfn1F202L forms tethered complexes as efficiently as WT Mfn1
An early step in mitochondrial outer-membrane fusion is establishment of a physical interaction, or tether, between the opposing membranes. It has been proposed that the dimer interface formed by the GTPase domain is responsible for Mitofusin-dependent tethering (25, 30). To determine whether the molecular defect of the Mfn1F202L variant was in formation of a membrane tether, we developed an assay to test the physical interaction of Mitofusins on opposing mitochondrial membranes using coimmunoprecipitation analysis of two epitope tags (FLAG and eGFP) (Fig. 6, A and B). Mitochondria isolated from clonal populations of Mfn1-null MEFs expressing either Mfn1-FLAG or Mfn1-eGFP at near endogenous levels were combined and incubated in the presence or absence of the transition-state mimic GDP BeF3 to trap fusion complexes before lipid mixing. When only BeF3 was present, virtually no Mfn1WT-eGFP was coimmunoprecipitated with Mfn1WT-FLAG, indicating that no significant interaction was observed under these control conditions. In contrast, when mixed mitochondria were incubated in the presence of the transition-state mimic (GDP BeF3), Mfn1-eGFP coimmunoprecipitated with Mfn1WT-FLAG (Fig. 6B, left panel, arrowhead). This is consistent with mitochondria forming a tethered intermediate in trans where the differentially tagged Mitofusin proteins are physically interacting. Importantly, we observed no mitochondrial fusion under these conditions. To determine whether Mfn1F202L-FLAG can tether opposing membranes, we tested coimmunoprecipitation of Mfn1F202L-eGFP and Mfn1WT-eGFP proteins with Mfn1F202L-FLAG. We detected similar amounts of Mfn1F202L-eGFP and Mfn1WT-eGFP following immunoprecipitation of Mfn1F202L-FLAG, indicating that the mutant variant did not have a measurable defect in the formation of tethering complexes under these conditions (Fig. 6, B, C, and D).
Figure 6.
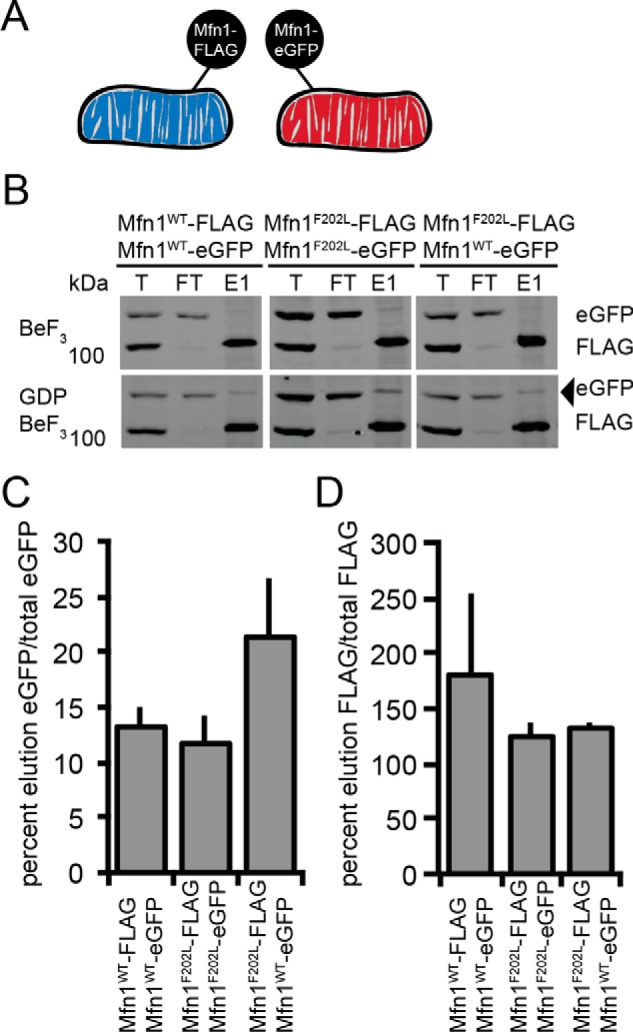
Tethering assay to assess the physical interaction of Mitofusin proteins in trans. A, schematic of the differential epitope labeling utilized in the tethering assay. B, mitochondria were isolated from a clonal population of Mfn1WT-FLAG-expressing Mfn1-null cells (Mfn1WT Mfn2+/+), a clonal population of Mfn1WTeGFP-expressing Mfn1-null cells (Mfn1WT Mfn2+/+), a clonal population of Mfn1F202LFLAG-expressing Mfn1-null cells (Mfn1F202L Mfn2+/+), and a clonal population of Mfn1F202L-eGFP-expressing Mfn1-null cells (Mfn1F202L Mfn2+/+) and incubated with BeF3 in the absence or presence of GDP. Following lysis, immunoprecipitation was performed with α-FLAG magnetic beads. Proteins eluted from the beads were subjected to SDS-PAGE and immunoblotted with α-Mfn1. The arrowhead indicates the eGFP protein eluted from FLAG beads. Total (T) represents 3% of the input, flow-through (FT) represents 3% of the unbound protein, and elution (E) represents 40% of the immunoprecipitated protein. C, the percentage of the indicated Mitofusin-eGFP in the elution compared with the total is shown as the mean +S.D. of three independent experiments. D, the percentage of the indicated Mitofusin-FLAG in the elution compared with the total is shown as the mean + S.D. of three independent experiments.
Nucleotide-dependent assembly of Mfn1F202L and Mfn2F223L is reduced
A common characteristic of the members of the dynamin family is nucleotide-dependent assembly into higher-order structures. Given that Mfn1F202L effectively formed transmembrane tethering complexes, we considered that the molecular defect was in the formation of a higher-order assembly. Therefore, we probed the assembly state of Mfn1F202L utilizing BN-PAGE analysis of detergent-solubilized mitochondria. Previously published work has shown that both Mfn1 and Mfn2 form large oligomeric complexes by BN-PAGE ranging from ∼140 to 440 kilodaltons (kDa) without nucleotide (13, 35, 36). To determine the assembly state of the Mfn1F202L variant, mitochondria were isolated from the clonal populations of the Mfn1-null cells expressing either Mfn1WT-FLAG or Mfn1F202L-FLAG described in Fig. 2. These were incubated with the indicated nucleotide, detergent-solubilized, and analyzed by BN-PAGE and Western blot analysis. The majority of both Mfn1WT and Mfn1F202L were found as a predicted dimer, which migrates slightly higher than the 146-kDa marker in untreated mitochondria (Fig. 7A, see arrow). In contrast, when mitochondria were incubated with either GTP or the nonhydrolyzable GTP analog GMPPNP, we saw a significant shift in the population to two larger species (Fig. 7, A and B, see asterisks). Mfn1F202L formed some of these large oligomers, but we observed significantly less of the mutant protein shifted to the higher molecular weight species as compared with Mfn1WT (Fig. 7B). Interestingly, we observed the same result when analyzing mitochondria with only Mfn1, isolated from the Mfn1/2-null cells expressing either Mfn1WT-FLAG or Mfn1F202L-FLAG (Fig. 7, C and D). Therefore, the formation of these oligomeric species does not require Mfn2. Under our conditions, incubation of mitochondria with the transition-state mimic GDP BeF3 also resulted in a significant shift to higher oligomeric states, which was more prominent for Mfn1WT as compared with Mfn1F202L (Fig. S8, A and B). Together, these data suggest that nucleotide-dependent assembly of Mfn1F202L is reduced. To determine whether Mfn2F223L has a similar molecular defect, we isolated mitochondria from Mfn2-null cells expressing either Mfn2WT or Mfn2F223L and analyzed assembly under the same conditions. Similar to Mfn1, we observed that most Mfn2 and Mfn2F223L migrate as a predicted dimer in the absence of additional nucleotide and that Mfn2WT forms a larger oligomer in the presence of GTP or GMPPNP. In contrast, Mfn2F223L has a greatly reduced capacity to form higher-order assemblies under the nucleotide conditions tested here. Together, these observations indicate that this mutant variant is selectively defective in nucleotide-dependent higher-order assembly. Therefore, we postulate that post-tethering nucleotide-dependent assembly is required to couple GTP hydrolysis to membrane fusion.
Figure 7.
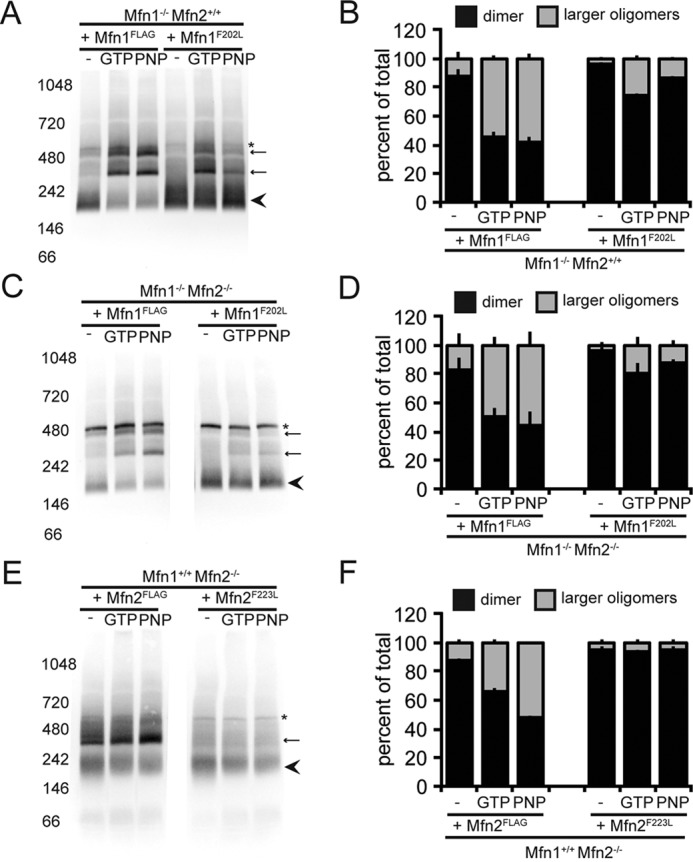
Mfn1F202L has impaired nucleotide-dependent assembly. A, mitochondria were isolated from a clonal population of Mfn1WT-expressing Mfn1-null cells (Mfn1WT Mfn2+/+) and a clonal population of Mfn1F202L-expressing Mfn1-null cells (Mfn1F202L Mfn2+/+). Mitochondria were either not treated or incubated with the specified nucleotide prior to lysis and then subjected to BN-PAGE and immunoblotting with α-FLAG. The arrowhead denotes the predicted dimer state, arrows denote the larger oligomeric species, and * denotes a nonspecific band. B, the percentage of total protein in the smaller oligomeric state (arrowhead) (predicted dimer) and the higher oligomeric states (arrows) for each condition in A is represented in the bar graph as mean + S.D. of three independent experiments. C, mitochondria were isolated from a clonal population of Mfn1WT-expressing Mfn1/2 double-null cells (Mfn1WT Mfn2−/−) and a clonal population of Mfn1F202L-expressing Mfn1/2 double-null cells (Mfn1F202L Mfn2−/−). Mitochondria were either not treated or incubated with the specified nucleotide prior to lysis and then subjected to BN-PAGE and immunoblotting with α-FLAG. The arrowhead denotes the predicted dimer state, arrows denote the larger oligomeric species, and * denotes a nonspecific band. D, the percentage of total protein in the smaller oligomeric state (arrowhead) (predicted dimer) and the higher oligomeric states (arrows) for each condition in C is represented in the bar graph as mean + S.D. of three independent experiments. E, mitochondria were isolated from a clonal population of Mfn2WT-expressing Mfn2-null cells (Mfn1+/+ Mfn2WT) and a clonal population of Mfn2F223L-expressing Mfn2-null cells (Mfn1+/+ Mfn2F223L). Mitochondria were either not treated or incubated with the specified nucleotide prior to lysis and then subjected to BN-PAGE and immunoblotting with α-FLAG. The arrowhead denotes the predicted dimer state, an arrow denotes the larger oligomeric species, and * denotes a nonspecific band. F, the percentage of total protein in the smaller oligomeric state (arrowhead) (predicted dimer) and the higher oligomeric states (arrow) for each condition in E is represented in the bar graph as mean + S.D. of three independent experiments. PNP, GMPPNP.
Discussion
In this work, we have performed an extensive functional assessment of both Mitofusin paralogs with a mutation at a conserved position on β strand 4G. The variant Mfn2F223L is associated with the neurodegenerative disease CMT2A, which is inherited in a dominant fashion. In the structure obtained with Mfn1IM, Phe-202 is located in an aromatic network that also includes phenylalanine at positions 81, 112, 219, 220, 263, and 320 (Fig. S7). The conversion to leucine at position 202 may destabilize this feature and lead to the observed fusion and assembly defects.
Our analysis indicates that basal enzyme activity is not markedly impacted. This activity was assessed utilizing a construct lacking the second helical bundle and transmembrane region, suggesting that the defect associated with the mutation is best evaluated in the context of the full-length protein. Rescue experiments utilizing established and well-characterized null cells do not suggest a complete loss of function as each Mfn1F202L and Mfn2F223L restore the reticular mitochondrial network in Mfn1-null and Mfn2-null cells, respectively. This type of complementation has been previously demonstrated for other Mfn2 mutant variants associated with CMT2A (18), but this is the first report of a mutant variant of Mfn1 that is functionally complemented by Mfn2. In contrast to WT Mfn1, which can mediate fusion with several variants of Mfn2 that are nonfunctional on their own, Mfn1F202L requires Mfn2 to have catalytic function. This denotes a novel class of Mfn1 mutant and extends our understanding of the heterotypic fusion complex and indicates that not only can Mfn1 compensate for defects in Mfn2, but the reverse is also true. Our data suggest that Mfn2 need not hydrolyze GTP when Mfn1 is present. This is similar to Mgm1, the yeast mitochondrial inner-membrane fusion machine, which only requires GTPase activity in the short isoform and not the membrane-anchored long isoform (37). From our data, we speculate that although Mfn1 must hydrolyze GTP, a defect in nucleotide-dependent higher-order assembly can be overcome if Mfn1 is partnered with WT Mfn2. In the context of vertebrate cells that express both Mfn1 and Mfn2, this provides significant protection against deleterious mutations.
The collapsed perinuclear mitochondrial distribution in Mfn1-null cells expressing Mfn1F202L reveals another unique property of this variant. We do not see the same coalescence in the perinuclear region in WT cells expressing this variant, indicating that the phenotype is not dominant. Perinuclear clusters of mitochondria have also been observed in cells overexpressing Mfn1/2 or the dominant-negative variants of Drp1, the mitochondrial division machine. In the latter case, disruption of the microtubule network also releases the cluster to reveal a highly connected network (19). The cells analyzed here are not overexpressing the Mitofusin, making it unlikely that these clusters are equivalent to those formed by high Mitofusin protein levels. Our data indicate that Mfn1F202L uniquely alters mitochondrial transport to favor retrograde-directed movement and it is unclear why the same phenotype is not observed with the Mfn2 mutant variant. Given the very high degree of connectivity of the mitochondrial networks in cells expressing Mfn1F202L and Mfn2, the perinuclear clustering may facilitate fusion by establishing proximity of mitochondria in the cell.
Significantly, our analysis of mitochondrial fusion efficiency in vitro revealed that both Mfn1F202L and Mfn2F223L variants were defective for membrane fusion. This defect was diminished upon the addition of crude cytosol extract to the reactions, suggesting that cytosolic factors contribute to fusion in cells, where mitochondrial structure was consistent with no fusion deficiency. Our analysis of Mfn1F202L in different Mfn-null cells indicates that Mfn2 is required for fusion activity. Therefore, to directly test for functional complementation of the mutant variant, we generated clonal populations of Mfn1/2 double-null cells expressing Mfn1F202L or Mfn1WT as a control. Mitochondria isolated from these cells fused most efficiently with a WT partner, but rates of fusion were also relatively high when WT Mfn2 homotypic complexes were paired in trans. In contrast, homotypic fusion with either Mfn1WT or Mfn1F202L was very low. These data confirm and extend our understanding of the role of Mfn1 and Mfn2 on opposite membranes and indicate that variants of Mfn1 that are nonfunctional alone can contribute to fusion when WT Mfn2 is present.
We further dissected the steps of membrane fusion and developed an assay to measure the tethering efficiency of the Mitofusins. With this assay, we found that Mfn1WT and Mfn1F202L can physically interact across two membranes with similar efficiency. These data indicate that the defect in mitochondrial fusion is not likely to be at the initial step of membrane tethering. In contrast, we report a difference in nucleotide-dependent assembly of the mutant variant compared with WT controls. Together, these data suggest that the Mfn1F202L does not efficiently couple tethering to subsequent steps in membrane fusion, which includes nucleotide-dependent assembly. Therefore, we postulate that following nucleotide-dependent tethering, higher-order assembly is required to drive membrane fusion.
Experimental procedures
Cell culture
All cells were grown at 37 °C and 5% CO2 and cultured in Dulbecco's modified Eagle's medium (Thermo Fisher Scientific) containing 1× GlutaMAX (Thermo Fisher Scientific) with 10% fetal bovine serum (Seradigm) or 15% fetal bovine serum for Mfn1/2-null mouse embryonic fibroblasts and 1% penicillin/streptomycin (Thermo Fisher Scientific). Mouse embryonic fibroblasts cells (Mfn WT, Mfn1-null, Mfn2-null, and Mfn1/2-null) were purchased from ATCC.
Retroviral transduction and generation of clonal populations
Plat-E cells (Cell Biolabs) were maintained in complete media supplemented with 1 μg/ml puromycin and 10 μg/ml blasticidin and plated at ∼80% confluence the day prior to transfection. Plat-E cells were transfected with FuGENETM HD (Promega), and transfection reagent was incubated overnight before a media change. Viral supernatants were collected at ∼48, 56, 72, and 80 h post-transfection and incubated with MEFs in the presence of 8 mg/ml Polybrene. Approximately 16 h after the last viral transduction, MEF cells were split, and selection agent was added if needed (1 μg/ml puromycin or 200 μg/ml hygromycin).
Clonal populations were generated by plating cells at very low density, and clones were collected onto sterile filter paper dots soaked in trypsin. Following expansion, whole-cell extracts from clonal populations were screened by Western blot analysis for Mitofusin against WT controls.
Transfection and microscopy
All cells were plated in Number 1.5 glass-bottomed dishes (MatTek). Mouse embryonic fibroblasts were incubated with 0.1 μg/ml MitoTracker Red CMXRos (Invitrogen) for 15 min at 37 °C with 5% CO2, washed, and incubated with complete media for at least 45 min prior to imaging. Cells treated with nocodazole were first incubated with 0.1 μg/ml MitoTracker Red CMXRos for 15 min at 37 °C with 5% CO2, washed, incubated with complete media for at least 45 min, and then changed into complete media with 5 μm nocodazole. Cells were incubated with nocodazole for 45 min to 1 h before imaging. MEFs were imaged at 37 °C with 5% CO2. A Z-series with a step size of 0.3 μm was collected with a Nikon Ti-E widefield microscope with a 63× NA 1.4 oil objective (Nikon), a solid-state light source (SPECTRA X, Lumencor), and an sCMOS camera (Zyla 5.5 Megapixel). Each cell line was imaged on at least three separate occasions (n > 100 cells per experiment).
Image analysis
Images were deconvolved using eight to 15 iterations of 3D Landweber deconvolution. Deconvolved images were then analyzed using Nikon Elements software. Maximum intensity projections were created using NIH ImageJ software. Mitochondrial morphology was scored as follows: hyperfused indicates that the entire mitochondrial network in the cell was connected as a single structure; reticular indicates that fewer than 30% of the mitochondria in the cell were fragments (fragments defined as mitochondria less than 2 μm in length); fragmented indicates that most of the mitochondria in the cell were less than 2 μm in length; aggregated indicates fragmented mitochondria that were not distributed throughout the cytosol.
Preparation of mitochondria or cytosol-enriched fraction
For each experiment, three to five 15-cm plates each of MEFs stably expressing either mitochondria-targeted TagRFP or CFP were grown to ∼90% confluence. Cells were harvested by cell scraping, pelleted, and washed in mitochondrial isolation buffer (MIB) (0.2 m sucrose, 10 mm Tris-MOPS (pH 7.4), 1 mm EGTA). The cell pellet was resuspended in 1 cell-pellet volume of cold MIB, and cells were homogenized by 10–14 strokes on ice with a Kontes Potter–Elvehjem tissue grinder set at 400 rpm. The homogenate was centrifuged (500 × g, 5 min, 4 °C) to remove nuclei and unbroken cells, and homogenization of the pellet fraction was repeated followed by centrifugation (500 × g, 5 min, 4 °C). The supernatant fractions were combined and centrifuged again (500 × g, 5 min, 4 °C) to remove remaining debris. The supernatant was transferred to a clean microcentrifuge tube and centrifuged (7,400 × g, 10 min, 4 °C) to pellet a crude mitochondrial fraction. The postmitochondrial supernatant fraction was saved as the cytosol-enriched fraction. The crude mitochondrial pellet was resuspended in a small volume of MIB. Protein concentrations of fractions were determined by Bradford assay (Bio-Rad).
In vitro mitochondrial fusion
An equivalent mass (10–12.5 μg) of TagRFP and CFP mitochondria were mixed, washed in 500 μl of MIB, and concentrated by centrifugation (7400 × g, 10 min, 4 °C). Following a 10-min incubation on ice, the supernatant was removed, and the mitochondrial pellet was resuspended in 10 μl of fusion buffer (20 mm PIPES-KOH (pH 6.8), 150 mm KOAc, 5 mm Mg(OAc)2, 0.4 m sorbitol, 0.12 mg/ml creatine phosphokinase, 40 mm creatine phosphate, 1.5 mm ATP, 1.5 mm GTP) or 10 μl of cytosol-enriched buffer (2.5 μl of the cytosol-enriched fraction obtained from WT MEFs and 7.5 μl of fusion buffer). Fusion reactions were incubated at 37 °C for 30 or 60 min.
Analysis of mitochondrial fusion
Mitochondria were imaged on depression microscope slides by pipetting 4 μl of fusion reaction onto a 3% low-melt agarose bed made in modified fusion buffer (20 mm PIPES-KOH (pH 6.8), 150 mm KOAc, 5 mm Mg(OAc)2, 0.4 m sorbitol). A Z-series of six 0.2-μm steps was collected with a Nikon Ti-E widefield microscope with a 100× NA 1.4 oil objective (Nikon), a solid-state light source (SPECTRA X), and a sCMOS camera (Zyla 5.5 Megapixel). For each condition tested, mitochondrial fusion was assessed by counting ≥300 total mitochondria per condition from ≥4 images per condition (50–200 mitochondria per image collected), and fusion was scored by colocalization of the red and cyan fluorophores in three dimensions.
Photoactivatable mt-GFP
Cells transduced with mito-PAGFP (Addgene catalog number 23348) were plated in Number 1.5 glass-bottomed dishes (MatTek). Mouse embryonic fibroblasts were incubated with 0.1 μg/ml MitoTracker Red CMXRos for 15 min at 37 °C with 5% CO2, washed, and incubated with complete media for at least 45 min prior to imaging. MEFs were imaged at 37 °C with 5% CO2. A region that was ∼1 μm2 was activated using a 405 nm laser, and the same cell was imaged after 50 min. Images were collected with a Nikon Ti-E widefield microscope with a 63× NA 1.4 oil objective (Nikon), a solid-state light source (SPECTRA X), and an sCMOS camera (Zyla 5.5 Megapixel).
Protein expression and purification
Mfn1IMC pET28 plasmid was obtained from Song Gao (25). Mutations were made by Gibson assembly and confirmed by sequencing. Mfn1IM constructs were expressed in Escherichia coli Rosetta (DE3) cells. Cells were cultured in Luria-Bertani medium with 150 μg/ml ampicillin and 25 μg/ml chloramphenicol at 37 °C to an OD600 of ∼0.6, and protein expression was induced by the addition of 100 μm isopropyl 1-thio-β-d-galactopyranoside. Induced cultures were grown overnight at ∼17–18 °C. The cells were harvested by centrifugation at 6,000 × g for 10 min. Cell pellets expressing MFN1IM were resuspended in 5 ml of PBS, pelleted by centrifugation at 6,000 × g for 5 min, frozen in liquid nitrogen, and stored at −80 °C. Cells were thawed in a room-temperature water bath and resuspended in 50 ml of 50 mm HEPES-KOH (pH 7.4), 400 mm NaCl, 5 mm MgCl2, 30 mm imidazole, 1 mm phenylmethanesulfonylfluoride, 1× protease inhibitor mixture (Thermo Scientific), 2.5 mm β-mercaptoethanol (β-ME) and lysed using a microfluidizer (Avestin). The lysate was subjected to centrifugation at 14,000 rpm for 45 min. The supernatant was applied to 2.5 ml of HisPurTM Ni-NTA beads (Thermo Scientific) equilibrated with binding buffer 1 (20 mm HEPES-KOH (pH 7.4), 400 mm NaCl, 5 mm MgCl2, 30 mm imidazole (pH 8.0), 2.5 mm β-ME) and nutated at 4 °C for 30 min. Ni-NTA beads bound to protein were washed with 20 column volumes of binding buffer 1, and proteins were eluted with elution buffer (20 mm HEPES-KOH (pH 7.4), 400 mm NaCl, 5 mm MgCl2, 300 mm imidazole, 2.5 mm β-ME). Mfn1IMC-containing elutions were incubated with 800 μg of GSH S-transferase (GST)-fused PreScission protease to remove the N-terminal His6 tag. This was dialyzed overnight against binding buffer 2 (20 mm HEPES-KOH (pH 7.4), 400 mm NaCl, 5 mm MgCl2, 2.5 mm β-ME). After dialysis, PreScission protease was removed using a GST column. The protein was reapplied to a second Ni-NTA column equilibrated with binding buffer 2. Binding buffer 1 was used to elute the protein, which was subsequently loaded onto a Superdex200 16/60 column (GE Healthcare) equilibrated with gel filtration buffer (20 mm HEPES-KOH (pH 7.4), 150 mm NaCl, 5 mm MgCl2, 1 mm DTT). The protein eluted in a discrete peak corresponding to a molecular mass of ∼50 kDa. Protein was concentrated on an Amicon Ultra Centrifugal Filter (molecular weight cutoff, 30,000) (Millipore) to 30 mg/ml, and glycerol was added to 20% before the protein was aliquoted and stored at −80 °C. Protein purification was performed at 4 °C. Protein concentration was determined by Bradford assay (Bio-Rad).
BN-PAGE
Isolated mitochondria (15–30 μg) were incubated with or without 2 mm nucleotide, 2.5 mm BeSO4, and 25 mm NaF as indicated in 0.2 m sucrose, 10 mm Tris-MOPS (pH 7.4), 1 mm EGTA, 5 mm Mg(OAc)2 buffer at 37 °C for 30 min. Mitochondria were then lysed in 1% (w/v) digitonin, 50 mm Bis-Tris, 50 mm NaCl, 10% (w/v) glycerol, 0.001% Ponceau S (pH 7.2) for 15 min on ice. Lysates were centrifuged at 16,000 × g at 4 °C for 30 min. The cleared lysate was mixed with Invitrogen NativePAGETM 5% G-250 Sample Additive to a final concentration of 0.25%. Samples were separated on a NovexTM NativePAGE 4–16% Bis-Tris protein gels (Invitrogen) at 4 °C. Gels were run at 40 V for 30 min and then 100 V for 30 min with dark cathode buffer (1× NativePAGE Running Buffer (Invitrogen), 0.02% (w/v) Coomassie G-250). Dark cathode buffer was replaced with light cathode buffer (1× NativePAGE Running Buffer (Invitrogen), 0.002% (w/v) Coomassie G-250), and the gel was run at 100 V for 30 min and subsequently at 250 V for 60–75 min until the dye front ran off the gel. After electrophoresis was complete, gels were transferred to polyvinylidene difluoride membrane (Bio-Rad) at 30 V for 16 h in transfer buffer (25 mm Tris, 192 mm glycine, 20% methanol). Membranes were incubated with 8% acetic acid for 15 min and washed with H2O for 5 min. Membranes were dried at 37 °C for 20 min, then rehydrated in 100% methanol, and washed in H2O. Membranes were blocked in 4% milk for 20 min and probed with anti-FLAG (Sigma) for 4 h at room temperature or overnight at 4 °C. Membranes were incubated with horseradish peroxidase–linked secondary antibody (Cell Signaling Technology) at room temperature for 1 h. Membranes were developed in SuperSignal Femto ECL reagent (Thermo Fisher Scientific) for 5 min and imaged on an iBright Imaging System (Thermo Fisher Scientific). Band intensities were quantified using NIH ImageJ software. NativeMark Unstained Protein Standard (Life Technologies) was used to estimate molecular weights of Mitofusin protein complexes.
Tethering coimmunoprecipitation
Differentially tagged isolated mitochondrial populations (50 μg each) were mixed together. Mitochondria were incubated at 37 °C for 30 min with beryllium fluoride (2.5 mm BeSO4, 25 mm NaF) with or without 2 mm GDP in fusion buffer (20 mm PIPES-KOH (pH 6.8), 150 mm KOAc, 5 mm Mg(OAc)2, 0.4 m sorbitol with 0.12 mg/ml creatine kinase, 40 mm creatine phosphate, and 1.5 mm ATP). Mitochondria were solubilized in lysis buffer (20 mm HEPES-KOH (pH 7.4), 50 mm KCl, 5 mm MgCl2) with 1.5% (w/v) n-dodecyl β-d-maltoside, and 1× Halt protease inhibitor (Thermo Scientific) for 30 min on ice. Lysates were cleared at 10,000 × g for 15 min at 4 °C. Supernatant was incubated with 50 μl of magnetic μMACS anti-DYKDDDDK MicroBeads (Miltenyi Biotec) for 30 min on ice. The sample was applied to a MACS column (Miltenyi Biotec) placed in the magnetic field using a μMACS Separator (Miltenyi Biotec) and washed twice with 400 μl of 20 mm HEPES-KOH (pH 7.4), 50 mm KCl, 5 mm MgCl2, 0.1% n-dodecyl β-d-maltoside and once with 200 μl of 20 mm HEPES-KOH (pH 7.4), 50 mm KCl, 5 mm MgCl2. One column volume (25 μl) of SDS-PAGE loading buffer (60 mm Tris-HCl (pH 6.8), 2.5% SDS, 5% β-ME, 5% sucrose, 0.1% bromphenol blue) was incubated for 15 min at room temperature, and proteins were eluted twice with 35 μl of SDS-PAGE loading buffer. The majority of the protein eluted in the first 35-μl elution. Samples were run on an SDS-polyacrylamide gel and transferred onto nitrocellulose at 94 V for 1 h in 1× transfer buffer. Membranes were blocked in 4% milk for at least 45 min and probed with anti-Mfn1 antibody for 4 h at room temperature or overnight at 4 °C. Membranes were incubated with DyLight secondary antibody (Invitrogen) at room temperature for 1 h. Membranes were imaged on a LI-COR Imaging System (LI-COR Biosciences).
Western blot analysis
Protein lysates from MEFs were obtained by resuspending PBS-washed cells in radioimmune precipitation assay lysis buffer (150 mm NaCl, 1% Nonidet P-40, 1% sodium deoxycholate, 0.1% SDS, 25 mm Tris (pH 7.4), 1× Halt protease inhibitor mixture, EDTA-free (Thermo Scientific)). Samples were incubated on ice for 15 min and then spun at 21,000 × g for 15 min at 4 °C. Supernatant was transferred to a clean tube, and protein concentration was measured by BCA assay (Thermo Scientific). Samples were run on an SDS-polyacrylamide gel and transferred onto nitrocellulose at 94 V for 1 h in 1× transfer buffer. Membranes were blocked in 4% milk for at least 45 min and probed with anti-Mfn1, anti-Mfn2 (Sigma), anti-voltage-dependent anion channel (Invitrogen), or anti-tubulin (Invitrogen) antibody for 4 h at room temperature or overnight at 4 °C. Membranes were incubated with DyLight secondary antibody at room temperature for 1 h. Membranes were imaged on a LI-COR Imaging System.
GTPase assay
Frozen protein was thawed on ice and diluted to 2.5 μm in 20 mm HEPES-KOH (pH 7.4), 50 mm KCl, 5 mm MgCl2, 1 mm DTT. Protein concentrations were confirmed by Bradford assay (Bio-Rad). Reactions were set up in triplicate in a 96-well plate on ice. Variable concentrations of GTP were added, and reactions were incubated at 37 °C for 15 min. Reactions were stopped by adding 200 mm EDTA on ice. Concentrations of free Pi were measured by malachite green reagent. Malachite green reagent was added, and reactions were incubated at room temperature for 15 min. The optical density at 650 nm was measured, and a potassium phosphate standard curve was used to determine the amount of GTP hydrolyzed.
Plasmids and primers
The following plasmids were purchased from Addgene: pBABE-hygro (catalog number 1765), pBABE-puro (catalog number 1764), mito-PAGFP (catalog number 23348), pclbw-mito TagRFP (catalog number 58425), and pclbw-mitoCFP (catalog number 58426). The Mfn1IMC pET28 plasmid was a kind gift from Song Gao (25). The following primers were used to for site-directed mutagenesis by Gibson assembly: Mfn1F202L Human F (5′-CTAGATGCTGATGTCTTAGTTTTGGTCGCAAAC-3′), Mfn1F202L Human R (5′-GTTTGCGACCAAAACTAAGACATCAGCATCTAG-3′), Mfn1F202L Mouse F (5′-GCCTGGATGCTGATGTGTTGGTGCTGGTGGCCAAC-3′), Mfn1F202L Mouse R (5′-GTTGGCCACCAGCACCAACACATCAGCATCCAGGC-3′), Mfn1W239A Mouse F (5′-CTGAATAACCGTGCGGATGCTTCTGCTTCGG-3′), Mfn1W239A Mouse R (5′-CCGAAGCAGAAGCATCCGCACGGTTATTCAG-3′), Mfn2W260A Mouse F (5′-CATCCTGAACAACCGCGCGGATGCGTCTGCCTCGG-3′), Mfn2W260A Mouse R (5′-CCGAGGCAGACGCATCCGCGCGGTTGTTCAGGATG-3′), Mfn1R83W Mouse F (5′-CATTTTTTGGCTGGACAAGTAGTGG-3′), Mfn1R83W Mouse R (5′-CCACTACTTGTCCAGCCAAAAAATG-3′), Mfn1H107R Mouse F (5′-AGCGGGATTGGTAGGACAACCAACTGC-3′), Mfn1H107R Mouse R (5′-GCAGTTGGTTGTCCTACCAATCCCGCT-3′), Mfn1T109A Mouse F (5′-GATTGGTCACACAGCAAACTGCTTCCTG-3′), Mfn1T109A Mouse R (5′-CAGGAAGCAGTTTGCTGTGTGACCAATC-3′), Mfn1A143V Mouse F (5′-TGTTAATCAGCTGGTGCATGCCCTCCAT-3′), Mfn1A143V Mouse R (5′-ATGGAGGGCATGCACCAGCTGATTAACA-3′), Mfn1H144R Mouse F (5′-AATCAGCTGGCCAGGGCCCTCCATATG-3′), Mfn1H144R Mouse R (5′-CATATGGAGGGCCCTGGCCAGCTGATT-3′), Mfn1D178A Mouse F (5′-CCTGGTTTTAGTAGCAAGCCCAGGTACAGA-3′), Mfn1D178A Mouse R (5′-TCTGTACCTGGGCTTGCTACTAAAACCAGG-3′), Mfn1P230A Mouse F (5′-TGAGCGGCTCTCCAAGGCCAACA-3′), Mfn1P230A Mouse R (5′-TGTTGGCCTTGGAGAGCCGCTCA-3′), Mfn1V252G Mouse F (5′-AGTACATGGAGGATGGGCGCAGA-3′), Mfn1V252G Mouse R (5′-TCTGCGCCCATCCTCCATGTACT-3′), Mfn1Q255R Mouse F (5′-GATGTGCGCAGAAGGCACATGGAGAGA-3′), Mfn1Q255R Mouse R (5′-TCTCTCCATGTGCCTTCTGCGCACATC-3′), Mfn1R259H Mouse F (5′-CAGCACATGGAGCATTGTCTTCACTTCTTGGTAGAAG-3′), Mfn1R259H Mouse R (5′-CTTCTACCAAGAAGTGAAGACAATGCTCCATGTGCTG-3′), Mfn1F263Y Mouse F (5′-AGAGATGTCTTCACTACTTGGTAGAAGAG-3′), Mfn1F263Y Mouse R (5′-CTCTTCTACCAAGTAGTGAAGACATCTCT-3′), Mfn2F223L Mouse F (5′-GCCTGGATGCTGATGTGTTGGTGCTGGTGGCCAAC-3′), and Mfn2F223L Mouse R (5′-GTTGGCCACCAGCACCAACACATCAGCATCCAGGC-3′).
Author contributions
E. A. E. and S. H. conceptualization; E. A. E. data curation; E. A. E. and S. H. formal analysis; E. A. E. and S. H. funding acquisition; E. A. E. and S. H. investigation; E. A. E. visualization; E. A. E. and S. H. methodology; E. A. E. and S. H. writing-original draft; S. H. resources; S. H. supervision; S. H. project administration; S. H. writing-review and editing.
Supplementary Material
Acknowledgments
We thank members of the Hoppins laboratory, Laura Lackner, and Marijn Ford for scientific suggestions and critical reading of the manuscript.
This work was supported by the University of Washington Department of Biochemistry and NIGMS, National Institutes of Health Grants R01 GM118509 (to S. H.) and T32GM008268 (to E. A. E.). The authors declare that they have no conflicts of interest with the contents of this article. The content is solely the responsibility of the authors and does not necessarily represent the official views of the National Institutes of Health.
This article contains Figs. S1–S9 and Table S1.
- DRP or Drp
- dynamin-related protein
- Mfn
- Mitofusin
- CMT2A
- Charcot–Marie–Tooth syndrome type 2A
- MEF
- mouse embryonic fibroblast
- eGFP
- enhanced GFP
- mt-paGFP
- mitochondrial matrix–targeted photoactivatable GFP
- ROI
- region of interest
- BN
- blue native
- GMPPNP
- 5′-guanylyl imidodiphosphate
- RFP
- red fluorescent protein
- CFP
- cyan fluorescent protein
- MIB
- mitochondrial isolation buffer
- NA
- numerical aperture
- β-ME
- β-mercaptoethanol
- Ni-NTA
- nickel-nitrilotriacetic acid
- Bis-Tris
- 2-[bis(2-hydroxyethyl)amino]-2-(hydroxymethyl)propane-1,3-diol
- F
- forward
- R
- reverse.
References
- 1. Labbé K., Murley A., and Nunnari J. (2014) Determinants and functions of mitochondrial behavior. Annu. Rev. Cell Dev. Biol. 30, 357–391 10.1146/annurev-cellbio-101011-155756 [DOI] [PubMed] [Google Scholar]
- 2. Chan D. C. (2012) Fusion and fission: interlinked processes critical for mitochondrial health. Annu. Rev. Genet. 46, 265–287 10.1146/annurev-genet-110410-132529 [DOI] [PubMed] [Google Scholar]
- 3. Dorn G. W., 2nd (2019) Evolving concepts of mitochondrial dynamics. Annu. Rev. Physiol. 81, 1–17 10.1146/annurev-physiol-020518-114358 [DOI] [PubMed] [Google Scholar]
- 4. Itoh K., Nakamura K., Iijima M., and Sesaki H. (2013) Mitochondrial dynamics in neurodegeneration. Trends Cell Biol. 23, 64–71 10.1016/j.tcb.2012.10.006 [DOI] [PMC free article] [PubMed] [Google Scholar]
- 5. Nasrallah C. M., and Horvath T. L. (2014) Mitochondrial dynamics in the central regulation of metabolism. Nat. Rev. Endocrinol. 10, 650–658 10.1038/nrendo.2014.160 [DOI] [PubMed] [Google Scholar]
- 6. Pareyson D., Saveri P., Sagnelli A., and Piscosquito G. (2015) Mitochondrial dynamics and inherited peripheral nerve diseases. Neurosci. Lett. 596, 66–77 10.1016/j.neulet.2015.04.001 [DOI] [PubMed] [Google Scholar]
- 7. Pernas L., and Scorrano L. (2016) Mito-morphosis: mitochondrial fusion, fission, and cristae remodeling as key mediators of cellular function. Annu. Rev. Physiol. 78, 505–531 10.1146/annurev-physiol-021115-105011 [DOI] [PubMed] [Google Scholar]
- 8. Santel A., and Fuller M. T. (2001) Control of mitochondrial morphology by a human mitofusin. J. Cell Sci. 114, 867–874 [DOI] [PubMed] [Google Scholar]
- 9. Cipolat S., Martins de Brito O., Dal Zilio B., and Scorrano L. (2004) OPA1 requires mitofusin 1 to promote mitochondrial fusion. Proc. Natl. Acad. Sci. U.S.A. 101, 15927–15932 10.1073/pnas.0407043101 [DOI] [PMC free article] [PubMed] [Google Scholar]
- 10. Mishra P., Carelli V., Manfredi G., and Chan D. C. (2014) Proteolytic cleavage of Opa1 stimulates mitochondrial inner membrane fusion and couples fusion to oxidative phosphorylation. Cell Metab. 19, 630–641 10.1016/j.cmet.2014.03.011 [DOI] [PMC free article] [PubMed] [Google Scholar]
- 11. Song Z., Ghochani M., McCaffery J. M., Frey T. G., and Chan D. C. (2009) Mitofusins and OPA1 mediate sequential steps in mitochondrial membrane fusion. Mol. Biol. Cell 20, 3525–3532 10.1091/mbc.e09-03-0252 [DOI] [PMC free article] [PubMed] [Google Scholar]
- 12. Ban T., Ishihara T., Kohno H., Saita S., Ichimura A., Maenaka K., Oka T., Mihara K., and Ishihara N. (2017) Molecular basis of selective mitochondrial fusion by heterotypic action between OPA1 and cardiolipin. Nat. Cell Biol. 19, 856–863 10.1038/ncb3560 [DOI] [PubMed] [Google Scholar]
- 13. Ishihara N., Eura Y., and Mihara K. (2004) Mitofusin 1 and 2 play distinct roles in mitochondrial fusion reactions via GTPase activity. J. Cell Sci. 117, 6535–6546 10.1242/jcs.01565 [DOI] [PubMed] [Google Scholar]
- 14. Chen H., Detmer S. A., Ewald A. J., Griffin E. E., Fraser S. E., and Chan D. C. (2003) Mitofusins Mfn1 and Mfn2 coordinately regulate mitochondrial fusion and are essential for embryonic development. J. Cell Biol. 160, 189–200 10.1083/jcb.200211046 [DOI] [PMC free article] [PubMed] [Google Scholar]
- 15. Hoppins S., Edlich F., Cleland M. M., Banerjee S., McCaffery J. M., Youle R. J., and Nunnari J. (2011) The soluble form of Bax regulates mitochondrial fusion via MFN2 homotypic complexes. Mol. Cell 41, 150–160 10.1016/j.molcel.2010.11.030 [DOI] [PMC free article] [PubMed] [Google Scholar]
- 16. Stuppia G., Rizzo F., Riboldi G., Del Bo R., Nizzardo M., Simone C., Comi G. P., Bresolin N., and Corti S. (2015) MFN2-related neuropathies: clinical features, molecular pathogenesis and therapeutic perspectives. J. Neurol. Sci. 356, 7–18 10.1016/j.jns.2015.05.033 [DOI] [PubMed] [Google Scholar]
- 17. Züchner S., Mersiyanova I. V., Muglia M., Bissar-Tadmouri N., Rochelle J., Dadali E. L., Zappia M., Nelis E., Patitucci A., Senderek J., Parman Y., Evgrafov O., Jonghe P. D., Takahashi Y., Tsuji S., et al. (2004) Mutations in the mitochondrial GTPase mitofusin 2 cause Charcot-Marie-Tooth neuropathy type 2A. Nat. Genet. 36, 449–451 10.1038/ng1341 [DOI] [PubMed] [Google Scholar]
- 18. Detmer S. A., and Chan D. C. (2007) Complementation between mouse Mfn1 and Mfn2 protects mitochondrial fusion defects caused by CMT2A disease mutations. J. Cell Biol. 176, 405–414 10.1083/jcb.200611080 [DOI] [PMC free article] [PubMed] [Google Scholar]
- 19. Smirnova E., Shurland D. L., Ryazantsev S. N., and van der Bliek A. M. (1998) A human dynamin-related protein controls the distribution of mitochondria. J. Cell Biol. 143, 351–358 10.1083/jcb.143.2.351 [DOI] [PMC free article] [PubMed] [Google Scholar]
- 20. Antonny B., Burd C., De Camilli P., Chen E., Daumke O., Faelber K., Ford M., Frolov V. A., Frost A., Hinshaw J. E., Kirchhausen T., Kozlov M. M., Lenz M., Low H. H., McMahon H., et al. (2016) Membrane fission by dynamin: what we know and what we need to know. EMBO J. 35, 2270–2284 10.15252/embj.201694613 [DOI] [PMC free article] [PubMed] [Google Scholar]
- 21. Friedman J. R., and Nunnari J. (2014) Mitochondrial form and function. Nature 505, 335–343 10.1038/nature12985 [DOI] [PMC free article] [PubMed] [Google Scholar]
- 22. Koshiba T., Detmer S. A., Kaiser J. T., Chen H., McCaffery J. M., and Chan D. C. (2004) Structural basis of mitochondrial tethering by mitofusin complexes. Science 305, 858–862 10.1126/science.1099793 [DOI] [PubMed] [Google Scholar]
- 23. Meeusen S., McCaffery J. M., and Nunnari J. (2004) Mitochondrial fusion intermediates revealed in vitro. Science 305, 1747–1752 10.1126/science.1100612 [DOI] [PubMed] [Google Scholar]
- 24. Daumke O., and Roux A. (2017) Mitochondrial homeostasis: how do dimers of mitofusins mediate mitochondrial fusion. Curr. Biol. 27, R353–R356 10.1016/j.cub.2017.03.024 [DOI] [PubMed] [Google Scholar]
- 25. Cao Y. L., Meng S., Chen Y., Feng J. X., Gu D. D., Yu B., Li Y. J., Yang J. Y., Liao S., Chan D. C., and Gao S. (2017) MFN1 structures reveal nucleotide-triggered dimerization critical for mitochondrial fusion. Nature 542, 372–376 10.1038/nature21077 [DOI] [PMC free article] [PubMed] [Google Scholar]
- 26. Bian X., Klemm R. W., Liu T. Y., Zhang M., Sun S., Sui X., Liu X., Rapoport T. A., and Hu J. (2011) Structures of the atlastin GTPase provide insight into homotypic fusion of endoplasmic reticulum membranes. Proc. Natl. Acad. Sci. U.S.A. 108, 3976–3981 10.1073/pnas.1101643108 [DOI] [PMC free article] [PubMed] [Google Scholar]
- 27. Byrnes L. J., and Sondermann H. (2011) Structural basis for the nucleotide-dependent dimerization of the large G protein atlastin-1/SPG3A. Proc. Natl. Acad. Sci. U.S.A. 108, 2216–2221 10.1073/pnas.1012792108 [DOI] [PMC free article] [PubMed] [Google Scholar]
- 28. Hu J., and Rapoport T. A. (2016) Fusion of the endoplasmic reticulum by membrane-bound GTPases. Semin. Cell Dev. Biol. 60, 105–111 10.1016/j.semcdb.2016.06.001 [DOI] [PubMed] [Google Scholar]
- 29. Qi Y., Yan L., Yu C., Guo X., Zhou X., Hu X., Huang X., Rao Z., Lou Z., and Hu J. (2016) Structures of human mitofusin 1 provide insight into mitochondrial tethering. J. Cell Biol. 215, 621–629 10.1083/jcb.201609019 [DOI] [PMC free article] [PubMed] [Google Scholar]
- 30. Yan L., Qi Y., Huang X., Yu C., Lan L., Guo X., Rao Z., Hu J., and Lou Z. (2018) Structural basis for GTP hydrolysis and conformational change of MFN1 in mediating membrane fusion. Nat. Struct. Mol. Biol. 25, 233–243 10.1038/s41594-018-0034-8 [DOI] [PubMed] [Google Scholar]
- 31. Brandt T., Cavellini L., Kühlbrandt W., and Cohen M. M. (2016) A mitofusin-dependent docking ring complex triggers mitochondrial fusion in vitro. Elife 5, e14618 10.7554/eLife.14618 [DOI] [PMC free article] [PubMed] [Google Scholar]
- 32. Kijima K., Numakura C., Izumino H., Umetsu K., Nezu A., Shiiki T., Ogawa M., Ishizaki Y., Kitamura T., Shozawa Y., and Hayasaka K. (2005) Mitochondrial GTPase mitofusin 2 mutation in Charcot-Marie-Tooth neuropathy type 2A. Hum. Genet. 116, 23–27 10.1007/s00439-004-1199-2 [DOI] [PubMed] [Google Scholar]
- 33. Chen H., Chomyn A., and Chan D. C. (2005) Disruption of fusion results in mitochondrial heterogeneity and dysfunction. J. Biol. Chem. 280, 26185–26192 10.1074/jbc.M503062200 [DOI] [PubMed] [Google Scholar]
- 34. Valente A. J., Maddalena L. A., Robb E. L., Moradi F., and Stuart J. A. (2017) A simple ImageJ macro tool for analyzing mitochondrial network morphology in mammalian cell culture. Acta Histochem. 119, 315–326 10.1016/j.acthis.2017.03.001 [DOI] [PubMed] [Google Scholar]
- 35. Karbowski M., Norris K. L., Cleland M. M., Jeong S. Y., and Youle R. J. (2006) Role of Bax and Bak in mitochondrial morphogenesis. Nature 443, 658–662 10.1038/nature05111 [DOI] [PubMed] [Google Scholar]
- 36. Steffen J., Vashisht A. A., Wan J., Jen J. C., Claypool S. M., Wohlschlegel J. A., and Koehler C. M. (2017) Rapid degradation of mutant SLC25A46 by the ubiquitin-proteasome system results in MFN1/2-mediated hyperfusion of mitochondria. Mol. Biol. Cell 28, 600–612 10.1091/mbc.e16-07-0545 [DOI] [PMC free article] [PubMed] [Google Scholar]
- 37. DeVay R. M., Dominguez-Ramirez L., Lackner L. L., Hoppins S., Stahlberg H., and Nunnari J. (2009) Coassembly of Mgm1 isoforms requires cardiolipin and mediates mitochondrial inner membrane fusion. J. Cell Biol. 186, 793–803 10.1083/jcb.200906098 [DOI] [PMC free article] [PubMed] [Google Scholar]
Associated Data
This section collects any data citations, data availability statements, or supplementary materials included in this article.