

Abstract
Screening of cellular activity for inhibitors of histone lysine modifiers is most frequently performed indirectly by analyzing changes in the total levels of histone marks targeted by lysine methylases/demethylases. However, inhibition of histone lysine modifiers often leads to local rather than total changes in histone marks. Also, because histone modifications can be modulated by more than one cellular enzyme, it is not always clear whether changes in histone marks are a direct or indirect consequence of the inhibitor treatment applied. Direct assessment of target occupation can provide a useful tool to quantify the fraction of an epigenetic modifier that is bound to a pharmacological inhibitor (target engagement). Here, we developed and used a novel chemoprobe-based immunoassay to quantify target engagement in cells. Quantification of the fraction of free KDM1A was made possible, in an immune-based assay, by coupling a biotinylated chemoprobe to a warhead capable of selectively and irreversibly binding to the free active form of KDM1A. The results obtained confirmed that this approach is able to determine the degree of target engagement in a dose-dependent manner. Furthermore, the assay can be also used on tissue extracts to analyze the in vivo pharmacokinetics and pharmacodynamics relationship of KDM1A inhibitors, as has been exemplified with ORY-1001 (iadademstat), a potent and irreversible inhibitor of KDM1A. The principle of this assay may be applied to other targets, and the KDM1A probe may be employed in chemoproteomic analyses.
Keywords: epigenetics, enzyme inactivation, pharmacokinetics, protein-drug interaction, drug development, chemoprobe, chemoproteomics, lysine demethylase, histone demethylase, FAD, translational studies, target engagement, chromatin modification, histone lysine demethylase (KDM)
Introduction
Covalent modifications of histones are closely related to the control of gene transcription. Chromatin modifications comprise an epigenetic code that is dynamically “written” and “erased” by specialized proteins and “read” or interpreted by proteins that translate the code into gene expression changes. Acetylation, phosphorylation, and methylation of histones are mediated by histone acetyltransferases, phosphotransferases, and methyl transferases and can be reversed by deacetylases, phosphatases, and demethylases. Histone lysine demethylases (KDMs)2 are classified into two families with distinct enzymatic mechanisms of action. KDM1 family members are FAD-dependent amine oxidases that demethylate mono- and dimethyl histone 3 lysine 4 (H3K4me1/2) via a hydride transfer from the N6-methyl group of the methylated lysine to the FAD cofactor, forming an unstable imine intermediate that is further hydrolyzed and liberates formaldehyde (1). The Jumonji C domain–containing KDMs are Fe(II)-dependent enzymes that catalyze the demethylation of mono-, di-, and trimethylated lysines using 2-oxoglutarate and oxygen as co-substrates converting the methyl group in the methyllysine to a hydroxymethyl group, which is then released as formaldehyde (2).
A recurrent challenge in the development of drugs targeting novel targets is to unequivocally establish whether the in vitro or in vivo efficacy of a compound effectively depends on the binding of the drug to its intended target, a process commonly called target engagement. KDMs are emerging clinical targets in several therapeutic areas, and modulation of their activity can lead to modification of the histone methylation status. Potent tools have been developed to assess the histone modification status, based on the immunological detection of modified amino acid residues in the histone tails. ChIP allows for the measurement of global changes in histone methylation (ChIP and methyl mark) (3), for analysis of selected genomic loci (ChIP-qPCR) (4), or for the genome-wide profiling of histone methyl marks by deep sequencing (ChIP-Seq) (3, 5, 6) and has provided massive information on chromatin changes induced by pharmacological treatment.
Several obstacles may impede the reliable demonstration of selective target engagement of an inhibitor by analysis of methyl marks. The histone modification status is a steady state of opposing fluxes catalyzed by enzymes with opposing activities. The ChIP technique depends strictly on the availability of a high-quality antibody, and the detection of a given histone mark can be compromised when additional modifications are present in the near vicinity. Each histone mark is representative of the equilibrium of all of the “forces” that mediate its modification, rendering basal levels and levels post-treatment with an inhibitor highly cell context–dependent. For example, H3K4 can be methylated by the SET/MLL proteins, and the methylation can be reversed by the KDM1 and KDM5 demethylases (7, 8). H3K4 methylation status is further conditioned by nearby modifications, including acetylation or asymmetric dimethylation at arginine 2 of histone 3, by phosphorylation at threonine 3 of histone 3, and di- and trimethylation at lysine 9 of histone 3 (H3K9me2/3) (8), mediated by additional epigenetic factors. At any given locus, the H3K4 methylation status further depends on specific modifying factors actually recruited to that specific site. Finally, the translation of ChIP-based assays from the research laboratory to the clinical setting may pose additional challenges in sample logistics.
Here, we present a novel method for direct measurement of the protein activity of the histone lysine demethylase 1 (KDM1A). The assay can be used in unmodified cells and tissues and, hence, in samples obtained from clinical trials. To develop the assay, we first designed and synthesized a biotinylated chemoprobe capable of selectively and irreversibly binding to the active form of KDM1A expressed at endogenous levels using native cell extracts. By coupling the chemoprobe to an immune-based assay, we can quantify the levels of free KDM1A relative to total levels of KDM1A and determine the degree of target engagement in a dose-dependent manner. Furthermore, we show that the assay can be used on tissue extracts to analyze the in vivo pharmacokinetics/pharmacodynamics (PK/PD) relationship of ORY-1001.
Results
Development of an ORY-1001–based biotinylated chemoprobe
To develop an assay to quantify KDM1A occupation, we used ORY-1001 (IC50 = 18 nm; Fig. 1A) (9) as a chemical starting point to design biotinylated probes that would bind the FAD co-factor of KDM1A in a similar way as ORY-1001 and have an IC50 maximum 10-fold higher than that of ORY-1001.
Figure 1.
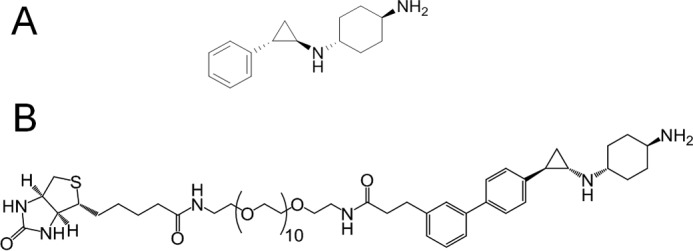
Design of a KDM1A chemoprobe. A, chemical structure of ORY-1001. B, chemical structure of OG-861.
Critical factors in the design of biotinylated KDM1A probes include the potency of the substructure that will react covalently with the FAD cofactor as well as the proper orientation and the length of the linker. We used a variety of spacers and PEG chains of different lengths to couple ORY-1001 (IC50 = 18 nm) to a biotin moiety via amide bonds and tested them in an inhibition assay using recombinant KDM1A protein. Potent KDM1A-inhibiting chemoprobes were obtained, exemplified by OG-857, OG-861, and OG-880 (Table 1). In these probes, the substitution in para of the aromatic ring of ORY-1001 with phenylpropanamide moiety allowed the probe to effectively bind the FAD cofactor in the proper orientation to emerge from the KDM1A pocket. Coupling of a biotinylated PEG chain of six or more units in these probes is sufficient to allow for proper spacing of the biotin from the KDM1A surface and binding to streptavidin. OG-861 was the most potent KDM1A inhibitor (IC50 = 130 nm; Fig. 1B) among the different chemoprobes tested. Compounds were initially prepared as trans-racemic mixtures for the cyclopropyl ring, but given our previous experience with stereoselectivity of KDM1A inhibitors, we also synthesized OG-881 (IC50 = 120 nm; for the synthesis procedure, see the supporting information), the (1R,2S) pure isomer of OG-861, for use in further experiments.
Table 1.
IC50 values of KDM1A chemoprobes
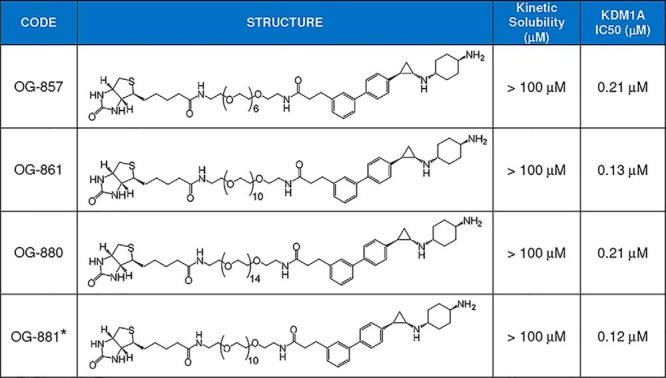
* All chemoprobes are trans-racemic mixtures regarding the cyclopropyl ring with the exception of OG-881 (single isomer 1R,2S).
Chemoprobe precipitation of KDM1A
To demonstrate that the chemoprobe can precipitate KDM1A, we incubated recombinant KDM1A or cell extracts obtained from THP-1 cells with the OG-861 chemoprobe, added streptavidin-coated paramagnetic beads, and found that KDM1A was pulled down efficiently from the suspension (not shown). This preliminary result illustrated that the probe efficiently binds to both recombinant and native KDM1A and also that its biotin group is readily accessible to the streptavidin on the surface of the paramagnetic beads. A titration analysis was then performed using OG-881 to determine the optimal probe concentration required to pull down the protein (Fig. 2A). Furthermore, we pretreated cells with increasing concentrations of ORY-1001 and found a dose-dependent signal reduction. Pretreatment with 25 nm ORY-1001 completely prevented pulldown of KDM1A with OG-861 (Fig. 2B), indicating that KDM1A inhibition was complete at this dose. The IC50 values estimated for ORY-1001 from this dose–response curve were similar to those obtained previously with the measurement of H3K4me2 accumulation by ChIP-qPCR (Fig. 2C) and with the quantification of CD11b differentiation marker by flow cytometry (Fig. 2E), indirect methods for the quantification of KDM1A inhibition in cells. H3K4me2 accumulation as assessed by AlphaLisa (Fig. 2D) yielded somewhat lower IC50 values.
Figure 2.

Characterization of selected chemoprobes and KDM1A antibodies as technical tools for development of KDM1A target occupation assay. A, effect of OG-881 probe concentration on pulldown of KDM1A from THP-1 cells (representative image of n = 2). Shown is Western blot analysis using anti-KDM1A antibody. M, molecular size marker. B, effect of ORY-1001 pretreatment (nanomolar) on the OG-861-mediated pulldown of KDM1A from THP-1 cells. Native cellular extracts were obtained in the presence of excess (5 μm) chemoprobe. Western blotting using KDM1A antibody (representative image of n = 2). C, ORY-1001 dose–response curves of H3K4me2 accumulation measured by ChIP-qPCR (n = 3, mean ± S.D. (error bars)). D, dose curve of H3K4me2 accumulation measured by AlphaLISA performed on extracts of THP-1 cells treated with ORY-1001 for 96 h (N = 3, n = 2, mean ± S.E. (error bars)). E, dose curve of CD11b induction measured by FACS performed on THP-1 cells treated with ORY-1001 (N = 3, n = 1, mean ± S.E. (error bars)). F, analysis of binding profile of KDM1A (500 nm) to surface-bound OG-861 by Biacore analysis, alone or in competition with 1000 nm ORY-1001. RU, resonance units. G, biochemical selectivity profile of OG-881 and ORY-1001 (18) for KDM1A over other FAD-dependent amine oxidases (N = 2, n = 2). H, selectivity of OG-881 for KDM1A versus SMOX in pulldown from protein extracts of MV(4;11) cells. Shown is Western blotting using KDM1A (top) or SMOX (bottom) antibody. Input, native MV(4;11) cell extract. Pulldown, OG-881–mediated pulldown product. I, representation of the streptavidin-bound, OG-881/KDM1A complex generated using PyMOL version 0.99. The N- and C-terminal zones are shown in yellow and green; streptavidin bound to the protruding biotinylated OG-881 probe is shown in magenta. J, immunoprecipitation of KDM1A from native protein extracts obtained from THP-1 cells after 96-h treatment with vehicle or 5 nm ORY-1001 using mAb-825 or -844, anti-KDM1A antibodies with target peptides located in the N- and C-terminal regions, respectively. N, biological replicates of independent experiments; n, technical replicates.
Chemoprobe binding and specificity
Formation of the trimeric complex between streptavidin, OG-861, and KDM1A was also demonstrated by surface plasmon resonance (SPR). OG-861 was presented on a streptavidin-coated SPR chip, and binding of recombinant KDM1A was assessed either alone or after preincubation of KDM1A with ORY-1001. Without preincubation, the trimeric complex is formed, and no dissociation of the complex is observed during the duration of the experiment. However, preincubation with ORY-1001 completely prevented binding of KDM1A to the OG-861-SA chip surface (Fig. 2F).
To assess the target selectivity of the probe, OG-881 was tested in biochemical assays to determine its in vitro inhibitory activity against monoamine oxidase A and B (MAO-A and MAO-B), interleukin 4–induced 1 (IL4I1), and the spermine oxidase (SMOX). These proteins are closely related FAD-dependent enzymes involved in the metabolism of neurotransmitters or polyamines and exhibit significant homology with KDM1A in their catalytic domains. OG-881 was highly selective for KDM1A over other structurally related FAD-containing amine oxidases and exhibited a selectivity profile similar to the parent compound ORY-1001 (Fig. 2G). Additionally, we used OG-881 to chemo-precipitate proteins from MV(4;11) cell extracts and performed Western blotting to verify whether the pulldown product contained SMOX protein, the only recombinant enzyme tested that was bound to some extent by ORY-1001 or OG-881 in vitro. As shown in Fig. 2H, KDM1A was quantitatively pulled down by chemoprecipitation, but SMOX was not detected, illustrating the selectivity of the probe for the native KDM1A enzyme in cell extracts.
Selection of antibodies to KDM1A
We then set out to identify anti-KDM1A antibodies that could recognize nonoverlapping epitopes that did not interfere with the streptavidin-coupled OG-881 probe and with the interaction between KDM1A and Co-REST. We performed preliminary modeling of candidate antibodies' epitope recognition sites on the KDM1A protein to evaluate the diversity and the likeliness of unwanted interactions. Selected antibodies were tested for their capacity to immunoprecipitate native KDM1A protein from fresh THP-1 cell extracts. Antibodies were identified that bind efficiently to the N-terminal (mAb-825) and C-terminal (mAb-844) part of KDM1A, two epitopes located in close proximity on the KDM1A three-dimensional structure (Fig. 2I). In addition, the binding affinities of antibodies mAb-825 and mAb-844 for KDM1A were not affected by treatment of THP-1 cells with 5 nm ORY-1001 (Fig. 2J). Thus, antibodies mAb-825 and mAb-844 were selected for the set-up of the chemoprobe-based immunoassay.
Development of chemoprobe immunosorbent assays to detect total and free KDM1A
In cells or tissues treated with the KDM1A inhibitor ORY-1001, a portion of the KDM1A enzyme pool may be unbound (free) and the remainder occupied by the compound, depending on compound concentration. When these cells or tissues are lysed in the presence of excess OG-881, the chemoprobe will rapidly bind to the FAD cofactor and tag the free KDM1A. It must be noted that the binding of the chemoprobe to FAD in KDM1A is mediated by the protein and requires the protein to be enzymatically active, and thus the assay should be performed with native cell extracts.
MV(4;11) cells were cultured in the presence of vehicle or 5 nm ORY-1001, a dose sufficient to achieve target inhibition as assessed by functional assays. Native proteins were extracted in the presence of OG-881 and used as described below.
To detect total KDM1A, a sandwich ELISA was developed using a surface-bound anti-KDM1A antibody as a capture antibody (referred to as mAb-844) followed by a second anti-KDM1A antibody (referred to as mAb-825) for detection. A horseradish peroxidase–conjugated secondary antibody to mAb-825 was employed to measure total KDM1A bound to the plate surface using tetramethylbenzidine (TMB) as a substrate (Fig. 3A). A calibration curve was established using a dilution series of full-length human recombinant KDM1A enzyme (total rKDM1A) and a dilution curve obtained using 0.1–6.25 μg of native protein extract from vehicle– or ORY-1001–treated MV(4;11) cells. Binding of the biotinylated chemoprobe OG-881 to rKDM1A did not affect the total rKDM1A ELISA signal in this experimental setting (data not shown). The rKDM1A and MV(4;11) curves were used to assess the linearity and the relative detection efficiency of recombinant KDM1A and native KDM1A from human cell extracts (Fig. 3C).
Figure 3.

Determination total and free KDM1A using chemoprobe ELISA. A, representation of the sandwich ELISA for determination of total KDM1A. B, representation of the sandwich ELISA for determination of free KDM1A. C, total rKDM1A calibration curve obtained using 0.125–2.5 ng of rKDM1A (filled circles) and dilution curve of 0.1 to 6.25 μg protein extract of MV(4;11) cells treated with vehicle (squares) or 5 nm ORY-1001 (triangles). Assays were performed using surface-bound anti-KDM1A capture antibody mAb-844 and anti-KDM1A detection antibody mAb-825. Secondary antibody to mAb-825 and TMB were used for determination of total KDM1A (representative assay, n = 3, mean ± S.D. (error bars)). D, free rKDM1A calibration curve obtained using 0.125–2.5 ng of rKDM1A (filled circles) and dilution curve of 0.1–6.25 μg of protein extract of MV(4;11) cells treated with vehicle (squares) or 5 nm ORY-1001 (triangles). Assays were performed using streptavidin plates to capture OG-881 probe-bound KDM1A and anti-KDM1A detection antibody mAb-825. Secondary antibody to mAb-825 and TMB were used for determination of free KDM1A (representative assay, n = 3, mean ± S.D. (error bars)). E, total (squares) and free (triangles) rKDM1A calibration curves obtained using 15–300 pg of rKDM1A. Total and free assays were performed as above, but using a luminescent substrate (a representative assay of N = 3, n = 3, mean ± S.D. (error bars)). F, detection parameters of colorimetric versus luminescent total rKDM1A ELISAs. N, biological replicates of independent experiments; n, technical replicates. LLOD, lower limit of detection; LLOQ, lower limit of quantification.
To detect free KDM1A, a chemoprobe-linked immunosorbent assay was used that employs streptavidin-coated plates to capture the OG-881 chemoprobe bound to KDM1A and uses mAb-825 as the detection antibody, as described before (Fig. 3B).
A calibration curve was established using a dilution series of OG-881 bound to full-length human recombinant KDM1A (free rKDM1A) as above. Dilution curves were obtained using 0.1–6.25 μg of native protein extract from vehicle- or ORY-1001–treated MV(4;11) cells. The rKDM1A curve and the curve for native free KDM1A from untreated human cell extracts were used to assess the linearity and relative efficiency of detection (Fig. 3D).
Total and free KDM1A curves exhibited linear behavior (r2 > 0.99). The results showed that 6.25 μg of native protein extract from MV(4;11) contained about 2.5 ng of KDM1A enzyme, an adequate amount of starting material to assess target engagement in the colorimetric assay. Furthermore, after 96 h of treatment of MV(4;11) cells with 5 nm ORY-1001, the free KDM1A fraction was reduced by ∼80% relative to the untreated cells.
The assays were also amenable to the use of chemiluminescent substrate (Fig. 3E), and the detection range was satisfactory using both options. As expected, superior sensitivity was found when the ELISAs were run using chemiluminescence (Fig. 3F).
AlphaLISA/AlphaPlex assays to detect total and free KDM1A
We also evaluated whether the assay could be amenable to the AlphaLISA technology. The luminescent oxygen-channeling assay or amplified luminescent proximity homogeneous assay (AlphaLISA and AlphaPlex) technology was developed to detect analytes in solution with greater dynamic range than ELISA-based methods and without the need for multiple washing steps. The AlphaLISA assay detects the proximity of 250-nm latex donor beads containing phthalocyanine that release singlet oxygen after irradiation at 680 nm to similar sized acceptor beads containing europium that emit a narrow peak of light at 615 nm after absorption of singlet oxygen. The AlphaPlex assay works similarly, but the acceptor beads contain terbium or samarium and emit light at 545 or 645 nm after absorption. Effective singlet oxygen transfer occurs when donor and acceptor beads are separated by a distance of less than 200 nm.
The anti-KDM1A antibodies mAb-825 and mAb-844 (see above) were selected with these criteria in mind, and they bind in close proximity to each other and to the protruding biotinylated probe on the surface of KDM1A. Binding of the chemoprobe did not affect the binding of the antibodies; nor did binding to the surface of mAb-844 interfere with binding of mAb-825 in the experimental settings used. Using these components, we envisaged an AlphaLISA assay to measure total KDM1A (Fig. 4A) and free KDM1A (Fig. 4B) as well as an AlphaPlex assay to simultaneously measure free and total KDM1A (Fig. 4C).
Figure 4.

Determination of total and free KDM1A using chemoprobe AlphaLISA technology. A, representation of the AlphaLISA designed to detect total KDM1A. B, representation of the chemoprobe AlphaLISA designed to detect free KDM1A. Donor and acceptor beads are interchangeable in the simplex assays. Acceptor beads of the same or of two different emission wavelength can be chosen for A and B. C, representation of the multiplex AlphaLISA designed to detect total and free KDM1A simultaneously. The donor beads are coupled to the KDM1A antibody shared by the total and free KDM1A assay, and the chemoprobe and the second KDM1A antibody are coupled to acceptor beads with two different emission wavelengths. D, detection of free rKDM1A by chemoprobe AlphaLISA. Assays were performed using streptavidin-coated AlphaLISA donor beads, mAb-844–conjugated AlphaLISA acceptor beads, and 100 nm biotinylated OG-881 chemoprobe. Rhombi, rKDM1A + 100 nm OG-881; circles, bead control; triangles, protein control. E, detection of total KDM1A by AlphaLISA. Assays were performed using mAb-825–conjugated AlphaLISA donor beads and mAb-844–conjugated AlphaLISA acceptor beads in the presence of 100 nm OG-881 chemoprobe. Rhombi, rKDM1A + 100 nm OG-881; circles, bead control; triangles, protein control. F, titration assay using increasing amounts of rKDM1A protein at a 100 nm concentration of OG-881. The signal is completely blocked by the addition of an excess (5 μm) of ORY-1001. Rhombi, rKDM1A + 100 nm OG-881; circles, rKDM1A + 100 nm OG-881 + 5 μm ORY-1001; triangles, protein control.
To illustrate the use of AlphaLISA to detect total and free KDM1A, a dilution series of total rKDM1A was prepared, incubated with 100 nm OG-881 probe, and mixed with anti-KDM1A mAb-825–conjugated AlphaLISA donor beads or streptavidin-coated AlphaLISA donor beads, respectively (total or free), and anti-KDM1A mAb-844–conjugated AlphaLISA acceptor beads (Fig. 4, D and E). The resulting curve is bell-shaped and characterized by a titratable signal decrease (hook effect) following a plateau obtained after an initial concentration-dependent signal increase, a pattern typically observed in AlphaLISA assays. The maximum signal/background ratio (>35-fold) was obtained with 100 nm rKDM1A (i.e. at equimolar concentrations of chemoprobe and enzyme). As expected, the free signal was blocked by pretreatment of the enzyme with ORY-1001 (5 μm) (Fig. 4F), illustrating the signal specificity.
Analysis of KDM1A target engagement in cells
Given the sensitivity of the luminescent chemoprobe immunosorbent assays and wide use of the corresponding equipment, we selected this methodology for further experiments and analyzed the KDM1A target engagement response in acute myeloid leukemia cells treated with ORY-1001. To establish a dose curve, MV(4;11) cells were treated with vehicle or increasing doses of ORY-1001. Cells were lysed, and native protein extracts were obtained in the presence of 25 nm OG-881 chemoprobe. Total protein extracts were quantified, and 1 μg of total protein was used to perform the target engagement analysis as described above, using the luminescent substrate. Total and free KDM1A relative light units (RLU) were determined, and the EC50 value for target engagement of ORY-1001 to KDM1A in MV(4;11) was calculated to be 0.35 nm (Fig. 5A). With the exception of the data obtained for H3K4me2 accumulation by AlphaLISA (0.02 nm), the EC50 value for target engagement was in the same range as the EC50 calculated by the other functional readouts, such as the expression of LY96 (EC50 = 0.09 nm) and cell viability (EC50 = 0.14 nm) of MV(4;11) cells cultured for 96 h with ORY-1001 (Fig. 5, B–D). Although there was a reasonably good correlation between the different readouts in the MV(4;11) cells, the indirect measurement methods cannot be readily used in all cell types and tissues. For example, the H3K4me2 AlphaLISA baseline signal may be too high, and the “hook effect” may be reached using very low protein quantities, compromising the H3K4me2 detection window (data not shown). The LY96 biomarker used above is not induced in all cell lines, limiting its general utility even in AML, and cell viability is hardly a useful readout to assess target engagement in tissues.
Figure 5.

Analysis of KDM1A target engagement and proxy markers. A, IC50 determination of KDM1A target engagement by ORY-1001 in MV(4;11) cells treated for 96 h with different doses of ORY-1001 (representative luminescent immunoassay of N = 3, n = 3, mean ± S.D.). B, EC50 determination of H3K4me2 accumulation induced in MV(4;11) cells by 96 h of treatment with ORY-1001 (AlphaLISA; N = 3, n = 2, mean ± S.E. (error bars)). C, EC50 determination of MV(4;11) viability (Alamar Blue assay; representative experiment of N = 5, n = 3, mean ± S.D. (error bars)). D, EC50 determination of LY96 gene expression changes induced in MV(4;11) cells by 96 h of treatment with ORY-1001 (qRT-PCR; N = 3, n = 3, mean ± S.E. (error bars)). Data are normalized to the GAPDH control, and -fold changes were calculated relative to the vehicle control sample.
We also evaluated KDM1A target engagement by other reversible and irreversible KDM1A inhibitors. OG-675 is a selective KDM1A inhibitor (IC50 KDM1A = 21 nm), pargyline (PGL) is a selective monoamine oxidase inhibitor (IC50 MAO-A = 3.99 μm; MAO-B = 0.18 μm), and tranylcypromine (TCP) is a nonselective monoamine oxidase inhibitor (IC50 MAO-A = 2.66 μm; MAO-B = 0.1 μm; KDM1A = 39.66 μm), described to inhibit KDM1A in vitro, in cells, and in vivo and to provoke accumulation of H3K4me2 (10, 11). ORY-1001, OG-675, PGL, and TCP act through covalent binding to the FAD cofactor of their cognate target enzymes. SP2509 has been described as a reversible KDM1A inhibitor (12).
PGL was described to inhibit KDM1A (13). Since then, the compound has been used in more than 20 scientific papers that assess KDM1A function. There is, however, some controversy; PGL does not induce accumulation of H3K4me2 on bulk histones, nucleosomes (10), or histone tail peptide substrates (14) even at a very high (5 mm) concentration. Metzger et al. (13) reported that global H3K9me2 but not H3K4me2 levels increase in LNCaP prostate cancer cells after knockdown of KDM1A using siRNA or 3 mm pargyline in combination with the AR agonist R1881. However, H3K9me2 peptides are not demethylated by KDM1A in vitro (1), which led the authors to propose that the association of the androgen receptor with KDM1A provokes a switch in enzyme substrate specificity. We tested the above-listed inhibitors in the in vitro rKDM1A inhibition assay (Fig. 6A) and subsequently used the newly developed method to analyze KDM1A target engagement in MV(4;11) after ORY-1001, OG-675, TCP, and SP-2509 treatment or in LNCaP prostate cancer cells after treatment with ORY-1001, PGL, and SP-2509 (Fig. 6B). Treatment with TCP phenocopies KDM1A knockdown in MLL translocated acute myeloid leukemia (AML) cells (6). Dose-proportional cellular target engagement was observed for ORY-1001, OG-675, and TCP, all in the range in which they induce differentiation in AML cells. However, we did not detect target occupation by PGL using a 3 mm concentration of the compound in LNCaP cells. SP2509 inhibited KDM1A in vitro, although its IC50 (12.6 μm) was higher than described previously (11). We detected residual KDM1A target engagement in LNCaP cells treated with 250 nm SP2509 (17%) but none in MV(4;11) cells treated with a 1 μm concentration of this compound. Higher doses were not applied as they were cytotoxic.
Figure 6.

Analysis of KDM1A target engagement and PK/PD of ORY-1001. A, IC50 determination of rKDM1A inhibition of different compounds. B, KDM1A target engagement in human AML (MV(4;11); filled symbols) and prostate cancer cell lines (LNCaP; open symbols) after treatment with KDM1A inhibitors. KDM1A TE was measured after a 24-h incubation with ORY-1001 (circles), OG-675 (rhombi), TCP (squares), SP-2509 (inverted triangles), or PGL (triangle). In LNCaP, SP-2509 was tested at 250 nm due to overt cytotoxicity, and the treatment at 3 mm PGL was limited to 4 h for the same reason. C, KDM1A plasma pharmacokinetics (N = 1, n = 3, mean ± S.D. (error bars)) and PBMC pharmacodynamics (pooled samples from three animals; N = 2, n = 3, mean ± S.E. (error bars)) in rats treated with 2.5 μg/kg ORY-1001. D, KDM1A plasma pharmacokinetics (N = 1, n = 3, mean ± S.D. (error bars)) and PBMC pharmacodynamics (pooled samples from three animals; N = 2, n = 3, mean ± S.E. (error bars)) in rats treated with 15 μg/kg ORY-1001. N, biological replicates of independent experiments; n, technical replicates.
Analysis of in vivo KDM1A target engagement and pharmacokinetics
Following single and repeated oral administration of ORY-1001 to rats, the plasma concentrations reached the maximum levels at 6 h with an elimination half-life of ∼17 h (Fig. 6, C and D). In an independent pharmacodynamic analysis, the target engagement in peripheral blood mononuclear cells (PBMCs) showed maximum occupancy 24 h after administration on day 1 and 6 h after repeated administration on day 5 (Fig. 6, C and D). Notably, nearly complete target engagement was achieved in PBMCs at a five-daily dose regimen tolerated in rats. As expected for an irreversible inhibitor, target inhibition persisted after plasma levels had returned to baseline and exhibited a pharmacodynamic half-life of ∼60 h. Taken together, these results demonstrate that the chemoprobe-based immunoassay can be used to quantify target engagement by ORY-1001 and other KDM1A inhibitors in ex vivo samples.
Discussion
The assessment of PK/PD relationships is key to the development of novel drugs. Here, we have described the development of a novel nonradioactive method to assess target engagement of the selective KDM1A inhibitor ORY-1001. KDM1A forms part of transcriptional regulation complex and demethylates H3K4me2/1 at genomic sites it is recruited to. The H3K4me2 mark has been associated with transcriptional modulation, and inhibition of KDM1A induces expression of genes regulated by KDM1A. We have previously assessed target engagement of ORY-1001 to KDM1A in AML cells by indirect measurements of induction of global and KDM1A-specific H3K4me2 levels, gene expression analysis, and flow cytometry analysis of cell surface proteins. Such readouts are highly relevant to monitor cellular responses, but they represent indirect measurements. The gene expression response to KDM1A inhibition varies considerably in function of the genetic make-up of the (tumor) cells and the tissue origin. Similarly, the effect on cell proliferation reflects the response of sensitive cells rather than target engagement. H3K4me2 levels are determined by a complex network of epigenetic modifiers and transcription factors, and baseline levels vary considerably in different cell types and tissues. H3K4me2 levels may be influenced by the activity of histone lysine demethylases or methylases, but also by the effect on other targets. Proper consideration is needed, therefore, before attributing cellular effects to the inhibition of a given target. Target engagement, histone modification, gene expression changes, and cellular effects due to treatment with an inhibitor would be expected to coincide. If target engagement is achieved at a much lower dose than any phenotypic cellular effect, or if cell viability effects are observed in the absence of any evidence for target engagement, it is unlikely that they can be attributed to the inhibition of the target. Whereas this is rather obvious, it must be taken into account that proper tools are not readily available when working on novel targets. In particular, in the field of epigenetics, most reports present only secondary readouts instead of a direct measurement of cellular target engagement.
The analysis of target occupation is the most direct approach to assess the pharmacodynamics of novel drugs directed toward a novel target. A recent paper (15) reports on an unsuccessful attempt to develop activity-based probes for detection of KDM1A activity. We have developed an indication and specimen source–agnostic method to measure KDM1A inhibition in cells and in ex vivo samples. In this method, a highly specific KDM1A chemoprobe is used to tag free KDM1A in a biological sample, and the target engagement is calculated. The approach presented here can be readily applied to measure KDM1A target occupation by ORY-1001 and other irreversible inhibitors like TCP but did not confirm target engagement of two other compounds reported to inhibit KDM1A: PGL and SP2509. PGL is a cell-penetrant compound and exhibits strong cellular activity on its cognate MAO targets. If PGL inhibits KDM1A in cells, this would be likely to happen through a similar mechanism by which it inhibits the MAO enzymes (i.e. by binding the FAD cofactor). The absence of any sign of target engagement of PGL to rKDM1A in vitro or KDM1A in cells, even at high concentrations, warrants the careful re-evaluation of the attribution of any effects provoked by PGL to KDM1A inhibition. SP2509 was reported to be a reversible KDM1A inhibitor, with pro-apoptotic effects in AML cell lines (16). However, we found no unequivocal proof of KDM1A target engagement (TE) by SP2509 in MV(4;11) or LNCap cells at the doses used, so its effects on viability may be off-target, as suggested previously (17).
The strategy described in this paper can be applied to other targets, and in particular, it can be used to advance the development of epigenetic inhibitors. Contrary to other methods described, it does not require any genetic manipulation of the sample material, and therefore it can be readily translated to animal and clinical samples.
The target engagement method can be run on standard ELISA platforms, a technology widely implemented in research laboratories and clinical analysis laboratories. We have used it here to assess dose- and time-dependent response in cells and tissues from model animals and are now using the method to assess target engagement and to study the pharmacodynamics of KDM1A inhibitors like ORY-1001 (iadademstat) and ORY-2001 (vafidemstat), a dual KDM1A/MAO-B inhibitor, in clinical trials (18).
OG-881 can be used to pull down KDM1A-interacting proteins from human AML cells, and we found that KDM1A interacts with the core complex proteins RCOR1,2,3 and HDAC1,2,3 and with the zinc finger transcription factors ZNF217, ZNF516, RREB1, and ZMYM2 (ZNF198) in MV(4;11) (9). Chemoproteomics has been applied previously in epigenetics to study the target selectivity of hydroxamic, aminobenzamide, and pimelic diphenylamide type HDAC inhibitors in vitro and in cells and to deconvolute the composition of the protein complexes these different inhibitors target (19–22). KDM1A forms part of different regulatory complexes that involve HDAC enzymes, and the OG-881 chemoprobe is a tool that can be used to perform orthogonal studies of these complexes.
We have used the OG-881 chemoprobe to analyze KDM1A from humans, mice, and rats. However, KDM1A homologues have been identified across eukaryotic species (23) and target the lysine methyl marks in the tail of one of the most conserved proteins in the proteome: histone H3. This imposes an architectural constraint on the catalytic site of KDM1A orthologues that may permit use of the chemoprobe in more distant species.
KDM1A chemoprobes thus not only provide a versatile tool for pharmacodynamic and mechanism of action studies in biomedicine; they also offer the opportunity to perform broader chemoproteomic interactome studies in different species and fields of interest.
Experimental procedures
Compounds
ORY-1001 (also known as iadademstat, RG6016, or RO7051790), OG-675 (example 5 (24)), and chemoprobes (25) were obtained by custom synthesis; TCP was obtained from Aldrich (catalog no. P8511); PGL was from Aldrich (catalog no. M74253); and SP2509 was from Xcessbio (catalog no. M60160-2s) or produced by custom synthesis. Aqueous solubility of the chemoprobes was measured by turbidimetry in 50 mm phosphate buffer, pH 7.4.
Synthesis and characterization of chemoprobes
Biochemical assays (KDM1A, KDM1B, MAO-B, MAO-A, IL4I1, and SMOX)
Surface plasmon resonance
Surface plasmon resonance experiments were measured on a Biacore3000 instrument in HPS-P+ buffer (GE Healthcare). OG-861 was immobilized via streptavidin at densities of 16 and 60 RU on a CAP-chip (GE Healthcare) according to the manufacturer's instruction. KDM1A (0.5 μm) with or without 30-min preincubation with 1 μm ORY-1001 was injected for 3–30 min at flow rates between 1 and 5 μl/min. Despite these efforts, saturation could not be reached during the experiment, and only qualitative comparison of the sensograms is justified.
Cell culture and viability assay
THP1 (catalog no. ACC16) and MV4-11 cells (catalog no. ACC102) were obtained from DMSZ, whereas LNCaP cells (catalog no. CRL-1740) were from ATCC. All of the cell lines were cultured following provider recommendations. The absence of mycoplasma contamination was routinely confirmed with the MycoAlert mycoplasma detection kit (Lonza, reference no. H3LT07-418). Cells were treated with vehicle, ORY-1001 (10, 1, and 0.1 nm), OG-675 (10, 1, and 0.1 nm), TCP (100, 10, and 1 μm and 10 nm), PGL (3 mm), or SP2509 (1000 and 250 nm), as indicated. After 96 h, viability assays were performed by Alamar Blue staining (Life Technologies), following the manufacturer's instructions. Data represent means of biological triplicates.
Isolation of PBMCs from peripheral blood by density gradient centrifugation
Polymorphic blood mononuclear cells were isolated from peripheral fresh blood collected in K2-EDTA tubes diluted with an equal volume of PBS, using Ficoll–Paque PLUS reagent (GE Healthcare, catalog no. 17-1440-02) or Leucosep Tubes (Greiner Bio-One, catalog no. 227288) according to the manufacturer's instructions. Cells were stained with trypan blue, and cell number and viability were determined using a Neubauer chamber in an optical microscope. Pellets of 1·106 PBMCs were preserved at −80 °C.
Cell lysis for ChIP, IP, or chemoprobe pulldown
Cells were lysed in 1× cell lysis buffer (Cell Signaling, catalog no. 9803) containing 1× Complete Mini, protease inhibitor mixture tablets (Roche Applied Science, catalog no. 11836153001), and biotinylated probe (25 nm for ELISA or 5 μm for chemoprobe pulldown) was added to frozen cell pellets containing 1·106 cells. Tubes were incubated for 5 min on ice and briefly sonicated to achieve lysis. The resulting extracts were centrifuged for 10 min at 14,000 × g at 4 °C. Supernatants were collected and quantified by a Bradford assay (Bio-Rad, catalog no. 500-0006) following the manufacturer's instructions.
To obtain native protein from tissue, frozen samples were homogenized with a mortar and pestle chilled on dry ice. Powdered samples were resuspended in lysis buffer and forced through an 18-gauge blunt syringe needle to lyse the cells. Native proteins were then extracted as described above for cell pellets.
ChIP-qPCR
Chromatin immunoprecipitation assays were performed using the SimpleChIP Enzymatic Chromatin IP kit (Cell Signaling, catalog no. 9003), according the supplier's indications. Briefly, THP-1 cells treated with 20 nm ORY-1001 for 96 h were fixed with 1% formaldehyde (v/v) for 10 min at room temperature. Fixation was stopped by the addition of glycine. Cells were lysed, and chromatin was digested with the micrococcal nuclease from S. aureus (Roche Applied Science) for 20 min at 37 °C and sonicated with bath sonicator (CD-4820 COBOS) 5 × 30 s ON/OFF at high power to produce chromatin fragments of 150–300 bp. Lysates were then subjected to immunoprecipitation using an antibody specific to H3K4me2 (Cell Signaling, catalog no. 9726). After immunoprecipitation, the protein-DNA cross-links were reversed, and DNA was purified. Pulled down sequences were analyzed by qPCR using specific primers for the CD11b/ITGAM gene as a target sequence and β-actin as a negative control. All PCRs were run as technical replicates. Grubbs outlier elimination criteria were applied on raw Cp values when the S.D. for the triplicate of Cp values was >0.25. The sequences of primers used are 5′-TTCGGTCACCCTAACTAA-3′ (CD11b/F), 5′ -TTCGGTCACCCTAACTAA-3′ (CD11b/R), 5′-CTGACTGACTACCTCATG-3′ (β-actin/F), and 5′-CACAGCTTCTCCTTAATG-3′ (β-actin/R).
Immunoprecipitation
Anti-KDM1A antibody (Cell Signaling, catalog no. 2184) diluted 1:25 in PBS, was added to native protein extraction or rKDM1A (Active Motif, catalog no. 31334) and incubated overnight at 4 °C with gentle rocking. 50 μl of protein A magnetic beads (Cell Signaling, catalog no. 8687) were washed, adding 500 μl of 1× cell lysis buffer (Cell Signaling, catalog no. 9803), and supernatant was removed using a magnet. Lysate or rKDM1A preincubated with primary antibody (immunocomplex) was then added to magnetic bead pellet. Cross-link reaction was performed with gentle rocking for 30 min at room temperature (RT). Protein A magnetic beads not bound to immunocomplex were removed by washing three times. The resulting pellet was resuspended in 25 μl of 3× SDS sample buffer and stored at −20 °C.
Chemoprobe pulldown
250 μl of Dynabeads M-280 Streptavidin (Thermo Fisher Scientific, catalog no. 11205D) were washed three times and resuspended in 250 μl of PBS. 350 μg of native protein extract (containing the biotinylated probe) was then added and incubated for 30 min at RT using gentle rotation. The chemoprobe–KDM1A complex bound to the streptavidin beads was separated using a magnet and washed four times in PBS. After the last wash, samples were resuspended in 25 μl of 3× SDS sample buffer and conserved at −20 °C for analysis. Lysates of cells treated with the reversible inhibitor SP2509 were incubated for 30 min with the chemoprobe, and then the chemoprobe-binding reaction was terminated by the addition of an excess of fast binding ORY-1001.
Western blotting
Samples were separated on a 10% BisTris NuPAGETM NovexTM precast gel (Invitrogen, catalog no. P0301BOX), following the manufacturer's instructions. Gels were transferred onto nitrocellulose membrane (GE Healthcare, catalog no. RPN303D) for immunodetection by semi-dry transfer. N-specific binding sites were blocked by incubating membranes in blocking buffer (5% nonfat dry milk in PBS-Tween, 0.1%) at RT for 1 h. Nitrocellulose membrane was then incubated in blocking buffer with an anti-KDM1A antibody (Cell Signaling, catalog no. 2184) diluted 1:1000 or anti-SMOX antibody (Proteintec Europe; catalog no. 15052-1-AP) diluted 1:200 overnight at 4 °C. After five washes in PBS-Tween 0.5%, the membrane was incubated with a peroxidase-conjugated secondary antibody (Jackson Immunoresearch, catalog no. 711-035-152) diluted 1:5000 for 1 h at RT. Signal was detected by enhanced chemiluminescence (ECL, Amersham Biosciences, GE Healthcare, catalog no. W9643350) using a GeneGnome HR System (Syngene).
Flow cytometry differentiation assay
Differentiation of THP-1 cells was determined on the basis of CD11b surface expression after 96 h of treatment in standard RPMI medium. After treatment, THP-1 cells were collected, washed twice in PBS, and resuspended in 100 μl of PBS, 1% fetal bovine serum containing 20 μl of anti-CD-11b/Mac-1-PE antibody (BD Biosciences, catalog no. 555388). Staining was performed for 45 min at 4 °C. After three PBS washes, cells were resuspended in a total volume of 600 μl prior to analysis using a CyAn flow cytometer (Beckman Coulter). Data analysis was performed using FlowJo version 7.5.5.
qRT-PCR
Total RNA was extracted using the RNeasy minikit (Qiagen, catalog no. 74106) and cDNA obtained according to standard procedures, using High Capacity RNA-to-cDNA Master Mix (Thermo Fisher Scientific, catalog no. 4390779). qRT-PCR was performed with LightCycler 480 Probes Master (Roche Applied Science, catalog no. 04887301001) and the following predesigned and preoptimized TaqMan Gene Expression Assays from Thermo Fisher Scientific: catalog no. Hs01026734_m1 (FAM dye) for LY96 gene and catalog no. Hs02758991_g1 (FAM dye) for GAPDH gene. qRT-PCR was performed in technical triplicates using the Lightcycler 480 Instrument II (Roche Applied Science). Grubbs outlier elimination criteria were applied on raw Cp values when the S.D. for the triplicate of Cp values was greater than 0.25. Relative measurement of the amplified product was performed using the comparative threshold cycles method by normalizing to endogenous GAPDH control and then calculating the -fold induction over the expression levels of a vehicle-treated control sample.
AlphaLisa H3K4me2 histone demethylation assay
The AlphaLISA H3K4me2 cellular detection kit (Perkin Elmer Life Sciences, catalog no. AL716C) was used to measure H3K4me2 in cell lysates. Histone 3–coupled donor beads were irradiated at 680 nm to produce short-lived singlet oxygen molecules that are transferred to H3K4me2-targeted acceptor beads in proximity, to generate an amplified signal measured at 615 nm using an En Vision PerkinElmer Life Sciences instrument). H3K4me2 modulation was analyzed in THP1 and MV(4;11) cells treated for 96 h with ORY-1001 in medium containing 0.01% DMSO using 3,000 and 15,000 cells, respectively.
ELISA for free and total KDM1A
Luminescent ELISA
For quantification of the total amount of KDM1A protein (total KDM1A), LumiNunc Maxisorp plates (NUNC, catalog no. 436110) were coated with a monoclonal anti-KDM1A antibody (Abcam, catalog no. ab53269, referred to as mAb-844) at 2 μg/ml in PBS. For quantification of the fraction not bound to inhibitor (FREE KDM1A), plates were coated with streptavidin (Promega Biotech Ibérica, catalog no. Z7041) at 10 μg/ml in PBS. Coating was performed at 4 °C overnight. Wells were washed three times in PBS, 0.1% Tween 20 and blocked with PBS-BSA 1% (Sigma, catalog no. A3059) for 2 h. A KDM1A calibration curve of full-length rKDM1A (Active Motif, catalog no. 31334) diluted in PBS was included in each plate. Plates were then incubated for 1 h at RT and washed five times. Afterward, monoclonal anti-KDM1A antibody (Cell Signaling, catalog no. 2184, referred to as mAb-825) was diluted at 0.125 μg/ml in PBS, and plates were incubated 1 h at RT. After six washes, a peroxidase-conjugated secondary antibody (Jackson Immunoresearch, catalog no. 711-035-152) diluted 1:5000 was added to plates and incubated for 1 h at RT, and plates were washed again. 100 μl/well chemiluminescent substrate (Invitrogen, catalog no. 37074) was added. Plates were centrifuged for 30 s at 1,500 × g, shaken for 1 min at 100 rpm, and incubated inside the microplate reader (Infinite 200, Tecan) for 3 min at 25 °C. The RLU readouts were acquired using a 1,000-ms integration time and 150-ms settle time.
Colorimetric ELISA
Maxisorp plates (NUNC, catalog no. 735-0013) were processed as described above for the luminescent ELISA, but the TMB Liquid Substrate system (Sigma-Aldrich, catalog no. T0440) was used as a substrate. 100 μl of TMB was added per well, and plates were incubated for 10 min before stopping the reaction by the addition of 100 μl/well of phosphoric acid solution 2N. Absorbance was read at 450 nm using a microplate reader (Infinite 200, Tecan).
AlphaLISA for free and total KDM1A
For AlphaLISA technology, we used the streptavidin-coated AlphaLISA donor beads (PerkinElmer Life Sciences, catalog no. 6760002), anti-KDM1A (mAb-844)–conjugated AlphaLISA acceptor beads (PerkinElmer Life Sciences, catalog no. 6772001), and anti-KDM1A (mAb-825)–conjugated AlphaLISA donor beads (PerkinElmer Life Sciences, catalog no. 6762013). AlphaLISA assay and conjugation of antibodies to the donor and acceptor beads was performed according to the vendor's instructions.
Calculation of target engagement
The TE or percentage of KDM1A bound by ORY-1001 was calculated using a relative quantification method in which the target engagement in a given sample X was calculated relative to a reference sample REF (pretreatment or vehicle). All assays were run as triplicate technical replicates. After raw data processing (robust elimination of outliers according to Grubbs criteria and subtraction of blank signal), the target engagement was calculated as TEx (%) = 100 − ((Rx (%)/RREF (%)) × 100), where R (%) = (RLUfree/RLUtotal) × 100.
Animal studies
For PK/PD studies of ORY-1001 following oral administration in rats, ORY-1001 was administered by oral gavage to male Sprague–Dawley rats (10–11 weeks of age) for 1 day or 5 consecutive days. Food and water were available ad libitum. Animals were housed at constant room temperature (20–24 °C) and relative humidity (45–65%) under a light/dark cycle (lights on at 6:00 a.m.) in a cytostatic security room at a maximum of 3 rats/cage. Animals were weighed before each administration to adjust the required volume. To assess the dynamics of target engagement in vivo, vehicle or ORY-1001 was administered orally to rats either 1 day or during 5 consecutive days at a dose of 2.5 and 15 μg/kg/day. PBMCs were obtained pre-dose and 2, 6, and 24 h after the single-dose administration or pre-dose and 2, 6, 24, 48, and 72 h after the last dose in the multiple-dose administration. Total and free KDM1A protein levels in PBMCs were assessed using 0.5 μg of total native protein, and target engagement was calculated relative to the pre-dose condition as described above. No randomization or blinding was applied. All protocols were approved by the Institutional Ethical Committee of India or Europe and were carried out in accordance with European Directive 86/609/EEC.
Author contributions
T. M. conceptualization, supervision, writing-original draft; C. M. project administration; T. M., C. M., A. O., and E. C methodology; C. M., A. O., E. C., F. C., S. L., L. Y., and M. H. validation; R. R. R. investigation; C. M., F. C., S. L., L. Y., and M. H. formal analysis; C. M., A. O., E. C., R. R. R., F. C., and S. L. visualization; C. M., A. O., E. C., R. R. R., F. C., S. L., L. Y., and M. H. writing-review and editing.
Supplementary Material
Acknowledgment
We are grateful to Paolo Mariottini (University of Rome) for providing recombinant SMOX (26).
T. M. is executive director and shareholder of Oryzon Genomics S.A. T. M., C. M., A. O., E. C., R. R. R., F. C., and S. L. are employees at Oryzon Genomics S.A. L. Y. and M. H. are employees at Hoffmann-La Roche.
This article was selected as one of our Editors' Picks.
This article contains supplemental information.
- KDM
- histone lysine demethylase
- qPCR and qRT-PCR
- quantitative PCR and RT-PCR, respectively
- PK/PD
- pharmacokinetics/pharmacodynamics
- MAO
- monoamine oxidase
- IL4I1
- interleukin 4–induced 1
- SMOX
- spermine oxidase
- TMB
- tetramethylbenzidine
- RLU
- relative light unit(s)
- PGL
- pargyline
- TCP
- tranylcypromine
- AML
- acute myeloid leukemia
- PBMC
- peripheral blood mononuclear cell
- RT
- room temperature
- H3K4
- histone H3 Lys-4
- H3K9
- histone H3 Lys-9
- me2 and me3
- di- and trimethylation, respectively
- BisTris
- 2-[bis(2-hydroxyethyl)amino]-2-(hydroxymethyl)propane-1,3-diol
- GAPDH
- glyceraldehyde-3-phosphate dehydrogenase
- TE
- target engagement
- SPR
- surface plasmon resonance.
References
- 1. Shi Y., Lan F., Matson C., Mulligan P., Whetstine J. R., Cole P. A., Casero R. A., and Shi Y. (2004) Histone demethylation mediated by the nuclear amine oxidase homolog LSD1. Cell 119, 941–953 10.1016/j.cell.2004.12.012 [DOI] [PubMed] [Google Scholar]
- 2. Tsukada Y., Fang J., Erdjument-Bromage H., Warren M. E., Borchers C. H., Tempst P., and Zhang Y. (2006) Histone demethylation by a family of JmjC domain-containing proteins. Nature 439, 811–816 10.1038/nature04433 [DOI] [PubMed] [Google Scholar]
- 3. Schenk T., Chen W. C., Göllner S., Howell L., Jin L., Hebestreit K., Klein H. U., Popescu A. C., Burnett A., Mills K., Casero R. A. Jr., Marton L., Woster P., Minden M. D., Dugas M., Wang J. C., Dick J. E., Müller-Tidow C., Petrie K., and Zelent A. (2012) Inhibition of the LSD1 (KDM1A) demethylase reactivates the all-trans-retinoic acid differentiation pathway in acute myeloid leukemia. Nat. Med. 18, 605–611 10.1038/nm.2661 [DOI] [PMC free article] [PubMed] [Google Scholar]
- 4. Briggs S. D., Bryk M., Strahl B. D., Cheung W. L., Davie J. K., Dent S. Y., Winston F., and Allis C. D. (2001) Histone H3 lysine 4 methylation is mediated by Set1 and required for cell growth and rDNA silencing in Saccharomyces cerevisiae. Genes Dev. 15, 3286–3295 10.1101/gad.940201 [DOI] [PMC free article] [PubMed] [Google Scholar]
- 5. Barski A., Cuddapah S., Cui K., Roh T. Y., Schones D. E., Wang Z., Wei G., Chepelev I., and Zhao K. (2007) High-resolution profiling of histone methylations in the human genome. Cell 129, 823–837 10.1016/j.cell.2007.05.009 [DOI] [PubMed] [Google Scholar]
- 6. Harris W. J., Huang X., Lynch J. T., Spencer G. J., Hitchin J. R., Li Y., Ciceri F., Blaser J. G., Greystoke B. F., Jordan A. M., Miller C. J., Ogilvie D. J., and Somervaille T. C. (2012) The histone demethylase KDM1A sustains the oncogenic potential of MLL-AF9 leukemia stem cells. Cancer Cell 21, 473–487 10.1016/j.ccr.2012.03.014 [DOI] [PubMed] [Google Scholar]
- 7. Rasmussen P. B., and Staller P. (2014) The KDM5 family of histone demethylases as targets in oncology drug discovery. Epigenomics 6, 277–286 10.2217/epi.14.14 [DOI] [PubMed] [Google Scholar]
- 8. Forneris F., Binda C., Vanoni M. A., Battaglioli E., and Mattevi A. (2005) Human histone demethylase LSD1 reads the histone code. J. Biol. Chem. 280, 41360–41365 10.1074/jbc.M509549200 [DOI] [PubMed] [Google Scholar]
- 9. Maes T., Mascaró C., Tirapu I., Estiarte A., Ciceri F., Lunardi S., Guibourt N., Perdones A., Lufino M. M. P., Somervaille T. C. P., Wiseman D. H., Duy C., Melnick A., Willekens C., Ortega A., et al. (2018) ORY-1001, a Potent and Selective Covalent KDM1A Inhibitor, for the Treatment of Acute Leukemia. Cancer Cell 33, 495–511.e12 10.1016/j.ccell.2018.02.002 [DOI] [PubMed] [Google Scholar]
- 10. Lee M. G., Wynder C., Schmidt D. M., McCafferty D. G., and Shiekhattar R. (2006) Histone H3 lysine 4 demethylation is a target of nonselective antidepressive medications. Chem. Biol. 13, 563–567 10.1016/j.chembiol.2006.05.004 [DOI] [PubMed] [Google Scholar]
- 11. Yang M., Culhane J. C., Szewczuk L. M., Jalili P., Ball H. L., Machius M., Cole P. A., and Yu H. (2007) Structural basis for the inhibition of the LSD1 histone demethylase by the antidepressant trans-2-phenylcyclopropylamine. Biochemistry 46, 8058–8065 10.1021/bi700664y [DOI] [PubMed] [Google Scholar]
- 12. Sorna V., Theisen E. R., Stephens B., Warner S. L., Bearss D. J., Vankayalapati H., and Sharma S. (2013) High-throughput virtual screening identifies novel N′-(1-phenylethylidene)-benzohydrazides as potent, specific, and reversible LSD1 inhibitors. J. Med. Chem. 56, 9496–9508 10.1021/jm400870h [DOI] [PubMed] [Google Scholar]
- 13. Metzger E., Wissmann M., Yin N., Müller J. M., Schneider R., Peters A. H., Günther T., Buettner R., and Schüle R. (2005) LSD1 demethylates repressive histone marks to promote androgen-receptor-dependent transcription. Nature 437, 436–439 10.1038/nature04020 [DOI] [PubMed] [Google Scholar]
- 14. Pollock J. A., Larrea M. D., Jasper J. S., McDonnell D. P., and McCafferty D. G. (2012) Lysine-specific histone demethylase 1 inhibitors control breast cancer proliferation in ERα-dependent and -independent manners. ACS Chem. Biol. 7, 1221–1231 10.1021/cb300108c [DOI] [PMC free article] [PubMed] [Google Scholar]
- 15. Ourailidou M. E., Lenoci A., Zwergel C., Rotili D., Mai A., and Dekker F. J. (2017) Towards the development of activity-based probes for detection of lysine-specific demethylase-1 activity. Bioorg. Med. Chem. 25, 847–856 10.1016/j.bmc.2016.11.043 [DOI] [PMC free article] [PubMed] [Google Scholar]
- 16. Fiskus W., Sharma S., Shah B., Portier B. P., Devaraj S. G., Liu K., Iyer S. P., Bearss D., and Bhalla K. N. (2014) Highly effective combination of LSD1 (KDM1A) antagonist and pan-histone deacetylase inhibitor against human AML cells. Leukemia 28, 2155–2164 10.1038/leu.2014.119 [DOI] [PMC free article] [PubMed] [Google Scholar]
- 17. Hitchin J. R., Blagg J., Burke R., Burns S., Cockerill M. J., Fairweather E. E., Hutton C., Jordan A. M., McAndrew C., Mirza A., Mould D., Thomson G. J., Waddell I., and Ogilvie D. J. (2013) Development and evaluation of selective, reversible LSD1 inhibitors derived from fragments. MedChemComm 4, 1513–1522 10.1039/c3md00226h [DOI] [Google Scholar]
- 18. Maes T., Molinero C., Antonijoan R. M., Ferrero-Cafiero J. M., Martínez-Colomer J., Mascaró C., and Arevalo M. I. (2017) First-in-human phase I results show safety, tolerability and brain penetrance Of ORY-2001, an epigenetic drug targeting LSD1 and MAO-B. Alzheimers Dement. 13, P1573–P1574 10.1016/j.jalz.2017.07.739 [DOI] [Google Scholar]
- 19. Salisbury C. M., and Cravatt B. F. (2007) Activity-based probes for proteomic profiling of histone deacetylase complexes. Proc. Natl. Acad. Sci. U.S.A. 104, 1171–1176 10.1073/pnas.0608659104 [DOI] [PMC free article] [PubMed] [Google Scholar]
- 20. Xu C., Soragni E., Chou C. J., Herman D., Plasterer H. L., Rusche J. R., and Gottesfeld J. M. (2009) Chemical probes identify a role for histone deacetylase 3 in Friedreich's ataxia gene silencing. Chem. Biol. 16, 980–989 10.1016/j.chembiol.2009.07.010 [DOI] [PMC free article] [PubMed] [Google Scholar]
- 21. Bantscheff M., Hopf C., Savitski M. M., Dittmann A., Grandi P., Michon A. M., Schlegl J., Abraham Y., Becher I., Bergamini G., Boesche M., Delling M., Dümpelfeld B., Eberhard D., Huthmacher C., et al. (2011) Chemoproteomics profiling of HDAC inhibitors reveals selective targeting of HDAC complexes. Nat. Biotechnol. 29, 255–265 10.1038/nbt.1759 [DOI] [PubMed] [Google Scholar]
- 22. Becher I., Dittmann A., Savitski M. M., Hopf C., Drewes G., and Bantscheff M. (2014) Chemoproteomics reveals time-dependent binding of histone deacetylase inhibitors to endogenous repressor complexes. ACS Chem. Biol. 9, 1736–1746 10.1021/cb500235n [DOI] [PubMed] [Google Scholar]
- 23. Zhou X., and Ma H. (2008) Evolutionary history of histone demethylase families: distinct evolutionary patterns suggest functional divergence. BMC Evol. Biol. 8, 294 10.1186/1471-2148-8-294 [DOI] [PMC free article] [PubMed] [Google Scholar]
- 24. Oryzon Genomics (April 25, 2013) (Hetero)aryl cyclopropylamine compounds as LSD1 inhibitors. International Patent WO2013057320
- 25. Oryzon Genomics (September 21, 2017) Methods to determine kdm1a target engagement and chemoprobes useful therefor. International Patent WO2017158136
- 26. Cervelli M., Polticelli F., Federico R., and Mariottini P. (2003) Heterologous expression and characterization of mouse spermine oxidase. J. Biol. Chem. 278, 5271–5276 10.1074/jbc.M207888200 [DOI] [PubMed] [Google Scholar]
Associated Data
This section collects any data citations, data availability statements, or supplementary materials included in this article.