

ABSTRACT
SLC7A11 (or xCT) imports extracellular cystine into cells to promote glutathione synthesis, thus inhibiting ferroptosis. SLC7A11 expression is tightly controlled in normal cells and its dysregulation results in aberrant expression of SLC7A11 in human cancers. We recently discovered that tumor suppressor BAP1, a H2A deubiquitinase, represses SLC7A11 expression by reducing H2A ubiquitination (H2Aub) on the SLC7A11 promoter. BAP1 inactivation in cancer cells leads to SLC7A11 de-repression, ferroptosis resistance, and tumor development. Here we show that BAP1 promotes ferroptosis induced by class I ferroptosis inducer (FIN) erastin but not by class II FIN RSL3, further supporting that BAP1 regulates ferroptosis through SLC7A11. In addition, we studied how BAP1 coordinates with other transcription factors to regulate SLC7A11 expression and show that BAP1-mediated SLC7A11 repression does not require NRF2 and ATF4 transcription factors. Finally, we show that, while BAP1 decreases whereas PRC1 (a major H2Aub ubiquitin ligase) increases H2Aub binding on the SLC7A11 promoter, both BAP1 and PRC1 represses SLC7A11 expression, suggesting that a dynamic regulation of H2Aub is important for SLC7A11 repression. Together, our data provide additional insights on epigenetic regulation of SLC7A11 expression in cancer cells.
KEYWORDS: BAP1, PRC1, SLC7A11, H2A ubiquitination, ferroptosis
Introduction
BRCA1-associated protein 1 (BAP1) is a tumor suppressor that is frequently deleted or mutated in various sporadic cancers, including clear cell renal cell carcinoma, uveal melanoma, cholangiocarcinoma, and mesothelioma [1]. In addition, BAP1 mutations have been implicated in a hereditary tumor predisposition syndrome termed BAP1 cancer syndrome, which is characterized by a high incidence of benign melanocytic skin lesions and malignant tumors including renal cell carcinoma, mesothelioma, and uveal melanoma [2,3]. BAP1 encodes a nuclear deubiquitinase (DUB) that primarily functions to remove mono-ubiquitin from Lys-119 of histone 2A (hereafter referred to as H2Aub), whereas the polycomb repressive complex 1 (PRC1) is the best-known ubiquitin ligase that mono-ubiquitinates H2A at Lys-119. Genome wide analyses showed that H2Aub generally is associated with transcriptional repression, and it has been suggested that this histone modification affects gene transcription via epigenetic mechanisms [4–6]. The opposing functions of BAP1 and PRC1 in regulating H2Aub indicate that they should exert opposite effects on gene transcription. Curiously, inactivation of BAP1 or PRC1 in Drosophila resulted in similar rather than opposite phenotypes, including de-repression of HOX genes and polycomb phenotypes [7]. Although the underlying mechanisms are not entirely clear, one model proposes that H2Aub-mediated transcriptional repression of at least some targets requires a coordinated balance between PRC1-mediated H2A ubiquitination and BAP1-mediated H2Aub de-ubiquitination [7,8]. How BAP1 and PRC1 coordinate to regulate gene expression in mammalian system remains elusive.
Solute carrier family 7 member 11 (SLC7A11, also known as xCT) is an amino acid transporter that imports extracellular cystine [9,10]. Intracellular cystine is subsequently reduced to cysteine, which then contributes to glutathione biosynthesis and reactive oxygen species (ROS) detoxification. SLC7A11 expression is induced upon various stress conditions, such as oxidative stress, and its transcription is tightly controlled by several transcription factors such as NRF2, ATF4, and p53 [11–14]. Studies in recent years have linked SLC7A11 to a new form of regulated cell death called ferroptosis, which is distinctive from apoptosis or other forms of cell death [15,16]. This form of cell death is induced upon over-accumulation of lipid ROS, such as lipid hydroperoxide, in cells in an iron-dependent manner [15,16]. Normal cells prevent over-accumulation of lipid hydroperoxide through GPX4-mediated conversion of lipid hydroperoxide to lipid alcohol, and this reaction requires glutathione [15,17]. Therefore, SLC7A11-mediated cystine import, glutathione biosynthesis, and subsequent GPX4-mediated detoxification of lipid peroxidation together protect cell from accumulating lethal levels of lipid hydroperoxide and from undergoing ferroptotic cell death. Consistent with this model, previous studies have identified at least two classes of ferroptosis inducers (FINs): class I FIN such as erastin induces ferroptosis through inhibiting SLC7A11, whereas class II FIN such as RSL3 promotes ferroptosis through directly inhibiting GPX4 [16,17]. The characterization of these different FINs has significantly advanced our understanding of ferroptosis.
Seeking to understand BAP1-mediated tumor suppression, we recently identified SLC7A11 as a key BAP1 target to mediate BAP1’s function in tumor suppression through genome wide analyses [18]. We showed that BAP1 reduces H2Aub occupancy on the SLC7A11 promoter and gene body, represses SLC7A11 expression and SLC7A11-mediated cystine import, and sensitizes cancer cells to erastin- or cystine depletion-induced ferroptosis. However, several questions still remain unclear: Does BAP1 also regulate ferroptosis induced by other FINs such as RSL3? Are other transcription factors involved in BAP1 regulation of SLC7A11 transcription? Does PRC1 also play a role in regulating H2Aub occupancy on the SLC7A11 gene and SLC7A11 expression? This study is set out to address these questions.
Materials and methods
Cell culture studies
Cell lines used in this study were obtained from ATCC, and were reported to be free of mycoplasma contamination (tested by the vendor). The cell lines were cultured in DMEM media supplemented with 10% fetal bovine serum and 1% PenStrep (100 units/ml penicillin and 100μg/ml streptomycin) and cultured in 5% CO2 at 37°C. No cell lines used in this study are found in the ICLAC database of commonly misidentified cell lines, based on short tandem repeat profiling performed by the vendor. Cell lines with stable expression of Flag-BAP1 WT or mutant were generated as described in our previous publication [18]. Briefly, lentiviral transfections were performed using Lipofectamine 3000 (Life Technologies). HEK293T cells were used to produce lentiviral particles with packing mix (ViraPower Lentiviral Expression System, Invitrogen) and used to infect target cells as per manufacturer’s instruction. CRISPR KO cells were generated by cloning the sgRNAs into the CRISPR-V2 vector (Addgene, #52,961), and lentiviral infection was conducted as described above. Single antibiotic selection-positive cells were sorted and plated into 96-well plates 72 hr later. Surviving KO clones were screened by western blotting using relevant antibodies. To generate shRNA-knockdown cell lines, lentiviral transduction with shRNA vectors was conducted as described above. 72 hr later upon antibiotic selection, expression levels of target genes were determined by immunoblotting with corresponding antibodies.
Constructs and reagents
SLC7A11 shRNAs and SLC7A11 cDNA-containing expression vectors were described in our previous publications [18,19]. Human BAP1 cDNAs (WT and mutant) were generated as described in the our previous publication [20]. The primer sequences used in this study are listed in Table S1. Erastin, ferrostatin-1, and RSL3 were obtained from Sigma or Selleckchem (E7781, SML0583, and S8155), and were dissolved per manufacturers’ instructions.
Immunoprecipitation and western blotting
Immunoprecipitation and western blotting to analyze protein expression were performed as previously described [21–23]. Briefly, whole cell lysates were prepared from cultured cells. Protein samples were loaded and run through a SDS-PAGE gel followed by electrophoretic transfer onto a nitrocellulose membrane (Bio-Rad) using standard techniques. The primary antibodies and the concentration used for western blotting were: BAP1 (1:1000; Santa Cruz, sc-28,383), SLC7A11 (1:5000; Cell Signaling Technology, 12,691), tubulin (1:5000; Cell Signaling Technology, 2144), H2Aub (1:5000; Millipore, 05–678), H2A (1:5000; Millipore, ABE327), vinculin (1:10,000; Sigma, V4505), ATF-4 (D4B8) Rabbit mAb (Cell Signaling Technology, 11,815, 1:1,000 dilution), NRF2 (D1Z9C) XP® Rabbit mAb (Cell Signaling Technology, 12,721, 1:1,000 dilution) GPX4 (R&D systems, MAB5457, 1:1000), BMI-1 (Cell Signaling Technology, 6964S, 1:3000), RNF2 (Cell Signaling Technology, 5694S, 1:2000,), EZH2 (Cell Signa-ling Technology, 3147S, 1:1000), H3K27me3 (Cell Signaling Technology, 9733S, 1:3000).
Cell death measurement
Cell death was monitored by propidium iodide (PI) staining using flow-cytometry as described previously [24–26]. Briefly, cells were washed with cold PBS and resuspended in 100 μl of PBS containing 2 μg/ml of Propidium Iodide (PI) followed by a 30 minute incubation. The cells were subsequently analyzed with a LSRII flow cytometer (BD Biosciences).
Cell viability measurement
CCK8 kit (Sigma, 969,920) was used to measure cell viability. Briefly, 7500 cells/well were plated in a 96-well plate and incubated overnight. The cells were then washed with PBS followed by drug treatment as indicated. Following treatment, all media was removed and replaced with fresh medium containing CCK8 reagent. The plate was then incubated for 1 hr and absorbance was measured at 450 nm using FLUOstar Omega (BMG Labtech).
Real-time PCR
Real time PCR was performed as previously described [27–29]. Briefly, total RNA was extracted using TRIZOL reagent (Invitrogen). 1st strand cDNA was prepared using SuperScript™ First-Strand Synthesis System. Real-time PCR was performed using QuantiTect SYBR Green PCR kit (Qiagen) or TaqMan Universal PCR Master Mix (ABI), and was run on Stratagene MX3000P. For quantification of gene expression, the 2−ΔΔCT method was used and normalized against β-actin expression.
ChIP-qPCR
ChIP experiments were performed using a SimpleChIP Enzymatic Chromatin IP Kit (Cell Signaling Technology, 9003) as previously described [27,30]. Briefly, following chromatin digestion and sonication, lysates were incubated with antibodies against target proteins as well as a control antibody and then used for ChIP. The enriched promoter fragments captured by relevant antibodies were examined by real-time PCR. The signal relative to input was evaluated using a formula from the manufacturer’s protocol as follows: percent input = 2% × 2(C[T][2]% input sample − C[T]IP sample), where C[T] = thres-hold cycle of PCR reaction. The sequences of primers used for real-time PCR and ChIP-qPCR are listed in Table S1. The primary antibodies used for ChIP-qPCR were: H2Aub (Cell Signaling Technology, 8240), BMI-1 (Cell Signaling Technology, 6964S), RNF2 (Cell Signaling Technology, 5694S), EZH2 (Cell Signaling Technology, 3147S), H3K27me3 (Cell Signaling Technology, 9733S).
Statistics
Statistical analysis (two-tailed Student’s t-test) was performed by GraphPad Prism (GraphPad Software) for bar graphs in this manuscript. To compare significance between groups, two-way analysis of variance (ANOVA) analysis was performed. *, p < 0.05; **, p < 0.01; ***, p < 0.001; ****, p < 0.0001; ns, no significance.
Results
BAP1 promotes erastin- but not rsl3-induced ferroptosis
Consistent with our recent study [18], restoration of BAP1 wild type (WT), but not BAP1 C91A DUB-dead mutant, in UMRC6 cells (which is a BAP1-deficient cancer cell line) potently repressed SLC7A11 expression (Figure 1a). GPX4 is another critical regulator of ferroptosis [17]. In parallel analyses, we found that BAP1 restoration did not appear to affect GPX4 expression (Figure 1a). Conversely, BAP1 deletion by CRISPR technology in 786-O cells (a BAP1-proficient cancer cell line) increased SLC7A11 expression but did not affect GPX4 level (Figure 1b).
Figure 1.
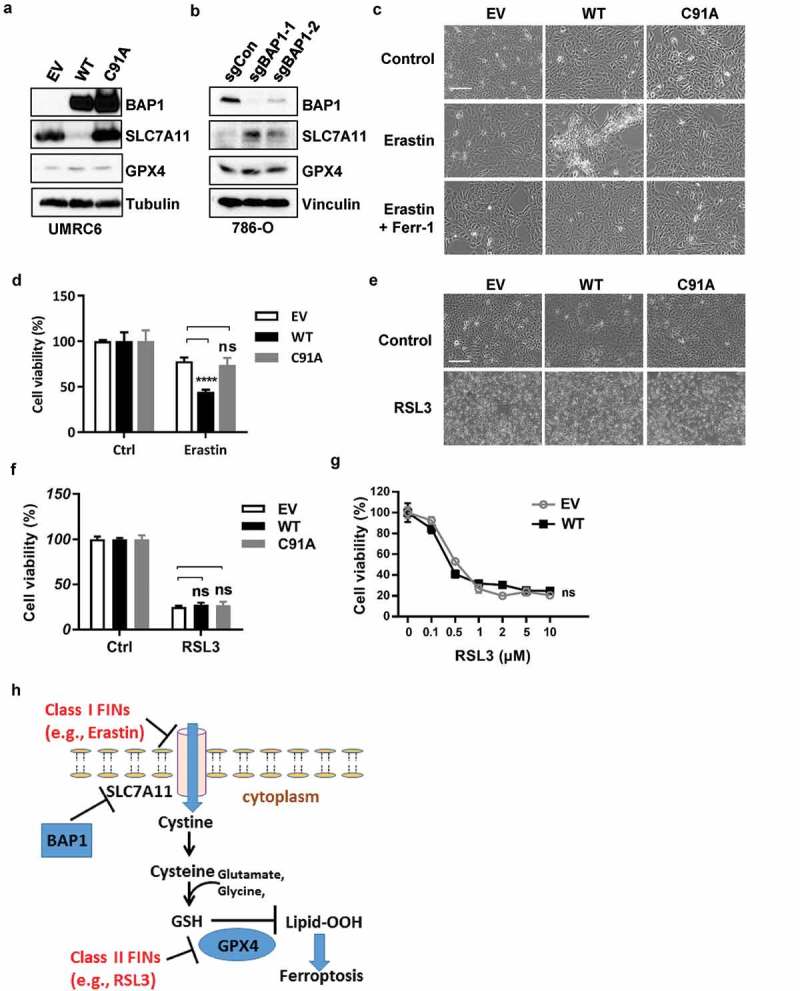
BAP1 promotes erastin- but not RSL3-induced ferroptosis. (a) Western blotting showing protein levels upon BAP1 wild-type or C91A mutant restoration in UMRC6 cells. (b) Western blotting showing protein levels upon BAP1 knockout in 786-O cells. (c) Representative phase contrast microscopy images of the indicated cell lines treated with either erastin (20 μM) or erastin (20 μM) + ferrostatin (2 μM) for 30 hrs. Scale bar, 100 μm. (d) Bar graph showing cell viability in the indicated cell lines treated with erastin (20 μM) for 30 hrs. (e) Representative phase contrast microscopy images of the indicated cell lines treated with RSL3 (0.1 μM) for 8 hrs. Scale bar, 100 μm. (f) Bar graph showing cell viability of cells treated with 0.1 μM RSL3 for 8 hrs. (g) Bar graph showing cell viability of indicted cells treated with different concentrations of RSL3 for 8 hrs. (h) The model depicting different classes of FINs in the ferroptosis pathway. ****, p < 0.0001; ns, no significance.
Class I FINs, such as erastin, induce ferroptosis by blocking SLC7A11-mediated cystine transport [16]. Correspondingly, BAP1 restoration significantly sensitized UMRC6 cells to erastin-induced cell death, which was completely prevented by treatment of ferroptosis inhibitor ferrostatin, thus confirming that the cell death was ferroptosis (Figure 1c,d). This is consistent with our finding that BAP1 represses SLC7A11 expression (therefore, lower dosages of erastin were needed to block SLC7A11 activity and to induce ferroptosis in BAP1-expressing cells, which exhibited lower expression of SLC7A11). In contrast, class II FIN RSL3 induced the same degrees of ferroptotic cell death among empty vector (EV), BAP1 WT, and BAP1 C91A cells (Figure 1e-g), suggesting that BAP1 does not regulate RSL3-induced ferroptosis. This observation was in line with the current model of the ferroptosis pathway [15–17]. Since SLC7A11, the downstream target of BAP1, acts upstream of RSL3 target GPX4, it is expected that the expression levels of SLC7A11 should not affect cellular sensitivity to RSL3 (Figure 1h). Our data thus reinforced our conclusion that BAP1 promotes ferroptosis mainly through regulating SLC7A11.
BAP1 represses SLC7A11 expression independent of NRF2 and ATF4
Previous studies identified several transcription factors that bind to the SLC7A11 promoter and directly regulate SLC7A11 transcription, including p53, NRF2, and ATF4 transcription factors, among which p53 represses the basal expression of SLC7A11, whereas NRF2 and ATF4 promote stress-induced SLC7A11 transcription [12–14]. To study NRF2- and ATF4-mediated SLC7A11 expression under stress conditions, we generated NRF2 and ATF4 knockout (KO) UMRC6 cells by CRISPR technology using two independent single guide RNAs (sgRNAs). We found that the protein levels of NRF2 and ATF4 were very low and almost undetectable under basal conditions, and their protein levels were significantly induced under stress conditions such as glucose starvation (Figure 2a), which is in line with the stress-inducible characteristic of these transcription factors [31,32]. Consistent with our previous report [19], glucose starvation also induced SLC7A11 expression; importantly, glucose starvation-induced SLC7A11 expression was significantly attenuated in either NRF2 KO or ATF4 KO cells (Figure 2a), which is consistent with the roles of NRF2 and ATF4 in regulating stress-induced SLC7A11 transcription.
Figure 2.
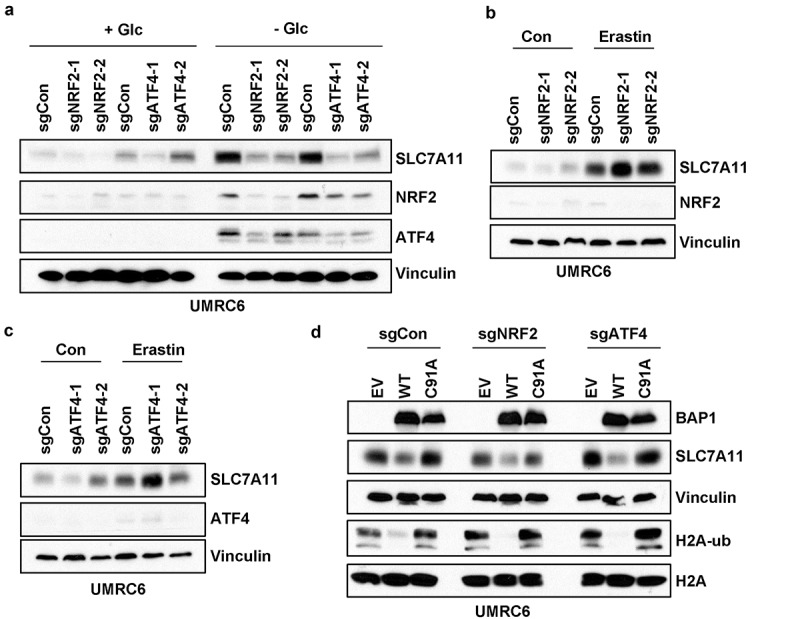
BAP1 represses SLC7A11 expression independent of NRF2 and ATF4. (a) Western blotting showing protein levels in ATF4- or NRF2-knockout UMRC6 cells upon glucose starvation for 4 hrs. (b) Western blotting showing protein levels in NRF2-knockout UMRC6 cells upon treatment of 20μM erastin for 24 hrs. (c) Western blotting showing protein levels in ATF4-knockout UMRC6 cells upon treatment of 20μM erastin for 24 hrs. (d) Western blotting showing protein levels upon BAP1 wild-type or C91A mutant restoration in ATF4- or NRF2-knockout UMRC6 cells.
Previously we and others have shown that erastin treatment also induces SLC7A11 expression [16,18], presumably as an adaptive cellular response (i.e., in response to erastin treatment, cells try to produce more SLC7A11 to compensate for the inhibition of SLC7A11-mediated cystine import by erastin). Surprisingly, erastin treatment did not induce NRF2 or ATF4 in UMRC6 cells; furthermore, NRF2 or ATF4 deficiency did not attenuate erastin-induced SLC7A11 expression (Figure 2b,c). These observations with erastin treatment were in stark contrast to those with glucose starvation (compare Figure 2a-c), strongly suggesting that different mechanisms are employed to regulate SLC7A11 expression under different stress conditions.
Our recent study showed that BAP1 regulates SLC7A11 expression in a p53-independent manner because BAP1 was still capable of repressing SLC7A11 expression in p53 KO cells [18]. We also studied whether NRF2 or ATF4 plays any role in BAP1-mediated SLC7A11 repression. Our analysis showed that BAP1 restoration in control UMRC6 cells decreased H2Aub and SLC7A11 levels to similar degrees to that in NRF2 or ATF4 KO UMRC6 cells (Figure 2d), suggesting that BAP1 regulates SLC7A11 expression independent of NRF2 or ATF4.
PRC1 regulates SLC7A11 expression and h2aub occupancy on the SLC7A11 promoter
Since our study suggested that BAP1 represses SLC7A11 expression through regulating H2Aub occupancy on the SLC7A11 promoter, we therefore studied the potential role of PRC1, the best-known ubiquitin ligase of H2Aub [6], in the regulation of SLC7A11 repression. We focused on two core components of the PRC1: ring finger protein 2 (RNF2) and BMI1 (also called PCGF4). RNF2 is the catalytic subunit of PRC1 and functions to catalyze mono-ubiquitination of Lys-119 of H2A, while BMI1 regulates PRC1 architecture and activity [33,34]. ChIP assay revealed binding of RNF2 or BMI1 on the SLC7A11 promoter, and the binding could be eliminated upon knockdown of the corresponding gene, thus validating the binding of RNF2 or BMI1 on the target gene is specific (Figure 3a,b). Consistent with the established role of PRC1 as the ubiquitin ligase of H2Aub, RNF2 or BMI1 knockdown in UMRC6 cells decreased H2Aub binding on the SLC7A11 promoter (Figure 3a,b). Interestingly, similar to BAP1 deficiency, RNF2 or BMI1 deficiency also increased SLC7A11 expression (Figure 3c-f). We made the similar observations in 786-O cells (Figure 3g,h). Together, our data showed that BAP1 decreases whereas PRC1 increases H2Aub binding on the SLC7A11 promoter, but both BAP1 and PRC1 represses SLC7A11 expression, thus supporting a model that a balance between H2A ubiquitination and de-ubiquitination might be important for maintaining SLC7A11 repression (see Discussion).
Figure 3.
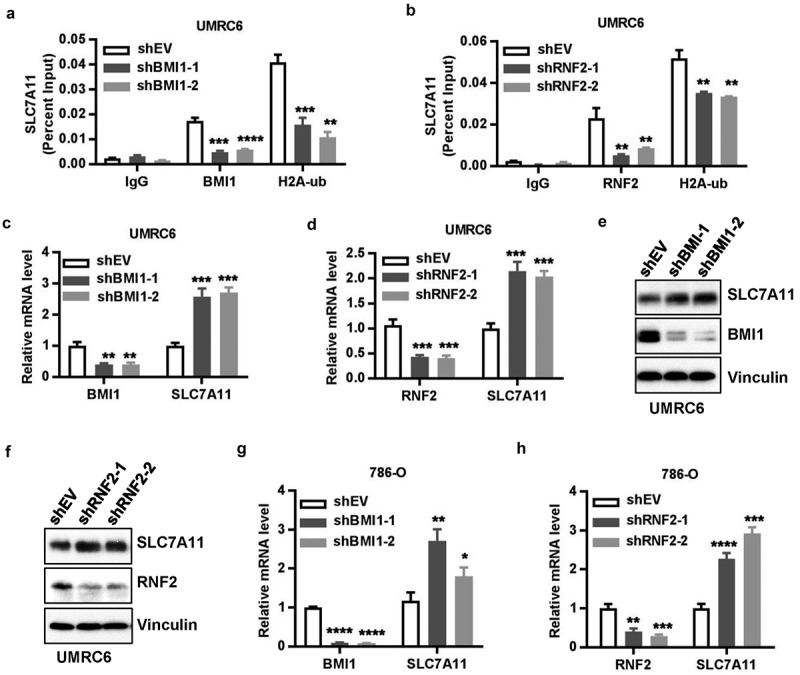
PRC1 regulates SLC7A11 expression and H2Aub occupancy on the SLC7A11 promoter. (a) ChIP–qPCR showing the binding of BMI-1 and H2Aub on the SLC7A11 promoter, and decreased binding of H2Aub on the SLC7A11 promoter upon BMI-1 knockdown. (b) ChIP–qPCR showing the binding of RNF2 and H2Aub on the SLC7A11 promoter, and decreased binding of H2Aub on the SLC7A11 promoter upon RNF-2 knockdown. (c-f) BMI-1 or RNF2 deficiency increased SLC7A11 mRNA (c, d) and protein levels (e, f) in UMRC6 cells. (g-h) BMI-1 (g) or RNF2 (h) deficiency in 786-O cells increased SLC7A11 mRNA levels. *, p < 0.05; **, p < 0.01; ***, p < 0.001; ****, p < 0.0001.
BAP1 does not affect PRC1 or PRC2 function
We next sought to determine whether there is any cross-talk between BAP1 and PRC1 in the cell lines we have studied. BAP1 and several other BAP1-interacting proteins, including ASXL1/2, FOXK1/2, HCFC1, KDM1B, OGT, MBD5/6, form the so-called polycomb repressive deubiquitinase (PR-DUB) complex [1]. Mass spectrometry analysis in cell lines used in our study identified all these PR-DUB components but failed to identify any PRC1 component as BAP1-interacting proteins, arguing against a physical interaction between BAP1 and PRC1. In addition, BAP1 restoration in UMRC6 cells or BAP1 deletion in 786-O cells affected H2Aub levels as expected, but did not affect RNF2 or BMI1 levels (Figure 4a; see Figure 1a,b for BAP1 blotting in these cells). ChIP assay showed that BAP1 deficiency did not affect BMI1 or RNF2 binding on the SLC7A11 promoter. Thus, our data suggested that BAP1 does not regulate PRC1 expression or PRC1 binding on the SLC7A11 promoter.
Figure 4.
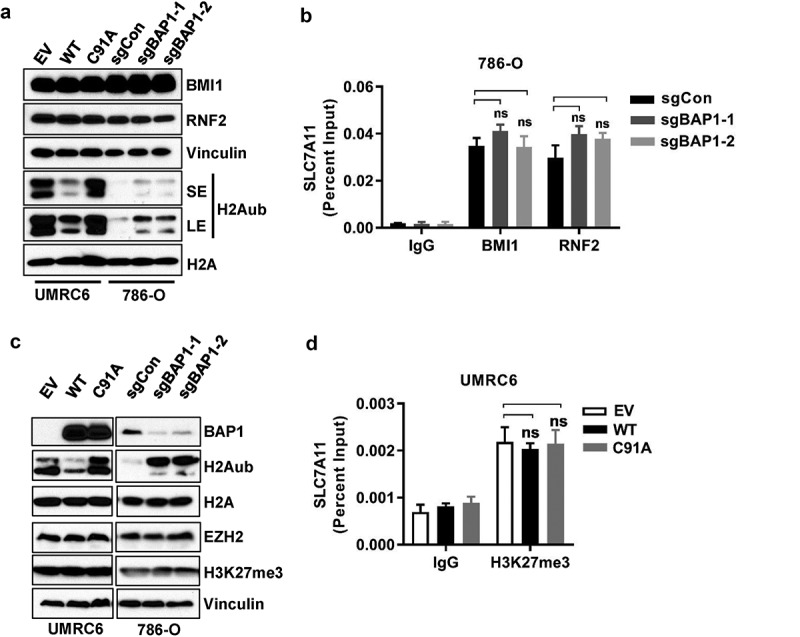
BAP1 does not affect PRC1 or PRC2 function. (a, c) Western blotting showing indicated protein levels upon BAP1 wild-type or C91A mutant restoration in UMRC6 cells or BAP1 knockout in 786-O cells. (b) ChIP–qPCR showing BMI-1 and RNF2 binding on the SLC7A11 promoter in BAP1-knockout 786-O cells. (d) ChIP–qPCR showing H3K27me3 level on the SLC7A11 promoter in BAP1 wild-type or C91A mutant restored UMRC6 cells. ns, no significance.
A recent study showed that BAP1 deletion resulted in increased expression of EZH2, a core component of the polycomb repressive complex 2 (PRC2), and enhanced levels of trimethylated histone H3 lysine 27 (H3K27me3, a biochemical readout for PRC2 activity), leading to EZH2 dependency in BAP1-deficient tumors [35], although this finding was later challenged by another study [36]. Given the intimate link between PRC1 and PRC2 [37], it is possible that BAP1 might indirectly affect PRC1 function through PRC2 in certain contexts. We thus examined the potential effect of BAP1 on PRC2 in our cell lines. Our analyses revealed that BAP1 restoration or deletion, while clearly affecting H2Aub levels, did not affect the levels of EZH2 or H3K27me3 (Figure 4c). It is also possible that BAP1 regulates H3K27me3 occupancy on specific genes, such as SLC7A11, without affecting the global H3K27me3 levels. However, ChIP assay showed that BAP1 did not affect H3K27me3 binding on the SLC7A11 promoter. Together, our study showed that BAP1 does not regulate EZH2 expression, H3K27me3 level, or H3K27me3 binding on the SLC7A11 promoter at least in the cell lines we have studied.
Discussion
Following our recent discovery that BAP1 regulates SLC7A11 and ferroptosis [18], in this study we report several additional findings. We showed that BAP1 promotes erastin- but not RSL3-induced ferroptosis, which is in agreement with our model that BAP1 promotes ferroptosis mainly through SLC7A11. In addition, we showed that NRF2 and ATF4 transcription factors are required for glucose starvation-induced SLC7A11 expression, but not for erastin-induced or BAP1-medfiated SLC7A11 expression. Finally, while BAP1 and PRC1 exert opposing effects on H2Aub binding on the SLC7A11 promoter, both BAP1 and PRC1 repress SLC7A11 expression. These data together have advanced our understanding of transcriptional regulation of SLC7A11 by different transcription factors and epigenetic modulators.
Our findings that erastin treatment does not induce NRF2 or ATF4 and that NRF2 and ATF4 are not required for erastin-induced SLC7A11 expression are surprising and unexpected. Our recent study confirmed that erastin treatment significantly inhibited SLC7A11-mediated cystine uptake and induced lipid peroxidation [18]; thus, one would expect that erastin treatment should deplete intracellular cystine levels and induce oxidative stress, which in turn should induce ATF4 and NRF2 protein levels, respectively, as it is well established that amino acid depletion selectively promotes ATF4 mRNA translation, whereas oxidative stress inhibits KEAP1-mediated NRF2 ubiquitination and stabilizes NRF2 [9,31,32]. In parallel analyses we showed that, as expected, glucose starvation induced NRF2 and ATF4 protein levels, suggesting that the regulatory circuitries of NRF2 and ATF4 pathways are intact in cell lines used in our study. It is possible that amino acid depletion or oxidative stress induced by erastin treatment in our study did not reach the thresholds that can induce ATF4 or NRF2. Since under the same treatment condition, erastin clearly induced SLC7A11 expression, our data strongly suggested that erastin induces SLC7A11 expression through a NRF2- or ATF4-independent mechanism. The exact mechanism by which erastin induces SLC7A11 expression awaits further investigation in our future studies.
Because H2Aub is generally correlated with transcriptional repression [5], one would expect that BAP1, as a H2Aub DUB, should activate gene transcription. Consistent with this, our genome-wide analyses showed that putative BAP1 target genes (i.e., genes with BAP1-dependent H2Aub reduction) are enriched with BAP1-activated genes [18]. However, there are still substantial numbers of BAP1 target genes that are repressed by BAP1 (187 out of 541 genes, including SLC7A11), suggesting that BAP1 might regulate both transcriptional activation and repression. How BAP1-mediated H2Aub reduction regulates gene repression remains unclear. Previous studies in Drosophila showed that mutation of either PRC1 or BAP1 resulted in de-repression of HOX genes, indicating that a dynamic balance of H2A ubiquitination and de-ubiquitination, rather than H2Aub per se, might be critical for the maintenance of HOX gene repression [7,8]. Our current and previous studies [18] showed that, while BAP1 and PRC1 inactivation had opposite effects on H2Aub occupancy on the SLC7A11 promoter (i.e., BAP1 knockdown increased but PRC1 knockdown decreased H2Aub occupancy on the SLC7A11 promoter), both had the same effects on SLC7A11 expression (i.e., knockdown of BAP1 or PRC1 resulted in de-repression of SLC7A11). Thus, our data are in line with the model from Drosophila studies and suggest a hypothesis that BAP1 and PRC1 coordinately repress SLC7A11 expression through dynamic regulation of H2Aub levels on the SLC7A11 promoter (Figure 5). Future genome-wide analyses to compare H2Aub occupancy and gene expression profiles in both BAP1 and PRC1 deficient cells will shed additional lights on this intriguing hypothesis.
Figure 5.
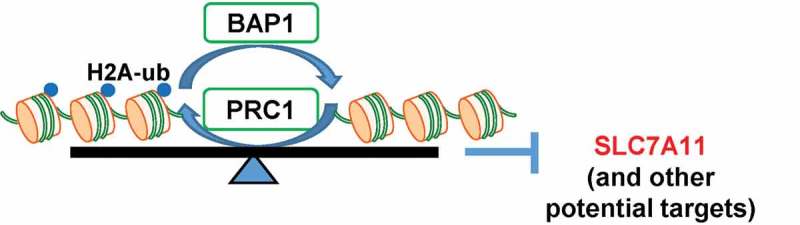
The working model of SLC7A11 regulation by BAP1 and PRC1. BAP1 and PRC1 coordinately repress SLC7A11 expression through regulation of H2Aub levels on the SLC7A11 promoter. See text for detailed discussion.
It should be noted that, as with most epigenetic studies, our understanding of H2Aub in gene transcription mainly rely on correlative data (i.e., how H2Aub occupancies on genes correlate with expression changes of corresponding genes). Currently it is challenging to definitively establish whether an epigenetic modulator regulates target gene expression via corresponding histone mark changes (e.g., whether BAP1 or PRC1 represses SLC7A11 expression via H2Aub de-ubiquitination on the SLC7A11 promoter). A typical approach to address this question would examine whether BAP1 regulation of SLC7A11 expression is abolished or attenuated in H2A K119R (non-ubiquitinated) mutant-expressing cells. While this approach is commonly used to study the relevance of a post-translational modification in a signaling molecule to an assigned biological function, it is rarely used in the epigenetic field to study the functional relevance of a histone modification (including H2Aub), mainly because of the abundance of histone proteins and the potential for undesired global effects by overexpressing histone mutants. Indeed, we have found extremely challenging to overexpress histone mutants (to sufficient levels to achieve a dominant-negative effect) or to achieve efficient histone knockdown (then followed by re-expression of histone mutants in histone knockdown cells). It is also unlikely to generate H2A K119R knock-in cells using CRISPR technology, because mammalian cells have multiple H2A gene copies. New approaches or technologies will be needed to address such questions in our future studies (such as an engineering technology to mutate or block H2A ubiquitination in a locus-specific manner).
Funding Statement
This work was supported by the National Cancer Institute [CA181196].
Acknowledgments
This research has been supported by the Andrew Sabin Family Fellow Award, the Sister Institution Network Fund, and Bridge Fund from The University of Texas MD Anderson Cancer Center, Anna Fuller Fund, and R01CA181196 grant from the National Institutes of Health (to B.G.). B.G. is an Andrew Sabin Family Fellow. Y.Z. and P.K. were Scholars at the Center for Cancer Epigenetics at The University of Texas MD Anderson Cancer Center. P.K. is also supported by the CPRIT Research Training Grant (RP170067) and Dr. John J. Kopchick Research Award from The MD Anderson UTHealth Graduate School of Biomedical Sciences. This research has also been supported by the National Institutes of Health Cancer Center Support Grant P30CA016672 to The University of Texas MD Anderson Cancer Center.
Disclosure statement
No potential conflict of interest was reported by the authors.
Supplementary material
Supplemental data for this article can be accessed here.
References
- [1].Carbone M, Yang H, Pass HI, et al. BAP1 and cancer. Nat Rev Cancer. 2013;13:153–159. [DOI] [PMC free article] [PubMed] [Google Scholar]
- [2].Carbone M, Ferris LK, Baumann F, et al. BAP1 cancer syndrome: malignant mesothelioma, uveal and cutaneous melanoma, and MBAITs. J Transl Med. 2012;10:179. [DOI] [PMC free article] [PubMed] [Google Scholar]
- [3].Testa JR, Cheung M, Pei J, et al. Germline BAP1 mutations predispose to malignant mesothelioma. Nat Genet. 2011;43:1022–1025. [DOI] [PMC free article] [PubMed] [Google Scholar]
- [4].Kallin EM, Cao R, Jothi R, et al. Genome-wide uH2A localization analysis highlights Bmi1-dependent deposition of the mark at repressed genes. PLoS Genet. 2009;5:e1000506. [DOI] [PMC free article] [PubMed] [Google Scholar]
- [5].Weake VM, Workman JL.. Histone ubiquitination: triggering gene activity. Mol Cell. 2008;29:653–663. [DOI] [PubMed] [Google Scholar]
- [6].Wang H, Wang L, Erdjument-Bromage H, et al. Role of histone H2A ubiquitination in Polycomb silencing. Nature. 2004;431:873–878. [DOI] [PubMed] [Google Scholar]
- [7].Scheuermann JC, de Ayala Alonso AG, Oktaba K, et al. Histone H2A deubiquitinase activity of the Polycomb repressive complex PR-DUB. Nature. 2010;465:243–247. [DOI] [PMC free article] [PubMed] [Google Scholar]
- [8].Schuettengruber B, Cavalli G.. The DUBle life of polycomb complexes. Dev Cell. 2010;18:878–880. [DOI] [PubMed] [Google Scholar]
- [9].Koppula P, Zhang Y, Zhuang L, et al. Amino acid transporter SLC7A11/xCT at the crossroads of regulating redox homeostasis and nutrient dependency of cancer. Cancer Commun (Lond). 2018;38:12. [DOI] [PMC free article] [PubMed] [Google Scholar]
- [10].Conrad M, Sato H. The oxidative stress-inducible cystine/glutamate antiporter, system x (c) (-): cystine supplier and beyond. Amino Acids. 2012;42:231–246. [DOI] [PubMed] [Google Scholar]
- [11].Ye P, Mimura J, Okada T, et al. Nrf2- and ATF4-dependent upregulation of xCT modulates the sensitivity of T24 bladder carcinoma cells to proteasome inhibition. Mol Cell Biol. 2014;34:3421–3434. [DOI] [PMC free article] [PubMed] [Google Scholar]
- [12].Jiang L, Kon N, Li T, et al. Ferroptosis as a p53-mediated activity during tumour suppression. Nature. 2015;520:57–62. [DOI] [PMC free article] [PubMed] [Google Scholar]
- [13].Sasaki H, Sato H, Kuriyama-Matsumura K, et al. Electrophile response element-mediated induction of the cystine/glutamate exchange transporter gene expression. J Biol Chem. 2002;277:44765–44771. [DOI] [PubMed] [Google Scholar]
- [14].Sato H, Nomura S, Maebara K, et al. Transcriptional control of cystine/glutamate transporter gene by amino acid deprivation. Biochem Biophys Res Commun. 2004;325:109–116. [DOI] [PubMed] [Google Scholar]
- [15].Stockwell BR, Friedmann Angeli JP, Bayir H, et al. Ferroptosis: A regulated cell death nexus linking metabolism, redox biology, and disease. Cell. 2017;171:273–285. [DOI] [PMC free article] [PubMed] [Google Scholar]
- [16].Dixon SJ, Lemberg KM, Lamprecht MR, et al. Ferroptosis: an iron-dependent form of nonapoptotic cell death. Cell. 2012;149:1060–1072. [DOI] [PMC free article] [PubMed] [Google Scholar]
- [17].Yang WS, SriRamaratnam R, Welsch ME, et al. Regulation of ferroptotic cancer cell death by GPX4. Cell. 2014;156:317–331. [DOI] [PMC free article] [PubMed] [Google Scholar]
- [18].Zhang Y, Shi J, Liu X, et al. BAP1 links metabolic regulation of ferroptosis to tumour suppression. Nat Cell Biol. 2018;20:1181–1192. [DOI] [PMC free article] [PubMed] [Google Scholar]
- [19].Koppula P, Zhang Y, Shi J, et al. The glutamate/cystine antiporter SLC7A11/xCT enhances cancer cell dependency on glucose by exporting glutamate. J Biol Chem. 2017;292:14240–14249. [DOI] [PMC free article] [PubMed] [Google Scholar]
- [20].Dai F, Lee H, Zhang Y, et al. BAP1 inhibits the ER stress gene regulatory network and modulates metabolic stress response. Proc Natl Acad Sci U S A. 2017;114:3192–3197. [DOI] [PMC free article] [PubMed] [Google Scholar]
- [21].Xiao ZD, Han L, Lee H, et al. Energy stress-induced lncRNA FILNC1 represses c-Myc-mediated energy metabolism and inhibits renal tumor development. Nat Commun. 2017;8:783. [DOI] [PMC free article] [PubMed] [Google Scholar]
- [22].Gan B, Yoo Y, Guan JL. Association of focal adhesion kinase with tuberous sclerosis complex 2 in the regulation of s6 kinase activation and cell growth. J Biol Chem. 2006;281:37321–37329. [DOI] [PubMed] [Google Scholar]
- [23].Gan B, Melkoumian ZK, Wu X, et al. Identification of FIP200 interaction with the TSC1-TSC2 complex and its role in regulation of cell size control. J Cell Biol. 2005;170:379–389. [DOI] [PMC free article] [PubMed] [Google Scholar]
- [24].Liu X, Xiao ZD, Han L, et al. LncRNA NBR2 engages a metabolic checkpoint by regulating AMPK under energy stress. Nat Cell Biol. 2016;18:431–442. [DOI] [PMC free article] [PubMed] [Google Scholar]
- [25].Liu X, Gan B. lncRNA NBR2 modulates cancer cell sensitivity to phenformin through GLUT1. Cell Cycle. 2016;15:3471–3481. [DOI] [PMC free article] [PubMed] [Google Scholar]
- [26].Lin A, Yao J, Zhuang L, et al. The FoxO-BNIP3 axis exerts a unique regulation of mTORC1 and cell survival under energy stress. Oncogene. 2014;33:3183–3194. [DOI] [PMC free article] [PubMed] [Google Scholar]
- [27].Lin A, Piao HL, Zhuang L, et al. FoxO transcription factors promote AKT Ser473 phosphorylation and renal tumor growth in response to pharmacological inhibition of the PI3K-AKT pathway. Cancer Res. 2014;74(6):1682–1693. [DOI] [PMC free article] [PubMed] [Google Scholar]
- [28].Lee H, Dai F, Zhuang L, et al. BAF180 regulates cellular senescence and hematopoietic stem cell homeostasis through p21. Oncotarget. 2016;7:19134–19146. [DOI] [PMC free article] [PubMed] [Google Scholar]
- [29].Chauhan AS, Liu X, Jing J, et al. STIM2 interacts with AMPK and regulates calcium-induced AMPK activation. FASEB J. 2019;33(2):2957–2970. [DOI] [PMC free article] [PubMed] [Google Scholar]
- [30].Gan B, Lim C, Chu G, et al. FoxOs enforce a progression checkpoint to constrain mTORC1-activated renal tumorigenesis. Cancer Cell. 2010;18:472–484. [DOI] [PMC free article] [PubMed] [Google Scholar]
- [31].Pakos-Zebrucka K, Koryga I, Mnich K, et al. The integrated stress response. EMBO Rep. 2016;17:1374–1395. [DOI] [PMC free article] [PubMed] [Google Scholar]
- [32].Sykiotis GP, Bohmann D. Stress-activated cap‘n‘collar transcription factors in aging and human disease. Sci Signal. 2010;3:re3. [DOI] [PMC free article] [PubMed] [Google Scholar]
- [33].Gil J, O‘Loghlen A. PRC1 complex diversity: where is it taking us? Trends Cell Biol. 2014;24:632–641. [DOI] [PubMed] [Google Scholar]
- [34].Blackledge NP, Rose NR, Klose RJ. Targeting Polycomb systems to regulate gene expression: modifications to a complex story. Nat Rev Mol Cell Biol. 2015;16:643–649. [DOI] [PMC free article] [PubMed] [Google Scholar]
- [35].LaFave LM, Beguelin W, Koche R, et al. Loss of BAP1 function leads to EZH2-dependent transformation. Nat Med. 2015;21:1344–1349. [DOI] [PMC free article] [PubMed] [Google Scholar]
- [36].Schoumacher M, Le Corre S, Houy A, et al. Uveal melanoma cells are resistant to EZH2 inhibition regardless of BAP1 status. Nat Med. 2016;22:577–578. [DOI] [PubMed] [Google Scholar]
- [37].Schuettengruber B, Bourbon HM, Di Croce L, et al. Genome regulation by polycomb and trithorax: 70 years and counting. Cell. 2017;171:34–57. [DOI] [PubMed] [Google Scholar]
Associated Data
This section collects any data citations, data availability statements, or supplementary materials included in this article.