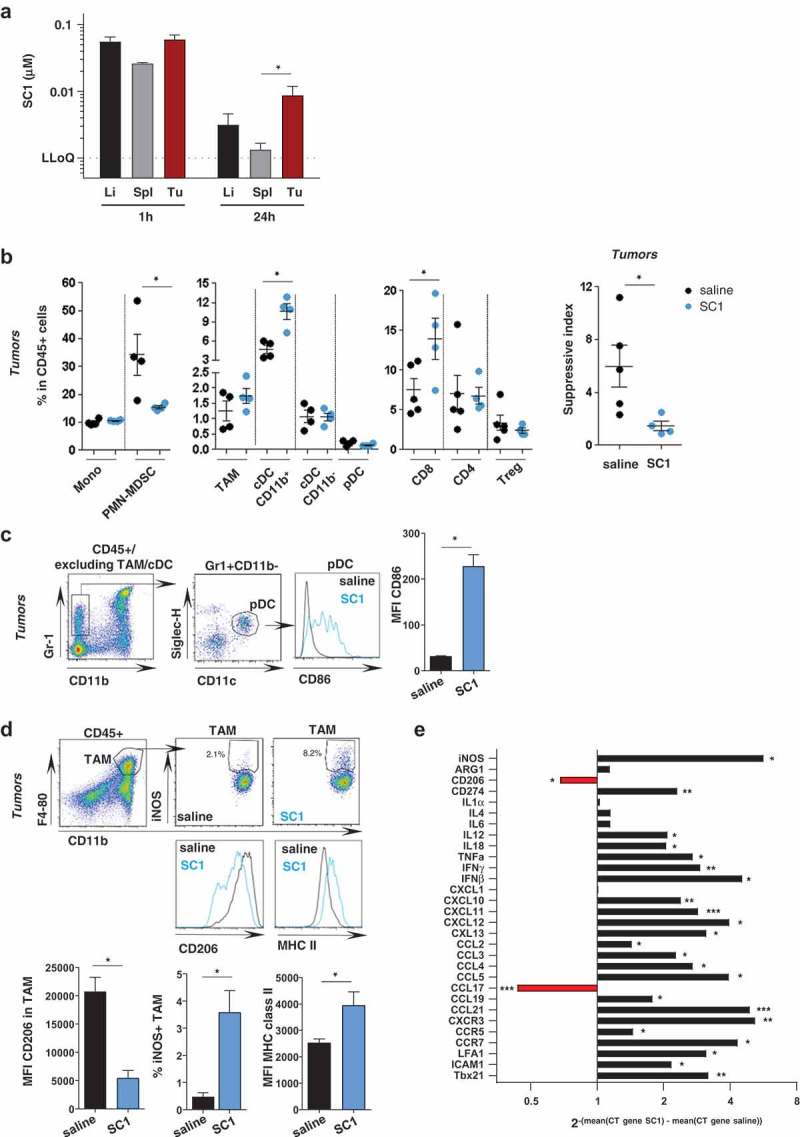
Figure 3.

Intravenous administered SC1 is retained in the tumor environment and associated with activation of immune cells and Th1 polarization.
BALB/c mice were injected s.c. with CT26 cells. (a) After tumors reached sizes of 70–100 mm3, mice (n = 3–5/group) were i.v injected with single dose of SC1 or with vehicle (saline). Kinetics of SC1 quantification detected in liver (Li), spleen (Sp) and tumor (Tu) at 1 h and 24 h after injection were performed by LC-MS/MS. LLOQ: lower limit of quantification. Data representative of two independent experiments. B-E) After tumors reached sizes of 20–50 mm3, mice were treated i.v. with SC1 or with vehicle (saline) every 5 d. 24 h after treatment with fourth dose mice were sacrificed and tumors collected for flow cytometric analysis (B-D, data representative of two independent experiments) and for differential gene expression analysis (E). (b) Indicated leukocyte populations identified in CT26 tumors as a percentage of total CD45+ infiltrated cells (left). Suppressive index was calculated as the ratio of the frequencies of PMN-MDSC and CD8+ T cells (right). (c) Representative flow cytometry plots of the intratumoral pDC and CD86 expression. (d) Representative flow cytometry plots of TAM and level of expression of iNOS, CD206 and MHC class II. (e) mRNA expression levels of immuno-modulators in tumor samples from SC1 and vehicle (saline) treated mice. Data shown as mean ± s.e.m. of the indicated numbers of mice, p*<0.05, p**<0.01 using Mann–Whitney test (A-D) and unpaired t-test. (E).
