Abstract
Myocardial function deteriorates over the course of fibrotic cardiomyopathy, due to electrophysiological and mechanical effects of myofibroblasts that are not completely understood. Although a range of experimental model systems and associated theoretical treatments exist at the levels of isolated cardiomyocytes and planar co-cultures of myofibroblasts and cardiomyocytes, interactions between these cell types at the tissue level are less clear. We studied these interactions through an engineered heart tissue (EHT) model of fibrotic myocardium and a mathematical model of the effects of cellular composition on EHT impulse conduction velocity. The EHT model allowed for modulation of cardiomyocyte and myofibroblast volume fractions, and observation of cell behavior in a three-dimensional environment that is more similar to native heart tissue than is planar cell culture. The cardiomyocyte and myofibroblast volume fractions determined the retardation of impulse conduction (spread of the action potential) in EHTs as measured by changes of the fluorescence of the Ca2+ probe, Fluo-2. Interpretation through our model showed retardation far in excess of predictions by homogenization theory, with conduction ceasing far below the fibroblast volume fraction associated with steric percolation. Results point to an important multiscale structural role of myofibroblasts in attenuating impulse conduction in fibrotic cardiomyopathy.
Graphical Abstract
Introduction
Cardiac pathology, such as that resulting from infarction or hypertension, prompts the conversion of fibroblasts to myofibroblasts, a larger and more contractile phenotype that produces collagen, necessary for wound-healing1. Myofibroblasts are adaptive to some extent, preserving the integrity of the heart after tissue injury; however, excessive myofibroblast proliferation leads to cardiac fibrosis and degrades mechanical functionality2. Myofibroblasts can also disrupt electrical impulse propagation, causing arrhythmogenesis.3
Conduction velocity depends on individual cardiomyocyte excitability, transmission between cardiomyocytes, and the three-dimensional (3-D) tissue structure.4 Furthermore, myofibroblasts may influence cardiac electrophysiology via paracrine interactions with cardiomyocytes, mechanical-electrical feedback, and direct electrotonic interaction.4 One-dimensional studies have shown increasing myofibroblast concentration to induce a biphasic response in impulse conduction velocity, with increased velocity at low myofibroblast concentrations followed by declining velocity at higher concentrations.5 These effects have been attributed to factors including gap junction-mediated electrotonic interaction between myofibroblasts and cardiomyocytes.5,6 Further coculture studies have found evidence of bi-directional electrotonic interactions between cardiomyocytes and myofibroblasts via gap junctions.7 Monolayers of co-cultured cardiomyocytes and myofibroblasts have also shown decreased conduction velocity with increased myofibroblast concentration.8,9 However, the effects in native myocardium are unclear, with human hearts in end-stage non-ischemic heart failure showing decreased conduction velocity in the transmural but axial conduction, suggesting anisotropic effects that do not degrade gap junctions or axial connectivity between cardiomyocytes.10 Despite these findings, the role of cardiomyocyte-myofibroblast electrotonic interactions in native myocardium remains unclear. A refined understanding of the electrophysiology of myofibroblast-cardiomyocyte interactions, particularly with regard to impulse conduction, is crucial to the development of therapeutic strategies.
In this study, we used well-characterized, 3-D engineered heart tissue (EHT) constructs as an experimental model for the electrophysiology of such cardiomyopathy. The EHTs can be assembled from embryonic cardiomyocytes and myofibroblasts, allowing broad parametric control over cell volume fractions, collagen concentration, and boundary conditions.11,12 The 3-D nature of the EHT provides cells an environment that replicates the behavior of native myocardium more accurately than 2-D culture.13,14 Multiple investigations have found that EHT constructs can provide a robust model for experimental study of electrical cardiac function and its response to stress and treatment.13–16 While conduction velocities have been studied in one-dimensional culture3 and in whole hearts,17 the ability to investigate the effects of randomly dispersed myofibroblasts in a more realistic 3-D environment represents a promising approach.
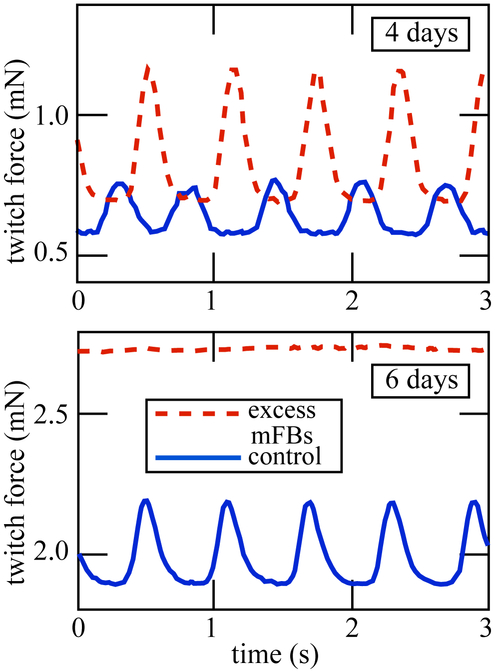
A preliminary mechanical investigation showed that EHTs with added myofibroblasts developed greater stiffness and baseline force than the control EHTs (Figure 1)18. Initially, they displayed greater twitch force as well, but this twitch force rapidly degraded. Whether this behavior is due to mechanical, electrical, or paracrine mechanisms, or some combination, is not clear. A key point of interest in the development of this methodology is to determine the contribution of cardiomyocyte-myofibroblast electrotonic interactions to this observed mechanical behavior. We hypothesized that myofibroblasts would act as strong resistors, and that they would therefore attenuate conduction velocity over the tissue in a way that followed passive homogenization estimates.
Figure 1:
Myofibroblast content of the EHT determines the development of contractile forces. Data from Genin et al.18.
Methods and Materials
EHT Preparation
EHT specimens were prepared as described previously12 by isolating cardiomyocytes from 10-day-old chicken embryos, and suspending the cells (approximately 1.4 million/ ml, final concentration) in Type I rat tail collagen, Dulbecco’s modified Eagle’s medium with 10% fetal bovine serum, and 4% chicken embryo extract. Two sets of EHTs were prepared: one populated with purified cardiomyocytes, which served as a control set, and a second set in which 20% of cardiomyocytes were replaced with myofibroblasts. Due to the incompleteness of the separation of cardiomyocytes from other fetal cardiac cells, the control preparation contained an unspecified number of cells other than cardiomyocytes including fibroblasts and endothelial cells. We term these non-cardiomyocytes myofibroblasts in the following, but we note the possibility that other cell types were present.
The cells remodeled the loose collagen gel, compressing and stiffening it. The process occurred sooner in the EHTs with augmented myofibroblasts. Although the initiation of contraction was variable, the cardiomyocytes began contracting individually in 3 to 4 days and coherently as a tissue in 5-7 days. The mixture was poured into a mold and cultured in a 37 °C CO2 incubator, producing a loose collagen gel in which cells were randomly distributed. The cardiomyocytes began contracting coherently within 5 days. The control EHTs were tested at 6, 8, and 17 days following preparation; the myofibroblast-enhanced EHTs were tested 5 and 7 days after preparation.
Calcium transient measurements
Impulse propagation in EHTs was recorded with the aid of Fluo-2 (TEFlabs, Austin, TX), a fluorescent calcium indicator exciting/emitting at 488/515 nm. Imaging was performed on a Zeiss LSM 510 scanning confocal microscope, using the 10x objective. Images were recorded with a pco.edge sCMOS camera (Kelheim, Germany), and a 470 nm laser served as the excitation source. An environmental chamber maintained a constant temperature of 37 °C.
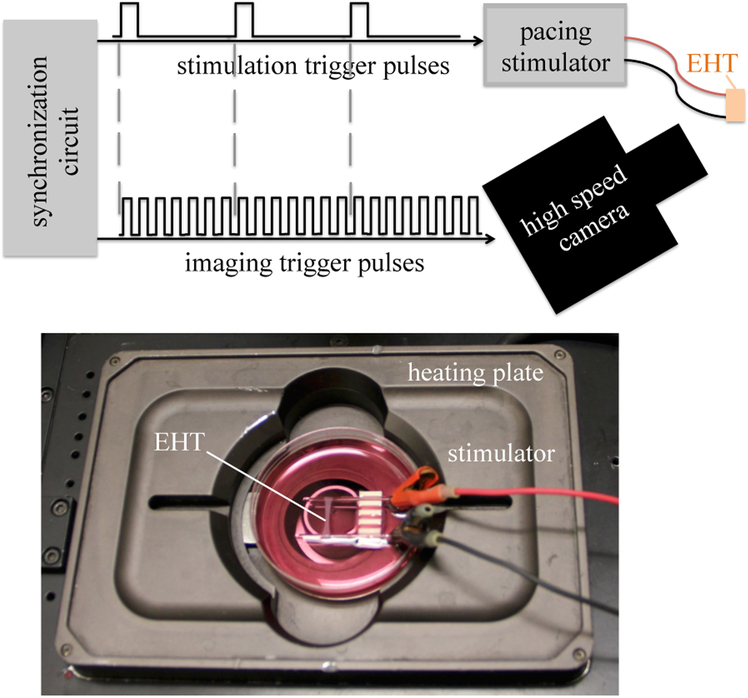
Ring-shaped EHTs were mounted on a pair of glass rods with fine wire electrodes, and stimulated with a Grass SD9 Stimulator producing square wave pulses of approximately 5 V at 1 Hz. A custom timing circuit synchronized the camera to the stimulus. Figure 2 shows a tissue mounted in the experimental setup.
Figure 2:
Top: EHT specimens were paced and imaged using an integrated system to enable mapping of calcium transients. Bottom: an EHT mounted for imaging on a heating plate (not shown: glass cover).
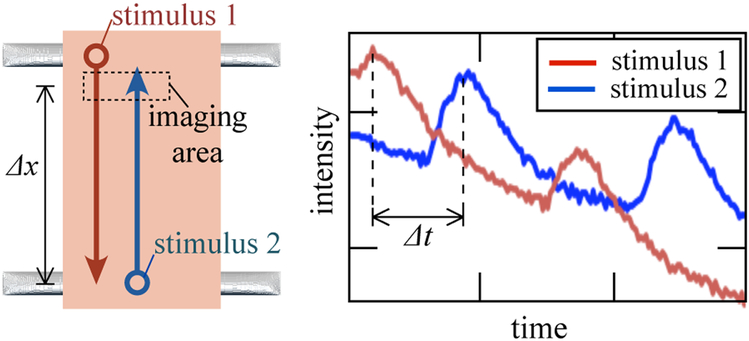
Conduction velocity was measured by imaging a group of cells near the point of stimulation; the same group of cells was then imaged while stimulation was applied to the opposite end of the tissue (Figure 3). The lag (Δt) between peaks in the fluorescent response yielded the impulse conduction velocity. Measurements were made at several points in each tissue, and multiple sequences were recorded in each direction for each point.
Figure 3:
EHT specimens were paced at opposite ends, and their fluorescence transients were analyzed to estimate cimpulse conduction velocity.
Volume fraction analysis
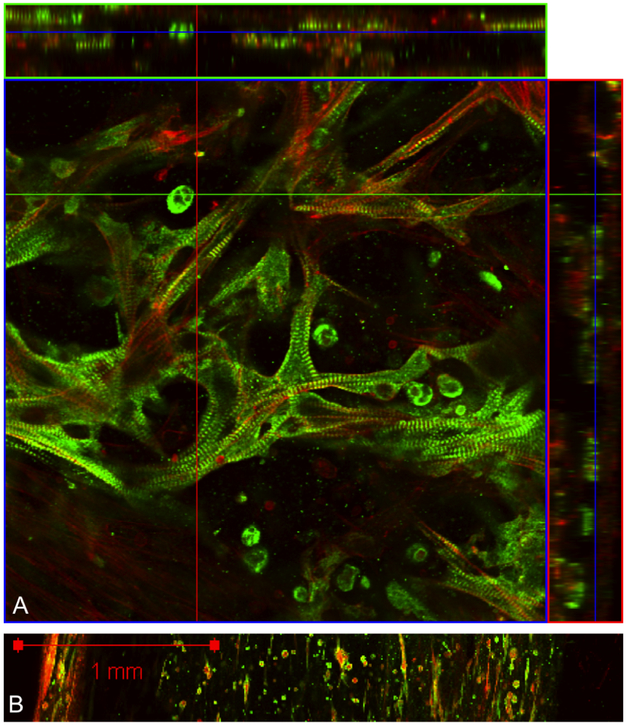
Immunofluoresence volume fraction analysis was performed at each point of testing, as described previously.19 EHTs were fixed with 4% paraformaldehyde, and stained for titin (9D10, Developmental Studies Hybridoma Banke, University of Iowa) and F-actin (rhodamine-conjugated phalloidin). Titin staining marked the cardiomyocytes; the F-actin staining marked both cardiomyocytes and myofibroblasts. Each image was converted to a binary image, using as a threshold the grayscale intensity at which the histogram of grayscale intensity histogram showed maximum curvature. A volume fraction estimate was then made as:
| (1) |
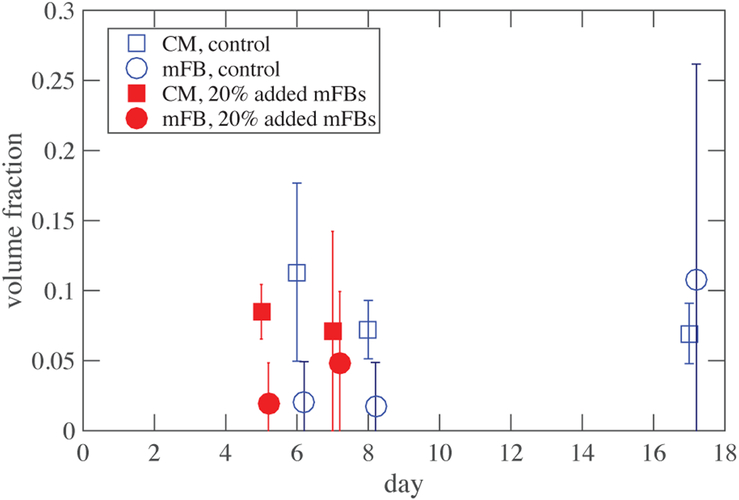
The myofibroblast volume fraction was taken as the difference between the volume fraction of all cells and the cardiomyocyte volume fraction. Figure 5A shows an example of the immunofluorescence staining. Many image stacks, totaling hundreds of images were acquired throughout each EHT and averaged to calculate the tissue’s volume fraction.
Figure 5:
Volume fraction of cardiomyocytes remained stable over time, while fibroblasts proliferated unevenly. Error bars represent range of scatter. Negative values (not shown) arose due to challenges associated with subtracting titin signals from actin signals.
Homogenization bounds and estimates
To test the hypothesis that myofibroblasts acted as passive resistors and evaluate the consequences of this on conduction velocity, we explored Hashin-Shtrikman-type homogenization bounds.20 At the hierarchical level of cells, conduction velocity within and between cardiomyocytes was approximated as unchanged by the myofibroblasts. At the hierarchical level of EHTs, conduction velocity was modeled as being retarded due to obstruction by myofibroblasts that extended the path length traversed by the current. This retardation increased with the volume fraction of the myofibroblasts. For linear, isotropic materials within an ergodic system with strong conductivity contrast, the change in conduction velocity associated with myofibroblast overgrowth follows the change in conductivity of the EHT because both scale with conduction path length. Although EHT is an active material, passive theory proved sufficient to provide a first order estimate.
Harmonic and arithmetic bounds
We treated EHT as a multi-phase composite and used results from homogenization theory to interpret experimental observations. For application of homogenization theory, the contributions to conductivity were divided into those of the resistive, proliferating myofibroblasts, with conductivity σmFB, and the homogenized contributions of cardiomyocytes and collagen, with conductivity σ0. The contributions of collagen to conduction are relatively minor21. The aim was to develop bounds for the effective properties of the EHT as a function of the myofibroblast volume fraction, φ, and to determine from deviations from these bounds how cross-scale contributions of myofibroblasts affected EHT function. As a first order approximation, we treated the remodeling process as simply compressing the collagen; mechanical tests on fibroblast populated collagen tissue constructs indicates that this is accurate at lower myofibroblast volume fractions22,23. The data revealed that the combination of cell death and remodeling yielded a cardiomyocyte volume fraction that did not vary signficantly over time from ϕCM = 0.08. Therefore, the conductivity σ0 corresponded to the conductivity of EHT in the absence of myofibroblasts.
The simplest bounds, based upon one-point correlation functions, rely only upon arithmetic (Equation 3) and harmonic (Equation 2) averages of conductivity and include only volume fractions of each material and their conductivities20:
| (2) |
| (3) |
The arithmetic average, (Eq. 3), approximates a parallel, layered arrangement of the materials and tends to overestimate the effective property. It therefore serves as an upper bound. The harmonic average, (Eq. 2), approximates a series, layered arrangement of the materials and tends to underestimate the effective property. It therefore serves as a lower bound20. In general, the effective properties of random heterogeneous materials lie somewhere between these one-point bounds
Hashin-Shtrikman bounds
Correlation functions that describe the material microstructure statistically improve upon the one-point bounds. Hashin and Shtrikman developed the best possible bounds given only volume fraction information by incorporating two-point correlation functions.24 For anisotropic and structured solids, these can be improved upon further20,25,26. Although derived using two-point correlation functions, only volume fractions and conductivities appear because, for isotropic media, the two-point correlation functions depend only upon volume fractions. Thus, for a 2D solid:
| (4) |
| (5) |
where
| (6) |
and
| (7) |
Results
Volume fractions
The specimens all shrank over time as myofibroblasts proliferated and remodeled the collagen ECM. Despite this, cardiomyocyte population showed no statistically significant trends over time, indicating that some fraction of the cardiomyocytes died and disappeared from the EHT as the EHT shrank. The mean cardiomyocyte volume fraction was ϕCM =0.08. Both the myofibroblast-enhanced and control EHTs displayed variation in their cellular composition, both within individual specimens and between specimens (Figure 7). The myofibroblast population increased over time in all EHT specimens (Figure 5).
Figure 7:
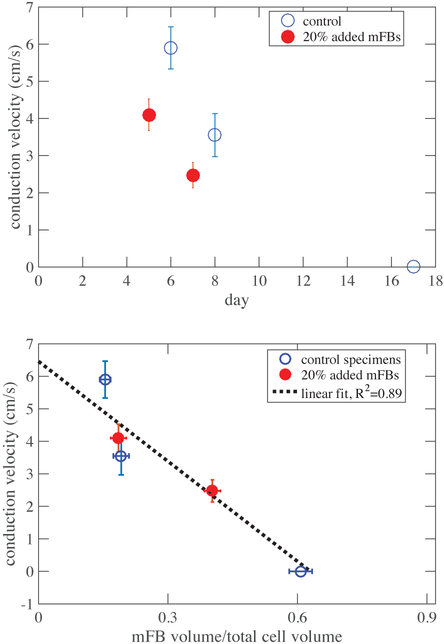
Top: Conduction velocity declined over time as myofibroblasts proliferated though the EHT. Decline occurred at approximately the same rate for both control and treatment groups, but began earlier in the specimens with added myofibroblasts. Error bars indicate standard deviation in impulse conduction velocity. Bottom: Data collapsed onto a single linear trendline when renormalized against myofibroblast fraction. Error bars indicate standard deviation in impulse conduction velocity. Error bars indicate standard deviation in impulse conduction velocity (y-axis) and standard error of the mean distribution of myofibroblast concentration (x-axis).
Conduction velocities
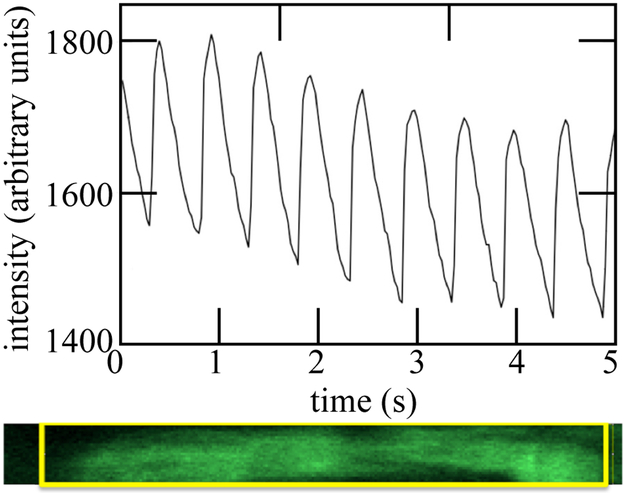
Staining with Fluo-2 clearly revealed cellular calcium transients. These impulse conduction velocities were highly consistent from beat to beat in paced EHTs, as measured using fluorescence imaging of the calcium transient. These could be resolved for individual cardiomyocytes, which displayed responses as in Figure 6. The peak and trough of each successive peak decayed due to photobleaching.
Figure 6:
A transient calcium response of a single cardiomyocyte within an EHT specimen, shown in the lower panel, revealed regular oscillation convoluted with signal attenuation due to photobleaching. The intensity reported was that of the region of interest within the box shown in the lower panel.
Conduction velocities decreased with increased myofibroblast concentration (volume of myofibroblasts/total cell volume) in both myofibroblast-enhanced and control tissues (Figure 7). Enhanced tissues were tested on days 5 and 7; control tissues were tested on days 6, 8, and 17. Conduction velocity of the myofibroblast-enhanced EHTs decreased earlier than that of the control EHTs, falling below 3 cm/s by day 7. By day 17, approximately 45% of the cells in the control EHT were non-cardiomyocytes, and the EHT displayed no detectable calcium transient; conduction velocity was therefore considered to be 0.
Discussion
In both control EHTs, initially populated predominantly with cardiomyocytes, and EHTs populated with cardiomyocytes and additional myofibroblasts, impulse conduction velocity slowed over time as the course of EHT remodeling progressed (Figure 7, upper panel). We note that the nature of this remodeling is a continued source of uncertainty (cf.27–29). Both control EHTs and those augmented by additional myofibroblasts contained a baseline level of non-cardiomyocyte cells. Based upon the observations it seems clear that the remodeling effects of these “endogenous” cells were outweighed by the added myofibroblasts in the augmented EHTs. In the control EHTs, however, the non-cardiomyocyte cells are likely to have contributed substantially to remodeling, delayed though it was relative to that in the augmented cultures. Nevertheless, we do not have certain knowledge that even in the control EHTs it was these non-cardiomyocytes that dominated the slower remodeling, and it is also possible that cardiomyocytes did some of the remodeling.
The time decay of impulse conduction velocity appeared to be approximately the same for the treatment and control groups, but were offset by several days. However, as expected from homogenization theory, the data collapsed onto a single trend when plotted against the composition of the EHT. The trend was nearly linear when plotted as a function of myofibroblast ratio Θ, derived from cardiomyocyte and myofibroblast volume fractions ϕCM and ϕmFB that were estimated from immunohistological staining:
| (8) |
Note that the cardiomyocyte volume fraction, ϕCM, did not change signifianctly from approximately 0.08 over time, while the myofibroblast cell concentration ϕmFB showed a proportionally larger rise. Impulse conduction velocity appeared at first glance to decrease linearly with Θ (R2=0.89) down to a complete cessation at about Θ=0.63 (Figure 7, lower panel).
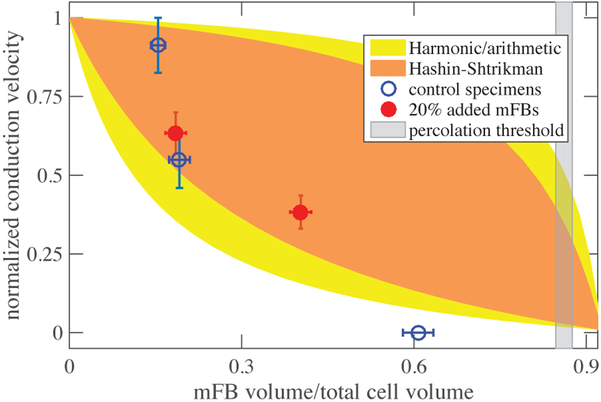
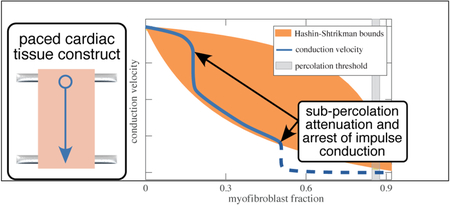
Upon interpretation through the lens of homogenization bounds, a more detailed story arose. In many two-phase composites, as one phase supplants another, many behaviors transition at the steric or rigid percolation threshold from following upper to lower Hashin-Shtrikman bounds, including composite stiffness30–34, and conduction20. In the results of our experiments, the expected drop was observed from the upper to lower Hashin-Shtrikman bound on conductance, which, as described in the methods section, provides a reasonable approximation of conduction velocity for the conditions of EHT. However, the effect occurred at a value of myofibroblast fraction Θ that was substantially below the percolation threshold (gray band, Figure 8).
Figure 8:
The observed decline in impulse conduction velocity with increasing myofibroblast concentration fell from the upper to lower Hashin-Shtrikman bound at a concentration far below the percolation threshold. At sufficiently high volume fraction, impulse conduction ceased.
How do myofibroblasts cause such substantial change to conduction velocity at volume fractions so far below percolation? From the mechanical perspective, myofibroblasts seemingly seek percolation by proliferating or dying off23,35, and by exploiting the fibrous nature of collagenous ECM, which enables cells to form mechanical connections at volume fractions far below what would be predicted by neo-Hookean elastic treatments of the ECM29,36–38. The ECM also adapts viscoelastically to enable cell-cell communication across long distances39,40. Myofibroblasts respond to mechanical perturbations in a way that causes alignment at the cell level that furthers mechancial communication41–46. However, the fibrous collagen ECM is believed to have relatively little capacitance21, and the search for the source of the surprisingly rapid drop in conduction velocity must therefore focus on direct interactions between myofibroblasts and cardiomyocytes.
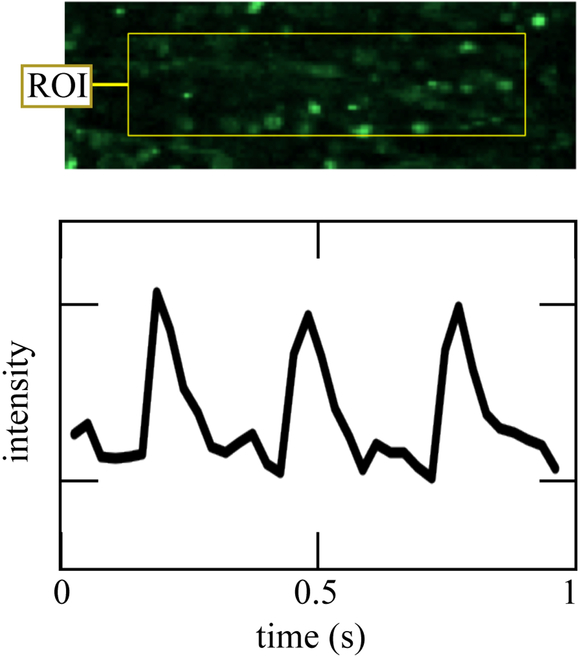
Both macrostructural and microscale factors warrant further scrutiny. At the macroscale, some evidence was evident of isolated groups of cells forming networks independent of those of the larger EHT structure. In some regions of tissue, alternans, series of heartbeats with alternating amplitude, were evident, as shown by a single-cell calcium transient revealing alternating amplitudes of the calcium transient from beat to beat (Figure 9).47 Formation of pockets of isolated electrical networks as well as spontaneous beating have been predicted by two-dimensional theoretical models of fibrotic heart tissue48 and our observations confirm that this is a potential source of cardiac dysfunction at volume fraction of myofibroblasts far below the percolation threshold.
Figure 9:
Fluo-2 recording of a single cell’s calcium transient at 40 fps revealed possible alternans. This rare event, first predicted by48, is an example of a local interaction phenomena that can explain the large effect of myofibroblasts relative tho their volume fraction.
At the level of cell-cell interactions, the literature shows that myofibroblasts can have a range of effects on the electrophysiological responses of cardiomyocytes, including both lengthening and shortening action potential duration49,50. Substantial perturbation of action potential duration would be expected to interfere with conduction velocity. Our data show clearly that myofibroblasts always slow conduction velocity, meaning that cell-cell interactions are likely secondary to structural considerations in determining the effects of myofibroblasts on conduction velocity in EHTs. The structural effects considered here arose from the spatial distribution of myofibroblasts and cardiomyocytes within the EHT. In this context, models such as those of Xie et al.51 that account for the architecture of a tissue are at least as important as those that account only for the direct vicinity of a single cardiomyocyte when determining roles of myofibrobalsts on cardiac tissue electrophysiology49,50.
Myofibroblast proliferation can account for the increased myofibroblast volume fractions in both the enhanced and control sets of tissues. Possible explanations for the slight decrease in cardiomyocyte volume fractions include cell death needed to reach a target concentration of cells and starvation due to tissue remodeling and compression that restricted the permeation of oxygen and nutrients into the EHT. It is also possible that compaction of cardiomyocytes into myfibrils, rather than cell death, contributes to the decrease in cardiomyocyte volume. Due to the low concentrations of cells and the large variation in cell type and density within EHT specimens, obtaining accurate estimates of cardiomyocyte and myofibroblast volume fractions proved difficult. The estimation technique used in these experiments was sufficient for correlation with conduction velocity, but future studies would benefit from more refined measurements of EHT volume fractions.
This method of measuring conduction velocity was designed to overcome imaging limitations. The impulse conduction velocity estimates obtained were sufficient to allow insight into the electrophysiological effects of myofibroblasts in EHTs, but full-specimen impulse mapping would allow future studies to obtain more accurate and detailed results. Such mapping has been achieved in cardiac monolayers52 and in native heart tissue.53 Combination of these mapping techniques with 3D EHT constructs would yield a very powerful tool for experimental modeling of cardiomyopathy.
Conclusions
In EHT constructs prepared both with and without the addition of myofibroblasts, myofibroblast volume fractions increased over time, while cardiomyocyte volume fractions decreased. By measuring the impulse conduction velocity of EHTs at different stages of culture, we were therefore able to directly compare conduction velocity to the myofibroblast volume fraction. Conduction velocity was found to decrease with increasing myofibroblast concentration, dropping precipitously long before the myofibroblast concentration reached the steric percolation threshold, and ceasing before streric percolation. These findings were explained to some degree through homogenization theory showing a drop from a Hashin-Shtrikman upper bound to a Hashin-Shtrikman lower bound with increasing myofibroblast volume fraction, and indicating effects of a lengthening of conduction path due to myofibroblast overgrowth. However, when interpreted in the context of these multiscale models it was clear that the myofibroblasts affected conduction velocity substantially long before the steric percolation threshold was reached. Cell-cell interactions not modeled using the passive homogenization theory approaches might be a factor. The behaviors observed outside of homogenization bounds shows that at high volume fraction of myofibroblasts either cell-cell interactions or a lack of connectivity amongst cardiomyocytes dominates electrophysiological responses. Results highlight the role of structural effects in addition to cell-cell local interactions in determining the effects of myofibroblasts on cardiac tissues, and suggest that 3-D EHT constructs provide a robust experimental model for electrophysiological studies of cardiomyopathy.
Advancement of this experimental approach will require improvements in imaging techniques so as to enable high-speed optical mapping of larger regions of tissue. Whole-tissue mapping will yield a greater level of detail and allow more specific insight into myofibroblasts effects on cardiac impulse conduction. However, even at this stage, results point to a critical role for the spatial structure of myofibroblasts in determining their contributions to fibrotic cardiomyopathy.
Supplementary Material
Figure 4:
A. A representative immunofluorescence image with orthogonal view sliced from left to right (top) and top to bottom (right). Cardiomyocytes are stained for titin (green), cardiomyocytes and myofibroblasts are stained for F-actin (red). B. A tile scan across an entire tissue reveals large variation in cell type and density.
Acknowledgement
Financial support for this work has been provided by the NIH through grant R01HL109505, and by the NSF through graduate research fellowship DGE-1143954 to TMS and grant CMMI 1548571.
References
- (1).Weber KT; Sun Y; Bhattacharya SK; Ahokas RA; Gerling IC Myofibroblast-mediated mechanisms of pathological remodelling of the heart. Nature Reviews Cardiology 2013,10, 15–26. [DOI] [PubMed] [Google Scholar]
- (2).Berk BC; Fujiwara K; Lehoux S ECM remodeling in hypertensive heart disease. The Journal of clinical investigation 2007,117, 568–575. [DOI] [PMC free article] [PubMed] [Google Scholar]
- (3).Rohr S Myofibroblasts in diseased hearts: new players in cardiac arrhythmias? Heart Rhythm 2009, 6, 848–856. [DOI] [PubMed] [Google Scholar]
- (4).Smaill BH; Zhao J; Trew ML Three-Dimensional IMpulse Propagation in Myocardium: Arrhythmogenic Mechanisms at the Tissue Level. Circulation Research 2013,112, 831–833. [DOI] [PubMed] [Google Scholar]
- (5).Miragoli M; Gaudesius G; Rohr S Electrotonic modulation of cardiac impulse conduction by myofibroblasts. Circulation Research 2006, 98, 801–810. [DOI] [PubMed] [Google Scholar]
- (6).Rohr S Arrhytmogenic Implications of Fibroblast-Myocyte Interactions. Circulation: Arrhythmia and Electrophysiology 2012, 5, 442–452. [DOI] [PubMed] [Google Scholar]
- (7).Chilton L; Giles WR; Smith GL Evidence of intercellular coupling between co-cultured adult rabbit ventricular myocytes and myofibroblasts. Journal of Physiology 2007, 583, 225–236. [DOI] [PMC free article] [PubMed] [Google Scholar]
- (8).Thompson SA; Copeland CR; Reich DH; Tung L Mechanical coupling between myofibroblasts and cardiomyocytes slows electric conduction in fibrotic cell monolayers. Circulation 2011,123, 2083–2093. [DOI] [PMC free article] [PubMed] [Google Scholar]
- (9).Gaudesius G; Miragoli M; Thomas SP; Rohr S Coupling of cardiac electrical activity over extended distances by fibroblasts of cardiac origin. Circulation Research 2003, 93, 421–428. [DOI] [PubMed] [Google Scholar]
- (10).Glukhov AV; Federov VV; Kalish PW; Ravikumar VK; Lou Q; Janks D; Schuessler RB; Moazami N; Efimov IR Conduction Remodeling in Human End-Stage Nonischemic Left Ventricular Cardiomyopathy. Circulation 2012,125, 1835–1847. [DOI] [PMC free article] [PubMed] [Google Scholar]
- (11).Asnes CF; Marquez JP; Elson EL; Wakatsuki T Reconstitution of the frankstarling mechanism in engineered heart tissues. Biophysical Journal 2006, 91, 1800–1810. [DOI] [PMC free article] [PubMed] [Google Scholar]
- (12).Eschenhagen T; Fink C; Remmers U; Scholz H; Wattchow J; Weil J; Zimmerman W; Dohmen HH; Schafer H; Bishopric N; Wakatsuki T; Elson EL Three-dimensional reconstitution of embryonic cardiomyocytes in a collagen matrix: a new heart muscle model system. The FASEB Journal 1997,11, 683–94. [DOI] [PubMed] [Google Scholar]
- (13).Yankeelov TE; An G; Saut O; Luebeck EG; Popel AS; Ribba B; Vicini P; Zhou X; Weis JA; Ye K; M GG Multi-scale Modeling in Clinical Oncology: Opportunities and Barriers to Success. Annals of Biomedical Engineering 2016, 44, 2626–2641. [DOI] [PMC free article] [PubMed] [Google Scholar]
- (14).Elson EL; Genin GM Tissue constructs: platforms for basic research and drug discovery. Interface focus 2016, 6, 20150095. [DOI] [PMC free article] [PubMed] [Google Scholar]
- (15).Katare RG; Ando M; Kakinuma Y; Sato T Engineered Heart Tissue: A Novel Tool to Study the Ischemic Changes of the Heart In Vitro. PLOS ONE 2010, 5, e9275. [DOI] [PMC free article] [PubMed] [Google Scholar]
- (16).Sondergaard CS; Mathews G; Wang L; Jeffreys A; Sahota A; Wood M; Ripplinger CM; Si M-S Contractile and Electrophysiologic Characterization of Optimized Self-Organizing Engineered Heart Tissue. The Annals of Thoracic Surgery 2012, 94, 1241–1249. [DOI] [PMC free article] [PubMed] [Google Scholar]
- (17).Efimov IR; Nikolski VP; Salama G Optical Imaging of the Heart. Circulation Research 2004, 95, 21–23. [DOI] [PubMed] [Google Scholar]
- (18).Genin GM; Abney TM; Wakatsuki T; Elson EL Mechanobiology of Cell-Cell and Cell-Matrix Interactions; Springer, 2011; pp 75–103. [Google Scholar]
- (19).Asnes CF; Marquez JP; Elson EL; Wakatsuki T Reconstitution of the frankstarling mechanism in engineered heart tissues. Biophysical Journal 2006, 91, 1800–1810. [DOI] [PMC free article] [PubMed] [Google Scholar]
- (20).Torquato S Random heterogeneous materials: microstructure and macroscopic properties; Springer Science & Business Media, 2013; Vol. 16. [Google Scholar]
- (21).Bardelmeyer G Electrical conduction in hydrated collagen. I. Conductivity mechanisms. Biopolymers 1973,12, 2289–2302. [DOI] [PubMed] [Google Scholar]
- (22).Marquez JP; Genin GM; Pryse KM; Elson EL Cellular and matrix contributions to tissue construct stiffness increase with cellular concentration. Annals of biomedical engineering 2006, 34, 1475–1482. [DOI] [PMC free article] [PubMed] [Google Scholar]
- (23).Marquez JP; Elson EL; Genin GM Whole cell mechanics of contractile fibroblasts: relations between effective cellular and extracellular matrix moduli. Philosophical Transactions of the Royal Society of London A: Mathematical, Physical and Engineering Sciences 2010, 368, 635–654. [DOI] [PMC free article] [PubMed] [Google Scholar]
- (24).Hashin Z; Shtrikman S Conductivity of polycrystals. Physical Review 1963,130, 129. [Google Scholar]
- (25).Genin GM; Birman V Micromechanics and structural response of functionally graded, particulate-matrix, fiber-reinforced composites. International journal of solids and structures 2009, 46,2136–2150. [DOI] [PMC free article] [PubMed] [Google Scholar]
- (26).Saadat F; Birman V; Thomopoulos S; Genin GM Effective elastic properties of a composite containing multiple types of anisotropic ellipsoidal inclusions, with application to the attachment of tendon to bone. Journal of the Mechanics and Physics of Solids 2015, 82, 367–377. [DOI] [PMC free article] [PubMed] [Google Scholar]
- (27).Gyoneva L; Hovel C; Pewowaruk R; Dorfman K; Segal Y; Barocas V Cell-matrix interaction during strain-dependent remodeling of simulated collagen networks. Interface focus 2015, [DOI] [PMC free article] [PubMed] [Google Scholar]
- (28).Barocas VH; Moon AG; Tranquillo RT The fibroblast-populated collagen microsphere assay of cell traction forceÂŮPart 2: Measurement of the cell traction parameter. Journal of biomechanical engineering 1995,117, 161–170. [DOI] [PubMed] [Google Scholar]
- (29).Abhilash A; Baker BM; Trappmann B; Chen CS; Shenoy VB Remodeling of fibrous extracellular matrices by contractile cells: predictions from discrete fiber network simulations. Biophysical journal 2014,107, 1829–1840. [DOI] [PMC free article] [PubMed] [Google Scholar]
- (30).Liu Y; Thomopoulos S; Chen C; Birman V; Buehler MJ; Genin GM Modelling the mechanics of partially mineralized collagen fibrils, fibres and tissue. Journal of The Royal Society Interface 2014,11, 20130835. [DOI] [PMC free article] [PubMed] [Google Scholar]
- (31).Oyen ML; Ferguson VL; Bembey AK; Bushby AJ; Boyde A Composite bounds on the elastic modulus of bone. Journal of biomechanics 2008, 41, 2585–2588. [DOI] [PubMed] [Google Scholar]
- (32).Marquez JP; Genin GM; Zahalak GI; Elson EL The relationship between cell and tissue strain in three-dimensional bio-artificial tissues. Biophysical journal 2005, 88, 778–789. [DOI] [PMC free article] [PubMed] [Google Scholar]
- (33).Marquez JP; Genin GM; Zahalak GI; Elson EL Thin bio-artificial tissues in plane stress: the relationship between cell and tissue strain, and an improved constitutive model. Biophysical journal 2005, 88, 765–777. [DOI] [PMC free article] [PubMed] [Google Scholar]
- (34).Genin GM; Kent A; Birman V; Wopenka B; Pasteris JD; Marquez PJ; Thomopoulos S Functional grading of mineral and collagen in the attachment of tendon to bone. Biophysical journal 2009, 97, 976–985. [DOI] [PMC free article] [PubMed] [Google Scholar]
- (35).Genin GM; Elson EL Mechanics of cell-seeded ECM scaffolds. Cell and Matrix Mechanics 2014, 173. [Google Scholar]
- (36).Baker BM; Trappmann B; Wang WY; Sakar MS; Kim IL; Shenoy VB;Burdick JA; Chen CS Cell-mediated fibre recruitment drives extracellular matrix mechanosensing in engineered fibrillar microenvironments. Nature materials 2015, [DOI] [PMC free article] [PubMed] [Google Scholar]
- (37).Rowe RA; Pryse KM; Asnes CF; Elson EL; Genin GM Collective matrix remodeling by isolated cells: Unionizing home improvement do-it-yourselfers. Biophys. J 2015, 108, 2611–2612. [DOI] [PMC free article] [PubMed] [Google Scholar]
- (38).Wang H; Abhilash A; Chen CS; Wells RG; Shenoy VB Long-range force transmission in fibrous matrices enabled by tension-driven alignment of fibers. Biophysical journal 2014, 107, 2592–2603. [DOI] [PMC free article] [PubMed] [Google Scholar]
- (39).Babaei B; Davarian A; Pryse KM; Elson EL; Genin GM Efficient and optimized identification of generalized Maxwell viscoelastic relaxation spectra. Journal of the mechanical behavior of biomedical materials 2015, 55, 32–41. [DOI] [PMC free article] [PubMed] [Google Scholar]
- (40).Babaei B; Davarian A; Lee S-L; Pryse KM; McConnaughey WB; Elson EL; Genin GM Remodeling by fibroblasts alters the rate-dependent mechanical properties of collagen. Acta biomaterialia 2016, 37, 28–37. [DOI] [PMC free article] [PubMed] [Google Scholar]
- (41).Kaunas R; Hsu H-J A kinematic model of stretch-induced stress fiber turnover and reorientation. Journal of theoretical biology 2009, 257, 320–330. [DOI] [PubMed] [Google Scholar]
- (42).Elson E; Genin G The role of mechanics in actin stress fiber kinetics. Experimental cell research 2013, 319, 2490–2500. [DOI] [PMC free article] [PubMed] [Google Scholar]
- (43).Lee S-L; Nekouzadeh A; Butler B; Pryse KM; McConnaughey WB; Nathan AC; Legant WR; Schaefer PM; Pless RB; Elson EL; Genin GM Physically-induced cytoskeleton remodeling of cells in three-dimensional culture. PloS one 2012, 7, e45512. [DOI] [PMC free article] [PubMed] [Google Scholar]
- (44).McGarry J; Fu J; Yang M; Chen C; McMeeking R; Evans A; Deshpande V Simulation of the contractile response of cells on an array of micro-posts. Philosophical Transactions of the Royal Society of London A: Mathematical, Physical and Engineering Sciences 2009, 367, 3477–3497. [DOI] [PMC free article] [PubMed] [Google Scholar]
- (45).Ronan W; Deshpande VS; McMeeking RM; McGarry JP Cellular contractility and substrate elasticity: a numerical investigation of the actin cytoskeleton and cell adhesion. Biomechanics and modeling in mechanobiology 2014, 13, 417–435. [DOI] [PubMed] [Google Scholar]
- (46).Shenoy VS A free energy based approach to model durotaxis and extracellular stiffness-dependent contraction and polarization of cells. Interface Focus 2015, 0, 0–1. [DOI] [PMC free article] [PubMed] [Google Scholar]
- (47).Rosenbaum DS; Jackson LE; Smith JM; Garan H; Ruskin JN; Cohen RJ Electrical Alternans and Vulnerability to Ventricular Arrhythmias. New England Journal of Medicine 1994, 330, 235–241. [DOI] [PubMed] [Google Scholar]
- (48).Xie Y; Garfinkel A; Weiss J; Qu Z Cardiac alternans induced by fibroblast-myocyte coupling: mechanistic insights from computational models. American Journal of Physiology-Heart and Circulatory Physiology 2009, 297, H775. [DOI] [PMC free article] [PubMed] [Google Scholar]
- (49).MacCannell K; Bazzazi H; Chilton L; Shibukawa Y; Clark R; Giles W A mathematical model of electrotonic interactions between ventricular myocytes and fibroblasts. Biophysical journal 2007, 92, 4121–4132. [DOI] [PMC free article] [PubMed] [Google Scholar]
- (50).Sachse FB; Moreno AP; Abildskov J Electrophysiological modeling of fibroblasts and their interaction with myocytes. Annals of biomedical engineering 2008, 36, 41–56. [DOI] [PubMed] [Google Scholar]
- (51).Xie Y; Garfinkel A; Camelliti P; Kohl P; Weiss J; Qu Z Effects of fibroblast-myocyte coupling on cardiac conduction and vulnerability to reentry: a computational study. Heart Rhythm 2009, 6, 1641–1649. [DOI] [PMC free article] [PubMed] [Google Scholar]
- (52).Scull JA; McSpadden LC; Himel HD; Badie N; Bursac N Single-Detector Simultaneous Optical Mapping of Vm and [Ca2+]i in Cardiac Monolayers. Annals of Biomedical Engineering 2012, 40, 1006–1017. [DOI] [PMC free article] [PubMed] [Google Scholar]
- (53).Bachtel AD; Gray RA; Stohlman JM; Bourgeois EB; Pollard AE; Rogers JM A Novel Approach to Dual Excitation Ratiometric Optical Mapping of Cardiac Action Potentials With Di-4-ANEPPS Using Pulsed LED Excitation. IEEE Transactions on Biomedical Engineering 2011, 58, 2120–2126. [DOI] [PMC free article] [PubMed] [Google Scholar]
Associated Data
This section collects any data citations, data availability statements, or supplementary materials included in this article.


