

Abstract
We previously reported that near-infrared hyperspectral imaging enabled the localization of atherosclerotic plaques from outside the vessels, but not the optical characteristics of each histological component. Therefore, the near-infrared spectrum of each component was collected from the sliced section of the human carotid plaque obtained with endarterectomy and the optical characteristics were confirmed in several wavelengths. Based on this information, we assessed the diagnostic accuracy for ex vivo chemogram in each plaque component created with near-infrared spectroscopy (NIRS), using multiple wavelengths. The chemogram projected on the actual image of plaque was created based on light intensity and transmittance change at three wavelengths. The wavelengths that were mainly were 1440, 1620, 1730, and 1930 nm. We evaluated the accuracy of histological diagnosis in chemogram compared with pathological findings, analyzing interobserver agreement with κ-statistics. The chemograms that we created depicted the components of fibrous tissue, smooth muscle, lipid tissue, intraplaque hemorrhage, and calcification. Diagnostic odds ratio in each component was as follows: 259.6 in fibrous tissue, 144 in smooth muscle, 1123.5 in lipid tissue, 29.3 in intraplaque hemorrhage, and 136.3 in calcification. The κ-statistics revealed that four components, excluding intraplaque hemorrhage, had substantial or almost perfect agreement. Thus, this study demonstrated the feasibility of using chemogram focused on specific component during the histological assessment of atherosclerotic plaques, highlighting its potential diagnostic ability. Chemograms of various target components can be created by combining multiple wavelengths. This technology may prove to be useful in improving the histological assessment of plaque using NIRS.
Keywords: atherosclerosis, carotid plaque, carotid artery stenosis, near infrared spectroscopy, plaque imaging
Introduction
Carotid atherosclerotic disease, which is well known and common, causes transient ischemic attacks and strokes. Treatment strategy for carotid artery stenosis has been traditionally determined by assessing the degree of stenosis and the presence or absence of symptoms, according to the major criteria based on the results of North American Symptomatic Carotid Endarterectomy Trial.1) In recent years, however, vulnerabilities of atherosclerotic plaque such as thin fibrous cap and lipid rich necrotic core have been recognized as potential risk factors of ischemic stroke, regardless of the degree of stenosis.2–5) In coronary arteries, this vulnerability is reported to be related to plaque rupture and coronary events.6) Therefore, evaluation of plaque characteristics using intravascular ultrasound (IVUS), near-infrared spectroscopy (NIRS), and optical coherence tomography (OCT) has been actively conducted in the coronary circulation, indicating its usefulness.7–13) These devices can evaluate the detail of plaque morphology and location of lipid rich tissue.
Optical coherence tomography is an imaging method that allows the qualitative and morphological diagnosis of plaques.9,14) The high use of this imaging modality has been highlighted in previous studies. High-resolution OCT images reveal the fine structure of the plaque and stent surface, which is important when determining intraoperative therapeutic procedures. Thus, IVUS and OCT currently remain the gold standard for diagnostic imaging equipment for arteriosclerotic diseases. However, in contrast to these imaging modalities, despite its low resolution, NIRS has an excellent ability to detect lipid components.10,15,16) Thus, NIRS is useful for identifying the lipid-rich/necrotic core. Therefore, in this study, we also identified near-infrared spectral information of the aorta of WHHL rabbit using a diffuse-reflectance near-infrared hyperspectral imaging system. We then identified arteriosclerotic lesions from the extravascular, using a support vector machine that learned the near-infrared spectrum pattern.17) Given the instability of the plaque, the detection of lipid components is considered to be important. Acquisition of all the histological information constituting the plaque may therefore contribute to the prognostic prediction of plaque collapse by deepening pathological understanding.
The chemogram created by NIRS represents the probability of target component at the given position on the color scale.10,12) The target tissue indicated in the chemogram is mainly lipid-rich tissue. Chemograms that contain more histological information can provide better understanding of the characteristics of atherosclerotic plaques. Therefore, chemograms showing the distribution of various plaque components were created using combinations of several characteristic wavelengths, which were specific for each plaque component. The purpose of this study was to evaluate the diagnostic accuracy of ex vivo chemogram displaying various histological components by NIRS with multiple wavelengths, and assess the usefulness of this technique.
Materials and Methods
Carotid plaque specimens
Carotid plaque specimens of 27 patients, who underwent carotid endarterectomy, were used in this study. The institutional ethical review board approved this study and all patients provided informed consent. All carotid plaque specimens were stored frozen immediately after removal. The specimens were sectioned at a thickness of 50 μm; adjacent sections were used for pathological staining.
Details of the device and chemogram software with near-infrared spectroscopy using multi-wavelengths
The actual image and near-infrared spectral data were simultaneously measured from thin slice sections using a near-infrared camera (Fig. 1A). The created chemogram was projected onto the actual image to display the histological distribution. Our device used a supercontinuum light source (Sumitomo Electric Industries Ltd., Osaka) that had an effective wavelength range of 1200–2300 nm, a power of 0.1 W, and emitted light at a pulse width of 100 fs. Light that passed through the thin slice section was detected by a near-infrared camera (Xeva-2.5-320; SInfraRed Pte Ltd., Singapore), which had an imaging range of 5 mm vertically and 6 mm horizontally and an effective pixel number of 12,000, with 1 pixel corresponding to 50 × 50 μm2. The data acquired with this camera included an actual image at 100 × 120 pixels, with 12,000 values of optical information corresponding to each pixel. The imaging time was 1 min or less.
Fig. 1.

Principle for ex vivo chemogram creation. (A) A schematic diagram of our device is shown. The sample is irradiated with specific wavelength light from the supercontinuum light source, and the near-infrared light transmitted through the sample is photographed with an infrared camera. Information, including the actual images and transmitted light, are sent to the near-infrared image analysis workstation (NIRexe). (B) Example of a chemogram using saline and oleic acid. The probability of oleic acid (orange) and saline (green) were displayed in chemogram. Target components were illustrated with the distribution mapping (right) projecting the chemogram on to the actual image (left). (C) The interest wavelengths were set to 1620, 1720, and 1910 nm. In the near-infrared spectrum of oleic acid (orange), there was a decrease in transmittance at 1720 nm. At 1910 nm, transmittance was greatly decreased in the saline spectrum (green). Chemogram was created by illustrating the relative difference compared with transmittance at 1620 nm to the color scale.
The acquired optical data was analyzed and processed using NIRexe image generation software (Sumitomo Electric Industries Ltd., Osaka). In this software, three wavelengths specific to the target organization were selected. The designated color was assigned to each wavelength. The transmittance of interest wavelength was automatically calculated based on the spectral information of each pixel. The designated color of the wavelength observing the largest change in transmittance was displayed on the pixel. The relative change in transmittance at the specified wavelength was displayed as color scale in each pixel. The light intensity of the wavelength was also displayed as color scale by adjusting the threshold value of the designated color. Chemograms showing the distribution of various target components were created by combining wavelengths freely (Figs. 1B and 1C).
Wavelength setting for chemogram creation in each plaque component
Near-infrared spectrums classified by histological components of carotid plaque are illustrated in Fig. 2. In many of the spectrums, a remarkable reduction in the transmittance was observed at 1440 and 1930 nm, which could be attributed to the chemical composition of the hydroxyl group. Spectral analysis demonstrated that the mean transmittance of fibrous tissue at 1930 nm was 7.9% lower than in smooth muscle; thus, a difference in transmittance was observed between histological component. The transmittance reduction was also confirmed at 1730 and 2190 nm in the spectrum of lipid tissue and intraplaque hemorrhage (IPH). The specific attenuation of near-infrared light was due to the chemical composition of the methyl group. At 1730 nm, the mean transmittance reduction in lipid tissue was 6.1%. The 2190 nm wavelength was not used in this study due to a poor signal-to-noise (S/N) ratio. No specific change was observed in any component at 1620 nm. Thus, this wavelength was suitable for calculating the relative change in transmitted light. The notable attenuation of transmittance at all wavelengths was the only characteristics recognized in the spectrum of calcification.
Fig. 2.
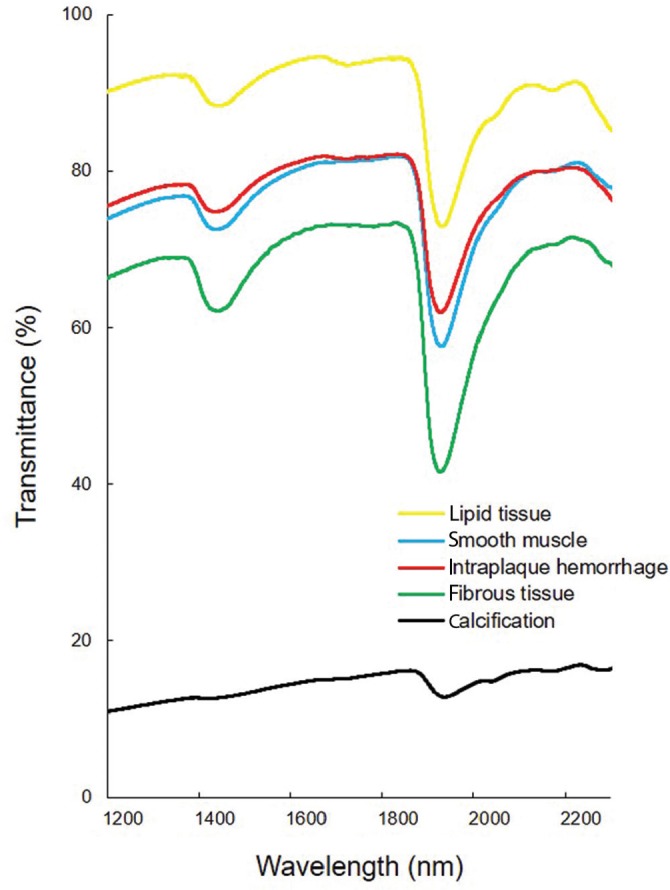
Near-infrared spectrums of each plaque component in carotid plaques. The near-infrared spectrums of five plaque components obtained by continuously plotting the mean transmittance were illustrated. Spectrometric measurements were performed by using VIR-9650 Fourier-transformed infrared spectrometer (Nihon Kohden Corp., Tokyo). Thin sliced sections of carotid plaques were measured in an isothermic environment at 36°C. The measured wavelengths ranged from 1200 to 2300 nm. Each measurement was made at 256 times of integration to minimize error. Based on the pathological findings, the region for measurement in each component was determined. The measurement range was set at 300 × 300 μm2.
Thus, these wavelengths could be used to create chemograms that distinguished the histological components in carotid plaques. Chemograms to distinguish between fibrous tissue and smooth muscle were created by setting the interest wavelengths at 1440, 1620, and 1930 nm. The transmittance difference at 1930 nm was particularly emphasized to represent the distribution of the two components. In lipid tissue, wavelengths at 1440, 1620, and 1730 nm were selected, and chemograms emphasizing the change in transmittance at 1730 nm, which mainly reflecting the lipid component, were created. The creation of chemograms of IPH was also focused on a transmittance at 1730 nm. The decrease in transmittance at 1930 nm was smaller than in lipid tissue. Thus, wavelengths at 1620 and 1930 nm were selected to examine the distinction between lipid tissue and IPH. During the preparation of calcification chemograms, the interest wavelength was set to 1440 nm alone. Further, the threshold of assigned color was adjusted to highlight the region with less intensity of near infrared light. In addition to the three selected wavelengths, near infrared light at 1260 nm was used to acquire the actual image projecting chemogram.
Evaluation of the diagnostic accuracy of chemograms
The distribution of the target component indicated in the chemogram was compared with the pathological findings adjacent to the sample, to evaluate the accuracy of the histological assessment obtained with NIRS using multi-wavelengths. Oil Red O, Masson trichrome, and Kossa staining were performed for pathological diagnosis of fibrous tissue, lipid tissue, IPH and calcification, respectively. The smooth muscle layer was identified by immunostaining of smooth muscle actin. In addition, histological diagnosis was conducted by 131 chemograms of designated lesions (i.e., fibrous tissue: 39, smooth muscle: 22, lipid tissue: 26, IPH: 27, and calcification: 17); the sensitivity, specificity, positive predictive value (PPV), and diagnostic odds ratio (DOR) were calculated. The consistency of histological diagnosis was evaluated using the κ-coefficient. Statistical analysis was performed with JMP ver.13.1.0 software (SAS Institute, Cary, NC, USA).
Results
Comparison between chemograms and pathological findings
Four chemograms representing histological components of carotid plaque created by our imaging device are shown in Figs. 3 and 4. Chemograms distinguishing fibrous tissue and smooth muscle highlighted the difference in transmittance at 1930 nm, and indicated the smooth muscle layer in green. The smooth muscle layer (in green) coincided with smooth muscle actin immunostaining (Figs. 3A–3C). In addition, some of the smooth muscle cells that migrated in the thickened intima were also depicted in green. Figures 3D and 3E show an image emphasizing the lipid component. The change in transmittance at 1730 nm, which was considered specific for the lipid component, is shown in red, while the one showing remarkable change at 1440 nm is displayed in yellow. The red area in the chemogram was consistent with lipid rich tissue indicated by Oil Red O staining. In the IPH image, the hemorrhagic lesion is set as red, while the region of fibrous tissue is depicted in yellow (Figs. 4A and 4B). Since the S/N ratio was poor in the IPH lesion, the contrast between red and yellow could not be clearly expressed. In addition, part of the IPH lesion, which is drawn in black, is the no-signal area due to a reduction in transmitted light. Masson trichrome staining showed an increase in cellular components due to bleeding in the no-signal area. In the calcification chemogram, we intentionally visualized the region where the transmittance was extremely low as an area in black (Figs. 4C and 4D). The calcified lesions indicated by Kossa staining were completely consistent with the no-signal area.
Fig. 3.

Chemogram and pathological images. (A)–(C) are images distinguishing between fibrous tissue and smooth muscle. (A) Actual image acquired at 1620 nm. (B) Chemogram (green: smooth muscle, white: fibrous tissue). (C) Immunostaining of α-smooth muscle actin. (D) and (E) are images distinguishing between lipid tissue and fibrous tissue. (D) Chemogram (red: lipid tissue, yellow: fibrous tissue). (E) Oil Red O stain.
Fig. 4.

Chemogram and pathological images. (A) and (B) are images distinguishing between lipid tissue and intraplaque hemorrhage. (A) Chemogram (red: intraplaque hemorrhage, yellow: lipid tissue). (B) Masson trichrome stain. (C) and (D) are images focused on calcification. (A) Chemogram (black: calcification). (B) Kossa stain.
Diagnostic accuracy of chemograms
Table 1 outlines the details of the diagnostic accuracy of each histological component, based on the diagnostic analysis of the chemograms by two physicians. Although high specificity was obtained in all tissue types, IPH showed low sensitivity. The PPV was high (80% or more) for fibrous tissue, smooth muscle, lipid tissue, and calcification (i.e., the PPVs were 92.1%, 84.2%, 91.3%, and 83.3%, respectively). Conversely, the PPV and accuracy value for IPH were 55.6% and 6.9%, respectively, which were overwhelmingly inferior to other components. The DOR of lipid tissue was extremely higher than in other tissues. In addition, the positive and negative likelihood ratios for the lipid tissue were 52.0 and 0.05, respectively, indicating that the lipid structure of the near-infrared image can be detected with high accuracy. In the consistency of histological diagnosis, fibrous tissue and lipid tissue acquired the evaluation for almost perfect agreement (κ = 0.87, 0.92). Substantial agreements were observed in smooth muscle tissue and calcification (κ = 0.79, 0.78). Only the IPH chemogram showed moderate agreement (κ = 0.49). The tendency of misdiagnosis was most often diagnosed as IPH by calcification. Further, there were several cases where it was difficult to distinguish between fibrous tissue and smooth muscle.
Table 1.
Evaluation for accuracy of ex vivo chemograms displaying each plaque component
| Histological classification | Sensitivity/Specificity (%) | Positive predictive value (%) | Diagnostic odds ratio (%) | κ-coefficient |
|---|---|---|---|---|
| Fibrous tissue | 94.7/89.7 | 92.1 | 259.6 | 0.87 |
| Smooth muscle tissue | 80/97.3 | 84.2 | 144 | 0.79 |
| Lipid tissue | 95.5/98.2 | 91.3 | 1123.5 | 0.92 |
| Intraplaque hemorrhage | 50/96.7 | 55.6 | 29.3 | 0.49 |
| Calcification | 78.9/97.3 | 83.3 | 136.3 | 0.78 |
Discussion
The purpose of intravascular imaging methods for atherosclerotic disease is the morphological and histological evaluation of atherosclerotic plaque and assessment for endovascular treatment. IVUS is a useful method for detecting vulnerable plaques, with published evidence from prospective studies.18,19) OCT is a novel imaging device with a resolution that is 10 times higher than that of IVUS. Many studies, which also obtained histological information about the plaques, reported that the clarification of the microstructure of plaque by OCT enabled the evaluation of detailed morphology.20–22) Generally, IVUS and OCT are excellent methods for the morphological evaluation of arteriosclerotic plaque. Conversely, morphological evaluation with NIRS is difficult because of its inferior resolution. However, NIRS is excellent for clinically detecting lipid cores that area associated with vulnerable plaques.12,15,16,23–26) In recent years, a novel catheter system combining the advantage of NIRS, with IVUS or OCT, has been tested in the coronary arteries of human cadavers.7,14) Treatment strategies based on histological risk assessment, rather than the rate of stenosis, aims to differentiate the risk stratification of patients who prefer endovascular treatment. This leads to a lower risk of intraoperative complications, such as distal embolism and improvement of the endovascular procedure. As a result of our study, it may be possible to add more detailed organization information to chemograms of NIRS. By showing fibrous tissue and the calcified component in addition to conventional lipid components, an improvement of the tissue diagnostic ability by NIRS can be expected. Moreover, by referring to tissue diagnosis by NIRS, we believe that it will be able to support the diagnosis given by OCT or IVUS and contribute to a major advancement of intravascular tissue imaging.
The evaluation of arteriosclerotic vessels by NIRS during direct vascular surgery has several uses. As shown in our previous studies, we have established a technique to identify plaques using reflected light from outside vessels.17) In this method, only lipids are targeted, but by complementing the missing tissue information in this study, more detailed vascular information can be provided to the surgeon. Although information on vascular lesions has been sufficiently obtained by preoperative image examinations, it is thought that obtaining vascular information in the range that was eroded during surgery in real-time leads to a safe judgment and treatment by the surgeon. Confirmation of the intravascular information exposed during carotid endarterectomy may be useful for determining the incision area of the vessel and the site of clip placement. Moreover, when clipping an intracranial aneurysm, if we can observe the arteriosclerotic plaque around the neck of the aneurysm, we think that it can be used to determine the placement position of the clip. We also believe that visualization of an atherosclerotic plaque around the neck of an aneurysm when clipping an intracranial aneurysm can be the basis for determining the position of the clip.
To specify the optical characteristics of atherosclerotic plaques, several studies performed spectroscopic analysis using the plaque section, which was similar to the methodology applied in this study.27,28) Using NIRS, Neumeister et al.29) demonstrated that the cholesterol content increased with an increase in fatty deposits, and showed the correlation between the thickness of fibrous caps and collagen content at the same sites. Furthermore, Wang et al.30) reported that irradiation of near infrared light at 2220–2330 nm was useful for identifying unstable plaques. The component distribution of plaque sections could be determined based on optical changes at specific wavelengths, according to the tissue type. Many reports have indicated that lipids can be distinguished based on changes in the light absorbance; our results also showed demonstrated the high capacity for lipid tissue detection. However, this study focused on differences in light absorption according to the hydroxyl groups. The reduction in transmittance at 1440 and 1930 nm due to the influence of hydroxyl groups can be observed in all living tissues. However, this property is a barrier to the application of this technique to living tissues. Analysis of the optical characteristics collected for each plaque component showed a difference in the transmittance attenuation caused by the hydroxyl groups, creating a chemogram displaying various tissues by emphasizing transmittance differences. However, since this optical information was based on thin sliced sections of plaque, the strong influence of hydroxyl groups in larger target tissues may complicate the detection of transmittance differences.
IPH is a histological feature deeply involved in the onset of sudden stroke.5) The display of this organization information in chemograms improves the quality of plaque evaluation. In this study, the diagnostic accuracy of IPH by optical information was remarkably low, and most IPHs were misdiagnosed as lipid tissue or calcification. We postulated that the signal of lipid tissue mixed in IPH was strongly depicted as the cause of the misdiagnosis. In addition, an increase in blood cell component caused the attenuation of transmittance due to scattering phenomenon, which caused many IPHs were misdiagnosed as calcification. This large attenuation of transmittance confounded the histological information displayed in the chemogram. Since the selected wavelength bands were similar to the characteristics of lipid tissue, it was necessary to specify more characteristic wavelengths by spectral analysis. The concurrent use of short wavelength light with high permeability was also examined. The characteristic absorption of hemoglobin has been confirmed in the short wavelength region (700–900 nm) of near-infrared light. Using this short wavelength band may improve the diagnostic capability of IPH.
Some limitations in our study must be noted. Manual operation was sometimes needed to correct the assigned color in chemogram creation. Thus, a standard algorithm for automatic color adjustment may need to be prepared. Further, currently only two kinds of tissue can be prepared with chemogram creating application. However, plaques can coexist in various tissue types, misleading of histological diagnosis. Moreover, since this study was an experimental system for thin sliced samples, the amount of transmitted light in larger target tissues is insufficient to accurately interpret the wavelength in which transmitted light and scattered light mix. Finally, the evaluation of diagnostic accuracy was performed by two neurosurgeons with knowledge of pathology and NIRS. Therefore, there is a possibility that the evaluation may have been influenced by diagnosis review bias.
Conclusion
Chemograms created by NIRS are a useful optical imaging method that provide detailed component information on arteriosclerotic plaque. It helps with the understanding of atherosclerotic disease and determining therapeutic strategies. We demonstrated the feasibility of displaying various kinds of plaque components as chemograms using the change of transmittance with multiple wavelengths in near-infrared light. This study was a fundamental assessment targeting thin slice sections of carotid plaque; further devices will be needed for its application to larger vessels. However, we suggest that this technique, using multiple specific wavelengths, may be able to further increase the histological information content of NIRS, contributing to an understanding of the atherosclerotic plaque condition.
Acknowledgments
The authors would like to thank Mr. Hiroshi Suganuma and Mr. Takuya Okuno from Sumitomo Electric Industries Ltd. for the technical support provided with the supercontinuum light source.
Footnotes
Sources of Funding
This study was supported by the Japanese Ministry of Education, Science, Sports, and Culture. This research was funded by a Grant-in-Aid for Scientific Research (Grant Number 24592123) and sponsored by Sumitomo Electric Industries, Ltd. The supercontinuum light source and software were provided by Sumitomo Electric Industries, Ltd.
Conflicts of Interest Disclosure
The authors declare that the article content was composed in the absence of any commercial or financial relationships that could be construed as a potential conflict of interest.
References
- 1).Barnett HJM, Taylor DW, Haynes RB, et al. North American Symptomatic Carotid Endarterectomy Trial Collaborators : Beneficial effect of carotid endarterectomy in symptomatic patients with high-grade carotid stenosis. N Engl J Med 325: 445–453, 1991 [DOI] [PubMed] [Google Scholar]
- 2).Sangiorgi G, Bedogni F, Sganzerla P, et al. : The Virtual histology In CaroTids Observational RegistrY (VICTORY) study: a European prospective registry to assess the feasibility and safety of intravascular ultrasound and virtual histology during carotid interventions. Int J Cardiol 168: 2089–2093, 2013 [DOI] [PubMed] [Google Scholar]
- 3).Wasserman BA, Wityk RJ, Trout HH, Virmani R: Low-grade carotid stenosis: looking beyond the lumen with MRI. Stroke 36: 2504–2513, 2005 [DOI] [PubMed] [Google Scholar]
- 4).Partovi S, Ghoshhajra BB, Walker TG: Beyond stenotic degree assessment in carotid atherosclerotic lesions: single catheter near-infrared spectroscopy and intravascular ultrasound. Int J Cardiovasc Imaging 32: 201–203, 2016 [DOI] [PubMed] [Google Scholar]
- 5).Turc G, Oppenheim C, Naggara O, et al. : Relationships between recent intraplaque hemorrhage and stroke risk factors in patients with carotid stenosis: the HIRISC study. Arterioscler Thromb Vasc Biol 32: 492–499, 2012 [DOI] [PubMed] [Google Scholar]
- 6).Schneiderman J, Wilensky RL, Weiss A, et al. : Diagnosis of thin-cap fibroatheromas by a self-contained intravascular magnetic resonance imaging probe in ex vivo human aortas and in situ coronary arteries. J Am Coll Cardiol 45: 1961–1969, 2005 [DOI] [PubMed] [Google Scholar]
- 7).Kang SJ, Mintz GS, Pu J, et al. : Combined IVUS and NIRS detection of fibroatheromas: histopathological validation in human coronary arteries. JACC Cardiovasc Imaging 8: 184–194, 2015 [DOI] [PubMed] [Google Scholar]
- 8).Costopoulos C, Brown AJ, Teng Z, et al. : Intravascular ultrasound and optical coherence tomography imaging of coronary atherosclerosis. Int J Cardiovasc Imaging 32: 189–200, 2016 [DOI] [PubMed] [Google Scholar]
- 9).Hoang V, Grounds J, Pham D, et al. : The role of intracoronary plaque imaging with intravascular ultrasound, optical coherence tomography, and near-infrared spectroscopy in patients with coronary artery disease. Curr Atheroscler Rep 18: 57, 2016 [DOI] [PubMed] [Google Scholar]
- 10).Horvath M, Hajek P, Stechovsky C, Honek J, Spacek M, Veselka J: The role of near-infrared spectroscopy in the detection of vulnerable atherosclerotic plaques. Arch Med Sci 12: 1308–1316, 2016 [DOI] [PMC free article] [PubMed] [Google Scholar]
- 11).Štěchovský C, Hájek P, Horváth M, Špaček M, Veselka J: Near-infrared spectroscopy combined with intravascular ultrasound in carotid arteries. Int J Cardiovasc Imaging 32: 181–188, 2016 [DOI] [PubMed] [Google Scholar]
- 12).Erlinge D: Near-infrared spectroscopy for intracoronary detection of lipid-rich plaques to understand atherosclerotic plaque biology in man and guide clinical therapy. J Intern Med 278: 110–125, 2015 [DOI] [PubMed] [Google Scholar]
- 13).Oemrawsingh RM, Cheng JM, García-García HM, et al. : Near-infrared spectroscopy predicts cardiovascular outcome in patients with coronary artery disease. J Am Coll Cardiol 64: 2510–2518, 2014 [DOI] [PubMed] [Google Scholar]
- 14).Fujii K, Hao H, Shibuya M, et al. : Accuracy of OCT, grayscale IVUS, and their combination for the diagnosis of coronary TCFA: an ex vivo validation study. JACC Cardiovasc Imaging 8: 451–460, 2015 [DOI] [PubMed] [Google Scholar]
- 15).Madder RD, Goldstein JA, Madden SP, et al. : Detection by near-infrared spectroscopy of large lipid core plaques at culprit sites in patients with acute ST-segment elevation myocardial infarction. JACC Cardiovasc Interv 6: 838–846, 2013 [DOI] [PubMed] [Google Scholar]
- 16).Madder RD, Husaini M, Davis AT, et al. : Detection by near-infrared spectroscopy of large lipid cores at culprit sites in patients with non-ST-segment elevation myocardial infarction and unstable angina. Catheter Cardiovasc Interv 86: 1014–1021, 2015 [DOI] [PubMed] [Google Scholar]
- 17).Chihara H, Oishi N, Ishii A, et al. : In vivo detection of atherosclerotic plaque using non-contact and label-free near-infrared hyperspectral imaging. Atherosclerosis 250: 106–113, 2016 [DOI] [PubMed] [Google Scholar]
- 18).Rogacka R, Latib A, Colombo A: IVUS-guided stent implantation to improve outcome: a promise waiting to be fulfilled. Curr Cardiol Rev 5: 78–86, 2009 [DOI] [PMC free article] [PubMed] [Google Scholar]
- 19).Jang JS, Song YJ, Kang W, et al. : Intravascular ultrasound-guided implantation of drug-eluting stents to improve outcome: a meta-analysis. JACC Cardiovasc Interv 7: 233–243, 2014 [DOI] [PubMed] [Google Scholar]
- 20).Yabushita H, Bouma BE, Houser SL, et al. : Characterization of human atherosclerosis by optical coherence tomography. Circulation 106: 1640–1645, 2002 [DOI] [PubMed] [Google Scholar]
- 21).Gnanadesigan M, Hussain AS, White S, et al. : Optical coherence tomography attenuation imaging for lipid core detection: an ex-vivo validation study. Int J Cardiovasc Imaging 33: 5–11, 2017 [DOI] [PMC free article] [PubMed] [Google Scholar]
- 22).Regar E, Gnanadesigan M, Van der Steen AF, van Soest G: Quantitative optical coherence tomography tissue-type imaging for lipid-core plaque detection. JACC Cardiovasc Interv 6: 891–892, 2013 [DOI] [PubMed] [Google Scholar]
- 23).Goldstein JA, Maini B, Dixon SR, et al. : Detection of lipid-core plaques by intracoronary near-infrared spectroscopy identifies high risk of periprocedural myocardial infarction. Circ Cardiovasc Interv 4: 429–437, 2011 [DOI] [PubMed] [Google Scholar]
- 24).Gardner CM, Tan H, Hull EL, et al. : Detection of lipid core coronary plaques in autopsy specimens with a novel catheter-based near-infrared spectroscopy system. JACC Cardiovasc Imaging 1: 638–648, 2008 [DOI] [PubMed] [Google Scholar]
- 25).Waxman S: Near-infrared spectroscopy for plaque characterization. J Interv Cardiol 21: 452–458, 2008 [DOI] [PubMed] [Google Scholar]
- 26).Waxman S, Dixon SR, L’Allier P, et al. : In vivo validation of a catheter-based near-infrared spectroscopy system for detection of lipid core coronary plaques: initial results of the SPECTACL study. JACC Cardiovasc Imaging 2: 858–868, 2009 [DOI] [PubMed] [Google Scholar]
- 27).Cassis LA, Lodder RA: Near-IR imaging of atheromas in living arterial tissue. Anal Chem 65: 1247–1256, 1993 [DOI] [PubMed] [Google Scholar]
- 28).Caplan JD, Waxman S, Nesto RW, Muller JE: Near-infrared spectroscopy for the detection of vulnerable coronary artery plaques. J Am Coll Cardiol 47: C92–C96, 2006 [DOI] [PubMed] [Google Scholar]
- 29).Neumeister V, Scheibe M, Lattke P, Jaross W: Determination of the cholesterol–collagen ratio of arterial atherosclerotic plaques using near infrared spectroscopy as a possible measure of plaque stability. Atherosclerosis 165: 251–257, 2002 [DOI] [PubMed] [Google Scholar]
- 30).Wang J, Geng YJ, Guo B, et al. : Near-infrared spectroscopic characterization of human advanced atherosclerotic plaques. J Am Coll Cardiol 39: 1305–1313, 2002 [DOI] [PubMed] [Google Scholar]