Abstract
Background
Compared with clinically functioning pituitary adenoma (FPA), clinically non-functioning pituitary adenoma (NFPA) lacks of detectable hypersecreting serum hormones and related symptoms which make it difficult to predict the prognosis and monitoring for postoperative tumour regrowth. We aim to investigate whether the expression of selected tumour-related proteins and clinical features could be used as tumour markers to effectively predict the regrowth of NFPA.
Method
Tumour samples were collected from 295 patients with NFPA from Beijing Tiantan Hospital. The expression levels of 41 tumour-associated proteins were assessed using tissue microarray analyses. Clinical characteristics were analysed via univariate and multivariate logistic regression analyses. Logistic regression algorithm was applied to build a prediction model based on the expression levels of selected proteins and clinical signatures, which was then assessed in the testing set.
Results
Three proteins and two clinical signatures were confirmed to be significantly related to the regrowth of NFPA, including cyclin-dependent kinase inhibitor 2A (CDKN2A/p16), WNT inhibitory factor 1 (WIF1), tumour growth factor beta (TGF-β), age and tumour volume. A prediction model was generated on the training set, which achieved a fivefold predictive accuracy of 81.2%. The prediction ability was validated on the testing set with an accuracy of 83.9%. The area under the receiver operating characteristic curves (AUC) for the signatures were 0.895 and 0.881 in the training and testing sets, respectively.
Conclusion
The prediction model could effectively predict the regrowth of NFPA, which may facilitate the prognostic evaluation and guide early interventions.
Electronic supplementary material
The online version of this article (10.1186/s12967-019-1915-2) contains supplementary material, which is available to authorized users.
Keywords: Clinically non-functioning pituitary adenoma, Regrowth, Predicting model
Background
Pituitary adenoma (PA) constitutes approximately 15% of all intracranial neoplasm [1]. NFPA is a special type of pituitary adenoma that generally shows no clinical symptoms such as serum hormone level elevation apart from mass effect, including visual disturbance, headache and various degree of hypopituitarism [2, 3]. Surgery is the first choice of treatment for most patients and no effective drugs can ameliorate its prognosis. However, about 12–58% of patients with macro-adenoma will experience tumour regrowth within 5 years even the tumour remnants was undetectable during surgery or on post-operation magnetic resonance imaging (MRI) [4]. However, we cannot currently predict which patients will experience tumour regrowth after surgery. Although radiotherapy is effective for the reduction of recurrence, the potential risk for hypopituitarism or optic nerve injury limits its application. Therefore, clinical or pathological parameters for predicting such regrowth behavior are of necessity.
Few systematic reports have discussed the prediction of the regrowth possibility of NFPA using statistical prediction models. In this study, we identified 41 key proteins whose expression were related to tumorigenesis and progression of pituitary adenoma. We then established a regrowth prediction model with two clinical signatures and three tumour-associated proteins whose expression levels were varied in NFPA. The main purpose of our study was to determine whether we could build a prediction model and validate its authenticity. Our study may facilitate the prognostic evaluation and early intervention to patients with NFPA.
Materials and methods
Patients selection
We retrospectively collected regrowth and non-regrowth tissue from 295 patients diagnosed with NFPA at Beijing Tiantan Hospital from April 2006 to September 2014. All patients were performed enhanced head MRI scan before and after surgery in order to assess tumour volume, Knosp classification and tumour resection grade. The minimum follow-up time was 36 months, and the average follow-up time was 86.5 months (range 36–137 months). Regrowth of NFPA was defined as a tumour maximum diameter increases from any direction on MRI of more than 2 mm from the day of surgery to follow-up endpoint with or without the reappearance of visual disturbance, headache or hypopituitarism.
Sample preparation
NFPA samples were stored and fixed in 10% neutral-buffered formalin immediately upon removal from the sellar region and then embedded in paraffin. Specimen slides stained with hematoxylin and eosin (H&E) were viewed by two different pathologists, who marked the tumour tissues on the samples.
Tissue microarray analyses
Two 2.0-mm diameter samples were removed then transferred to a recipient paraffin block to construct TMAs using a Tissue Array MiniCore 3 (ALPHELYS, Plaisir, France). Samples (4-µm thick) were obtained from each TMA with Leica Rotary Microtome RM2135 (Wetzlar, Germany). Immunohistochemical staining was performed on Leica BOND III automated system. All samples were pretreated in a 65 °C oven for 1.5 h. Staining was performed with dewaxing and epitope retrieval. Samples were blocked with peroxide solution for 7 min. Selected antibodies (shown in Additional file 1: Table S1) were used to incubate samples, followed by post-primary for 8 min, polymer for 8 min, diaminobenzidine (DAB) for 5 min, and hematoxylin counterstain for 2 min. Finally, the samples were dehydrated, cleared, then fixed with neutral resins. Stained samples were scanned with Leica Aperio AT2 scanner (400× magnification) and analysed by two different pathologists. Samples were scored as negative (0+), weak (1+), moderate (2+), and strong (3+) signal. The percentage of positivity was also calculated by two pathologists. The histological scores (H-Score) was calculated using following formula: H-Score = 0 × (percentage of negative) + 1 × (percentage of weak) + 2 × (percentage of moderate) + 3 × (percentage of strong). Thus, the H-Score ranges from 0 to 300 [5].
Statistical analyses
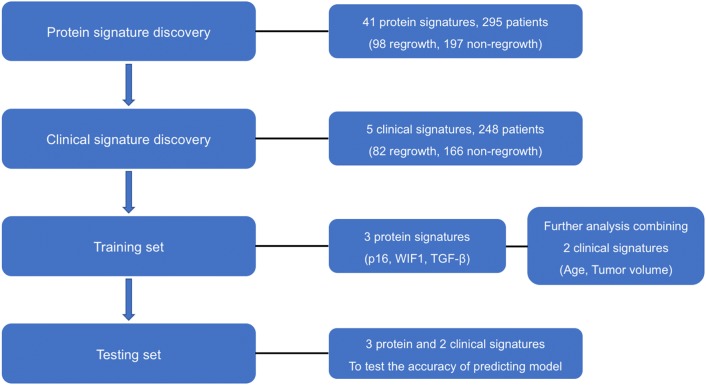
The flowchart of the study is shown in Fig. 1. For candidate protein signatures analyses, the differences in expression levels were evaluated with Wilcoxon–Mann–Whitney test. Kaplan–Meier analyses with two-sided log-rank test was used to determine the significance of the survival differences between the two groups, and hazard ratio (HR) was calculated using Cox proportional hazards regression model. The clinical characteristics were analysed with univariate and multivariate logistic regression analyses. Logistic regression algorithm was employed to develop the classification model. The prediction performance of the prediction model was evaluated in terms of the discriminatory accuracy in the training and testing set respectively. The discrimination performance of biomarkers for predicting the regrowth of NFPA was assessed by generating receiver operating characteristic (ROC) curve, the area under the ROC curve (AUC) was used to evaluate the classification performance. All statistical analyses and modeling were performed in R (version 3.1) and IBM SPSS Statistics for Windows, version 21.0. The differences were considered to be statistically significant for P < 0.05.
Fig. 1.
Flowchart of the study
Results
Discovering candidate protein signatures in tumour tissues
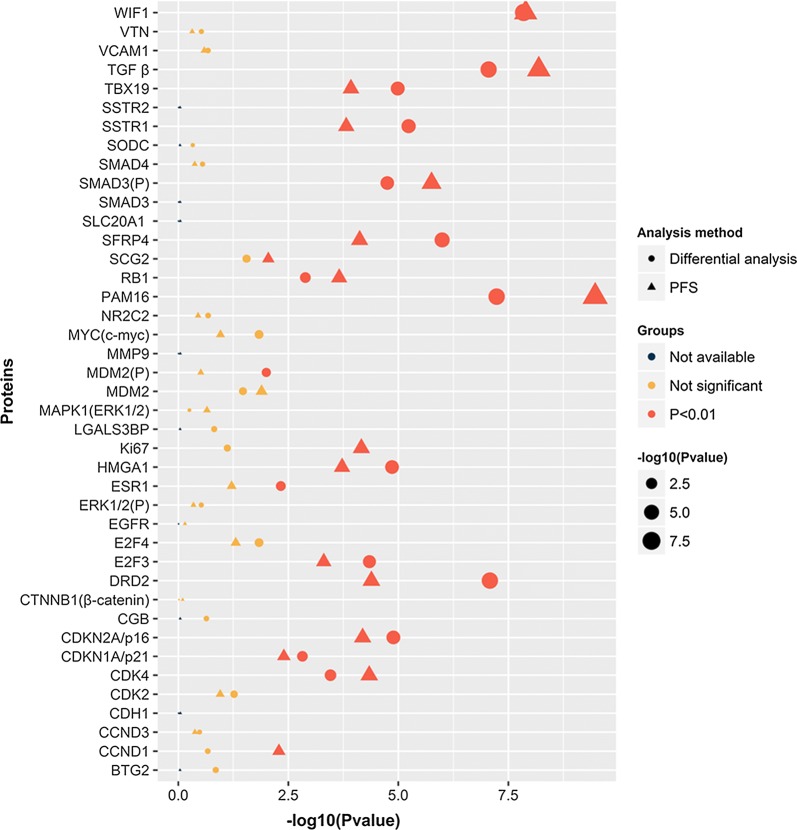
Tumour tissues from 295 cases including 98 regrowth patients and 197 non-regrowth patients were entered into this study. The expression levels of 41 tumour-related proteins in regrowth and non-regrowth tumour were determined via microarray analyses. We then compared the differential expression levels between the two groups, and selected 16 different proteins (presequence translocase-associated motor 16 [PAM16], TGF-β, WIF1, mothers against decapentaplegic homolog 3 [SMAD3(P)], Dopamine receptor D2 [DRD2], cyclin-dependent kinase 4 [CDK4], CDKN2A/p16, secreted frizzled-related protein 4 [SFRP4], T-box transcription factor [TBX19], somatostatin receptor 1 [SSTR1], high mobility group AT-hook 1 [HMGA1], retinoblastoma protein [RB1], E2F3, cyclin-dependent kinase inhibitor 1 [CDKN1A/p21], estrogen receptor 1 [ESR1], and mouse double minute 2 homolog [MDM2]) that were valuable (P < 0.01, Fig. 2). Meanwhile, in order to assess the associations between protein expression levels with regrowth, we performed Kaplan–Meier analyses to further identify whether there are possible candidates. The event endpoint was calculated from surgical resection to the date of the first regrowth. Patients are divided into 2 groups, low-expression group and high-expression group, according to the median cut-off of the protein expression levels. 17 proteins (PAM16, TGF-β, WIF1, SMAD3(P), DRD2, CDK4, CDKN2A/p16, Ki67, SFRP4, TBX19, SSTR1, HMGA1, RB1, E2F3, CDKN1A/p21, cyclin-D1 [CCND1], and secretogranin II [SCG2]) were valuable (P < 0.01) including the previous 14 proteins (Fig. 3). Therefore, we used the intersection of the signatures of these 14 proteins to perform further investigations. There are 203 cases expressed all 14 proteins without missing values.
Fig. 2.
Differential and Kaplan–Meier analyses of protein signatures. Scatter diagram showing the statistical significance results of 41 tumour related proteins. Sixteen and seventeen protein signatures were valuable in differential and Kaplan–Meier analyses, respectively (P < 0.01)
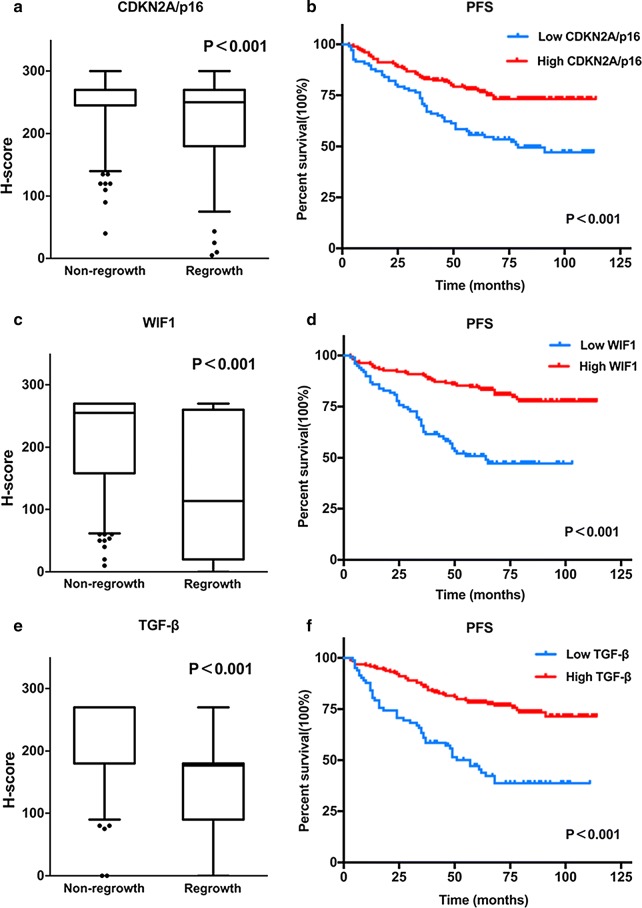
Fig. 3.
Differential and Kaplan–Meier analyses of the three protein signatures in patients with NFPA. Distributions of p16, WIF1 and TGF-β protein expression levels in patients of non-regrowth and regrowth cohorts (a, c, e). The Kaplan–Meier curves of PFS between the low and high median protein expression level groups are also shown (b, d, f)
Protein signatures analyses
Based on the 14 candidate protein signatures from the intersection of significant proteins in the differential analyses and survival analyses, a logistic regression analysis was used to screen the most likely candidate factors for tumour regrowth (shown in Additional file 2: Table S2). Finally, three proteins, WIF1, p16 and TGF-β, with the p values less than 0.05 were selected as predictors for the further establishment of the prediction model (Fig. 3). There are 248 cases expressed all three proteins without missing values; therefore, we chose 248 cases to perform the clinical characteristic analyses and the establishment of the prediction model. The 248 patients were randomly grouped into training and testing sets in a 3:1 ratio using computer-generated random numbers.
Patients characteristics
We preliminarily selected sex, age (< 40 years as grade 0, 40–60 years as grade 1, and ≥ 60 years as grade 2), tumour volume (macro-adenoma: 10–40 mm as grade 1, and giant adenoma: > 40 mm as grade 2), tumour resection rate (total resection as grade 1, subtotal resection as grade 2, partial resection as grade 3) and Knosp grade (0, 1, 2, 3, and 4) as candidate clinical predictors for the prediction of tumour regrowth. All of the selected clinical characteristics were categorical variables. The clinical factors that were statistically significantly associated with the regrowth of NFPA are shown in Table 1. Univariate logistic regression analyses showed that gender was not related to tumour regrowth (P = 0.067). Age, Knosp grade, tumour volume and tumour resection rate were found to be correlated with regrowth (P < 0.05).
Table 1.
Clinical characteristics of the patients with NFPA
| Characteristics | All patients (n = 295) | Regrowth cohort (n = 98) | Non-regrowth cohort (n = 197) | Univariate analysis | Multivariate analysis | ||
|---|---|---|---|---|---|---|---|
| OR (95% CI) | p value | OR (95% CI) | p value | ||||
| Gender | 0.067 | – | |||||
| Female | 140 (47.46%) | 56 (57.14%) | 84 (42.64%) | 1.00 (referent) | – | ||
| Male | 155 (52.54%) | 42 (42.86%) | 113 (57.36%) | 0.61 (0.36 to 1.04) | – | ||
| Age | < 0.001 | < 0.001 | |||||
| < 40 | 61 (20.68%) | 38 (38.78%) | 23 (11.68%) | 1.00 (referent) | 1.00 (referent) | ||
| 40–60 | 177 (60.00%) | 52 (53.06%) | 125 (63.45%) | 0.20 (0.10 to 0.39) | 0.22 (0.11 to 0.43) | ||
| ≥ 60 | 57 (19.32%) | 8 (8.16%) | 49 (24.87%) | 0.09 (0.03 to 0.24) | 0.11 (0.04 to 0.30) | ||
| Tumour volume | < 0.001 | 0.01 | |||||
| Macro | 181 (61.36%) | 46 (46.94%) | 135 (68.53%) | 1.00 (referent) | 1.00 (referent) | ||
| Giant | 114 (38.64%) | 52 (53.06%) | 62 (31.47%) | 2.68 (1.55 to 4.62) | 2.15 (1.20 to 3.87) | ||
| Knosp grade | 0.022 | 0.349 | |||||
| 0 | 62 (21.02%) | 11 (11.22%) | 51 (25.89%) | 1.00 (referent) | – | ||
| 1 | 61 (20.68%) | 21 (21.43%) | 40 (20.31%) | 1.71 (0.63 to 4.67) | – | ||
| 2 | 41 (13.90%) | 13 (13.27%) | 28 (14.21%) | 2.31 (0.83 to 6.41) | – | ||
| 3 | 27 (9.15%) | 12 (12.24%) | 15 (7.61%) | 4.29 (1.45 to 12.65) | – | ||
| 4 | 104 (35.25%) | 41 (41.84%) | 63 (31.98%) | 3.56 (1.49 to 8.48) | – | ||
| Tumour resection rate | 0.003 | 0.254 | |||||
| Total | 143 (48.47%) | 38 (38.78%) | 105 (53.30%) | 1.00 (referent) | – | ||
| Subtotal | 60 (20.34%) | 16 (16.32%) | 44 (22.33%) | 1.15 (0.55 to 2.42) | – | ||
| Partial | 92 (31.19%) | 44 (44.90%) | 48 (24.37%) | 2.75 (1.50 to 5.04) | – | ||
OR, odds ratios; 95% CI, 95% confidence intervals; Micro, micro-adenoma; Macro, macro-adenoma; Giant, giant adenoma; Total, total resection; Subtotal, subtotal resection; Partial, partial resection
Clinical signature analyses
To further determine the underlying significance of the selected clinical signatures, multivariate logistic regression analyses was performed to identify independent factors that were statistically significantly associated with the regrowth of NFPA patients. Age (P < 0.01) and tumour volume (P = 0.01) were independent risk factors of regrowth (Table 1). Our analyses indicated that the regrowth inclination decreases with age, and patients younger than 40 years are more prone to regrowth compared with those aged from 40 to 60 years (OR = 0.2, 95% CI = 0.10 to 0.39). In addition, patients aged over 60 years are least likely to have tumour regrowth (OR = 0.09, 95% CI = 0.03 to 0.24). The tumour volume has a positive correlation with the risk of tumour regrowth. Compared with patients with macro-adenoma, patients with giant adenoma were more inclined to suffer tumour regrowth (OR = 2.68, 95% CI = 1.55 to 4.62).
Establishment of the regrowth prediction model
Based on the clinical and protein signatures, we established a regrowth prediction model using logistic regression algorithm in the training set, the final prediction model was expressed by the following equation
Y = − 0.0159 × p16 − 0.0067 × WIF1 − 0.0162 × TGF-β − 1.2260 × age grade + 1.2205 × gross tumor volume grade + 6.4351.
The discriminant score P was determined as: P = exp(Y)/(1 + exp(Y)). In our classification model, the cut-off score was set at 0.5. When the discriminant score P was calculated to be less than 0.5, the patient was classified as a non-regrowth case, the case was predicted to be a regrowth.
During the training phase, a fivefold cross-validation accuracy was used to assess the unbiased performance of the logistic regression-based classifier in distinguishing regrowth and non-regrowth patients. For the training set of 186 fivefold cross-validation cases, the combined signature provided an overall accuracy of 81.2% (151 of 186), in which 36 of 61 regrowth cases and 115 of 125 non-regrowth cases were correctly predicted (Fig. 4a). The final classification model has obtained a better prediction accuracy in the training set, which provided an accuracy of 84.9%. In this set, 158 of 186 patients were correctly classified, of the 28 patients misclassified, 18 were false-negative and 10 were false-positive, respectively (Fig. 4b). Meanwhile, the prediction ability was validated in the testing set, with an accuracy of 83.9% (52 of 62). Correct predictions were obtained for 16 of 20 (four false-negative cases) regrowth cases and 36 of 42 (six false-positive cases) non-regrowth cases (Fig. 4c).
Fig. 4.
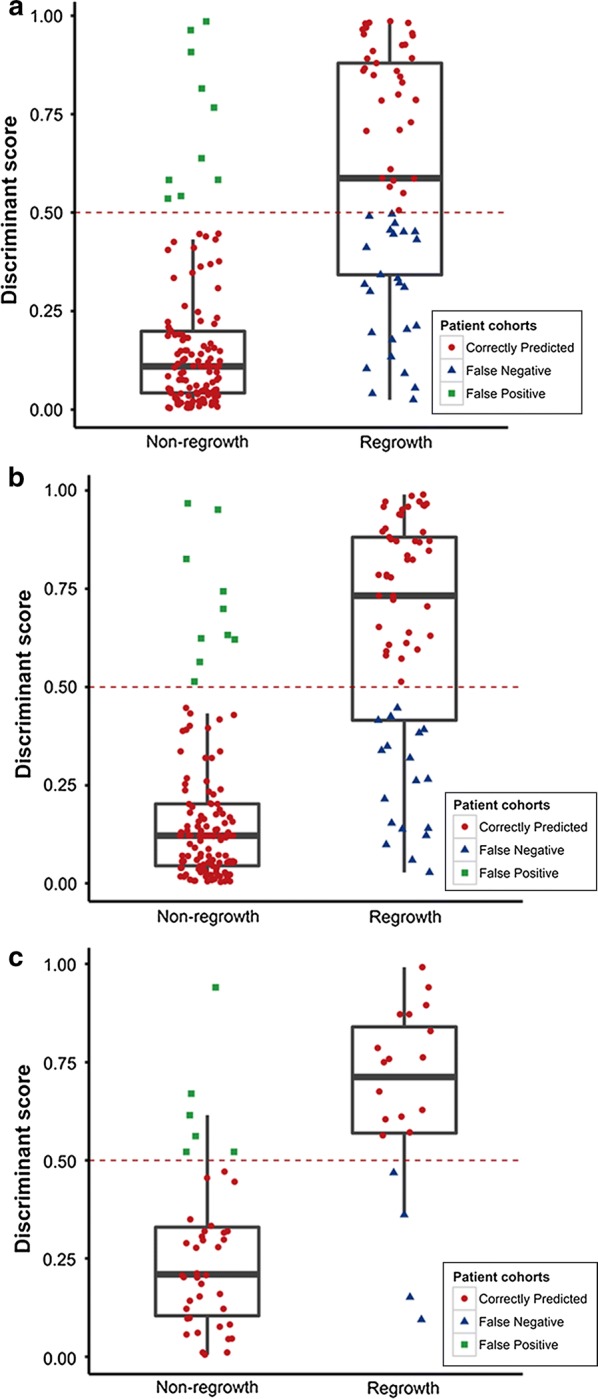
Distributions of the discriminant scores predicted by the model for the different groups. Box-and-whisker plot showing the distributions of the discriminant scores of the non-regrowth and regrowth groups in the overall fivefold cross-validation cases (a), the training (b) and testing set (c). The three different shapes (or colours) in the boxplot respectively indicates the patients who were correctly predicted and mis-predicted (false positive and false negative)
The ROC analyses were used to assess the sensitivity and specificity of the regrowth prediction. Our classification model based on the combination of clinical and protein signatures showed a good sensitivity and specificity for regrowth prediction with an AUC of 0.895 in the training set (Fig. 5a). We thus validated the model using the same discriminant score in the testing set. The predictive ability was remarkably stable with an AUC of 0.881. In order to explore the possibility whether proteins combined with clinical signatures could be better biomarkers for regrowth prediction, we constructed a model using the protein signatures alone and compared its predictive ability with the model integrating the protein and clinical signatures. The combined model had a significantly better predictive ability than that of the protein signature-alone model, in both the training set (AUC: 0.895 to 0.846, P < 0.001, Fig. 5a) and testing set (AUC: 0.881 to 0.808, P < 0.001, Fig. 5b). The introduction of clinical signatures performed remarkably well.
Fig. 5.
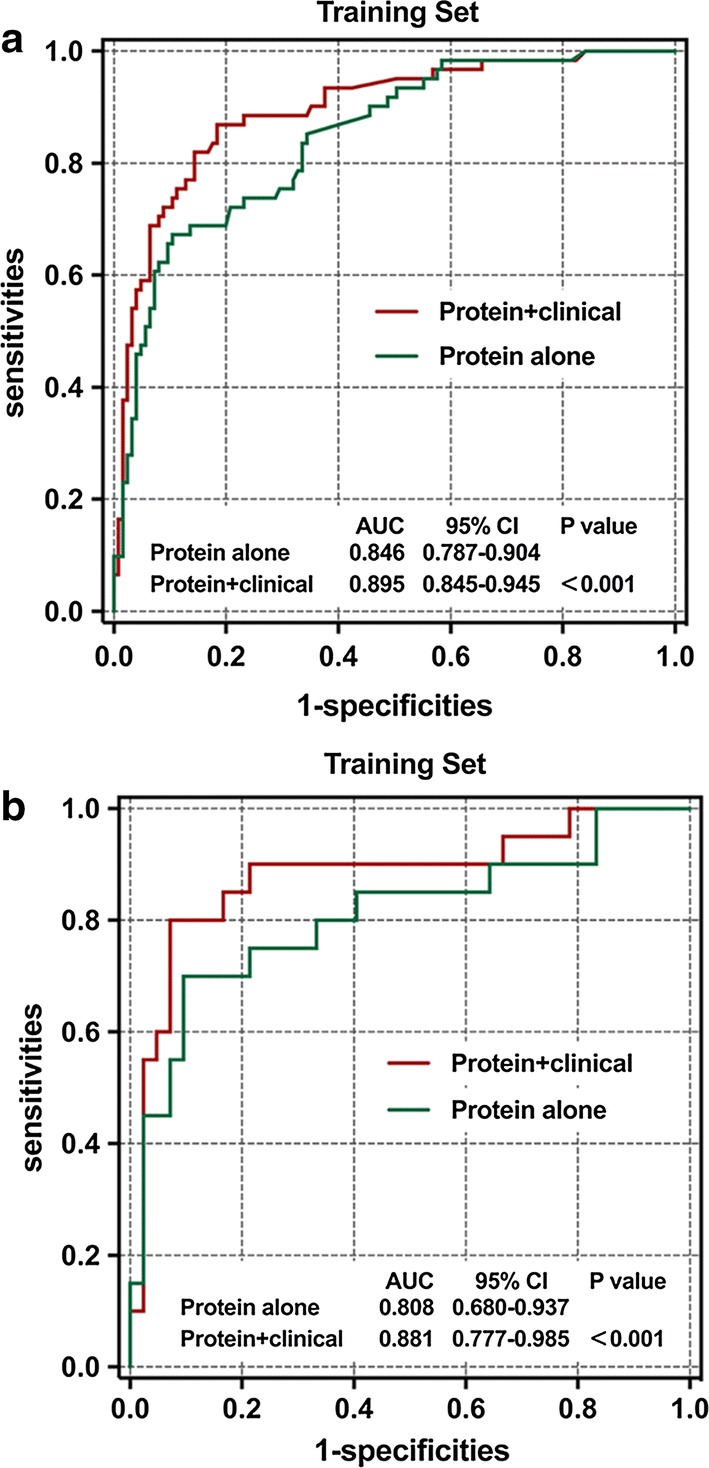
The regrowth prediction model in the training and testing sets. Two ROC curves showing the comparisons of the sensitivity and specificity for the prediction of regrowth in protein combining clinical signature and protein signature alone in the training (a) and testing set (b). The combination of protein and clinical signatures shows a better prediction accuracy than that of protein signature alone (P < 0.001)
Discussion
As a benign tumour derived from the anterior pituitary gland, some pituitary adenomas, like FPA, can induce endocrine disorders by the hypersecretion of hormone, such as adrenocorticotropic hormone (ACTH), thyroid-stimulating hormone (TSH), growth hormone (GH) and prolactin (PRL) [6]. The serum hormone levels and corresponding endocrine symptoms provides a feasible approach to qualitative diagnosis and regrowth evaluation. Compared with FPA, NFPA lacks endocrine symptoms such as hormone hypersecretion and is mostly diagnosed and postoperatively monitored via imaging examinations, such as enhanced MRI and computed tomography. Besides the imaging techniques, there are few convenient detection approaches for early diagnosis or regrowth monitoring. The possibility of early intervention and fair prognosis may have vanished when the symptoms of mass effect appear or imaging examination reveals abnormal changes. For these reasons, we dedicate to establish an efficient prediction model for the clinical and pathological practice of NFPA. However, research on molecular markers to predict the regrowth of NFPA is far from comprehensive. Researchers had proposed that some proteins have correlation with NFPA regrowth, but few had minutely illustrated their practical application and none had put forward to aggregate analyses forecast model using these proteins and clinical signatures.
In an attempt to identify proteins that allow us to establish a reliable NFPA regrowth prediction model, we started by screening the key papers of pituitary adenoma to identify 41 tumour related proteins. We then narrowed the set to 14 proteins with differential protein expression and Kaplan–Meier analyses. The final three protein signatures including p16, WIF1 and TGF-β were validated via logistic regression analyses with the p values less than 0.05. They were adopted to build the prediction model in which low expression levels were related to regrowth in our analyses. As far as their biological functions are concerned, low expression level of p16 and WIF1 is observed in pituitary tumorigenesis and is necessary for tumour progression, the methylation of their promoters indicates a poor prognosis [7–11]. The TGF-β signaling pathway is a key player in tumour development whose activity is reportedly lower in NFPA which results in infaust outcomes [12, 13]. The combining effect of these genes leads to the proliferation of tumor cells and the increase of tumor volume.
Previous researchers have taken attempt to predict regrowth with clinical features, but they have not reached a consensus in this respect. Tumour residue has always been considered as a risk factor for regrowth because either trans-sphenoidal surgery or open surgery has difficulties in removing tumour invading cavernous sinus and most patients faced with regrowth in around 5 years [4, 14]. However, in our study, multivariate regression analyses showed that tumour resection rate has no relation with regrowth. This may indicate that regrowth may be associated with the instinct molecular biology characteristic of pituitary adenoma, which also result in the progression of tumour volume, instead of the surgical intervention.
Knosp grade is a pivotal factor in clinical treatment because of its instruction to surgical resection. However, its significance in tumour regrowth is quite controvertible [15–17]. Our research shows that Knosp grade has no influence on tumour regrowth. This may be rational because its potential is revealed by inducing surgical obstacles and directly result in tumour residue which is not an influential factor in our model.
The potential of age as a risk factor for tumour regrowth deserves some consideration. Several studies have reported that younger age to be strongly correlated with regrowth either in relation to residue or as an independent risk factor [16, 18, 19]. However, other researchers hold that age may not show an underlying tendency to regrowth [4, 20]. Our analyses indicates that age is an independent protective factor in patients with NFPA, and younger age indicates a higher regrowth rate.
In recent years, new genetic markers researches including cell-free nucleic acids or long noncoding RNA have been increasingly reported in a variety of tumour, suggesting a promising new class of molecular markers for tumour diagnosis and prognostic evaluation [21–23]. However, these markers have not been fully adapted for clinical use because of their low sensitivity and complicated process. Furthermore, there have been few similar studies in pituitary adenoma except for some research on molecular mechanism [24, 25]. For these reasons, our model combining the clinical features with pathological signatures is a convenient and feasible way to evaluate the postoperative regrowth of NFPA. However, the number of patients in our study was not large enough which restricts us to evaluate the accuracy of our model in an additional validating set.
Conclusion
To our knowledge, our study is the first to establish a promising statistical model to predict the regrowth of NFPA with clinical and protein signatures. This work provides a novel insight into prognostic evaluation and may help patients to benefit from accurate early intervention.
Additional files
Additional file 1: Table S1. Antibody information involved in the research.
Additional file 2: Table S2. P values of 41 tumour related proteins in differential and Kaplan–Meier analyses.
Acknowledgements
Everyone that has contributed to this program has been listed as an author.
Abbreviations
- PA
pituitary adenoma
- FPA
clinically functioning pituitary adenoma
- NFPA
clinically non-functioning pituitary adenoma
- CDKN2A/p16
cyclin-dependent kinase inhibitor 2A
- WIF1
WNT inhibitory factor 1
- TGF-β
tumour growth factor beta
- ROC
receiver operating characteristic
- AUC
area under the receiver operating characteristic curves
Authors' contributions
SC, JQW, CYL, XMY and YZZ were responsible for the research design. CZL, SC, YFL and CHL participated in the sample collection and clinical data collection. YFL, CHL and GLL participated in performing the experiment. SC and CZL contributed to the manuscript writing and submission. JQW, SFH, WJL and XMY were responsible for the statistical analyses and figure formatting. CZL and YZZ participated in the funding application and management of the project. All authors have contributed to manuscript. All authors read and approved the final manuscript.
Funding
This work was supported by grants from the National High Technology Research and Development Program of China (863 Program, 2014AA020610), National Natural Science Foundation of China (81771489), Beijing Municipal Science & Technology Commission (Z171100000117002) and China National Key Research and Development Program (2017YFC0908300).
Availability of data and materials
The datasets during and/or analyzed during the current study available from the corresponding author on reasonable request.
Ethics approval and consent to participate
This study was approved by the medical ethics committee of Beijing Tiantan Hospital.
Consent for publication
All the authors in this paper consent to publication of the work.
Competing interests
The authors declare that they have no competing interests.
Footnotes
Publisher's Note
Springer Nature remains neutral with regard to jurisdictional claims in published maps and institutional affiliations.
Sen Cheng and Jiaqi Wu are co-authors
Contributor Information
Sen Cheng, Email: dr.sencheng@hotmail.com.
Jiaqi Wu, Email: wjq921029@163.com.
Chuzhong Li, Email: lichuzhong@163.com.
Yangfang Li, Email: cclslyf@163.com.
Chunhui Liu, Email: 15901380086@163.com.
Guilin Li, Email: liguilin40@hotmail.com.
Wuju Li, Email: wujuchina@126.com.
Shuofeng Hu, Email: hushuofeng08@163.com.
Xiaomin Ying, Email: yingxm@bmi.ac.cn.
Yazhuo Zhang, Email: zyz2004520@yeah.net.
References
- 1.Ostrom QT, Gittleman H, Liao P, Vecchione-Koval T, Wolinsky Y, Kruchko C, Barnholtz-Sloan JS. CBTRUS statistical report: primary brain and other central nervous system tumors diagnosed in the United States in 2010–2014. Neuro Oncol. 2017;19:v1–v88. doi: 10.1093/neuonc/nox158. [DOI] [PMC free article] [PubMed] [Google Scholar]
- 2.Ebersold MJ, Quast LM, Laws ER, Jr, Scheithauer B, Randall RV. Long-term results in transsphenoidal removal of nonfunctioning pituitary adenomas. J Neurosurg. 1986;64:713–719. doi: 10.3171/jns.1986.64.5.0713. [DOI] [PubMed] [Google Scholar]
- 3.Snyder PJ, Bashey HM, Phillips JL, Gennarelli TA. Comparison of hormonal secretory behavior of gonadotroph cell adenomas in vivo and in culture. J Clin Endocrinol Metab. 1985;61:1061–1065. doi: 10.1210/jcem-61-6-1061. [DOI] [PubMed] [Google Scholar]
- 4.Brochier S, Galland F, Kujas M, Parker F, Gaillard S, Raftopoulos C, Young J, Alexopoulou O, Maiter D, Chanson P. Factors predicting relapse of nonfunctioning pituitary macroadenomas after neurosurgery: a study of 142 patients. Eur J Endocrinol. 2010;163:193–200. doi: 10.1530/EJE-10-0255. [DOI] [PubMed] [Google Scholar]
- 5.Budwit-Novotny DA, McCarty KS, Cox EB, Soper JT, Mutch DG, Creasman WT, Flowers JL, McCarty KS., Jr Immunohistochemical analyses of estrogen receptor in endometrial adenocarcinoma using a monoclonal antibody. Cancer Res. 1986;46:5419–5425. [PubMed] [Google Scholar]
- 6.Kovacs K, Horvath E, Vidal S. Classification of pituitary adenomas. J Neurooncol. 2001;54:121–127. doi: 10.1023/A:1012945129981. [DOI] [PubMed] [Google Scholar]
- 7.Cao L, Gao H, Gui S, Bai G, Lu R, Wang F, Zhang Y. Effects of the estrogen receptor antagonist fulvestrant on F344 rat prolactinoma models. J Neurooncol. 2014;116:523–531. doi: 10.1007/s11060-013-1351-8. [DOI] [PubMed] [Google Scholar]
- 8.Cao L, Gao H, Li P, Gui S, Zhang Y. The Wnt/beta-catenin signaling pathway is involved in the antitumor effect of fulvestrant on rat prolactinoma MMQ cells. Tumour Biol. 2014;35:5121–5127. doi: 10.1007/s13277-013-1571-8. [DOI] [PubMed] [Google Scholar]
- 9.Chesnokova V, Zonis S, Rubinek T, Yu R, Ben-Shlomo A, Kovacs K, Wawrowsky K, Melmed S. Senescence mediates pituitary hypoplasia and restrains pituitary tumor growth. Cancer Res. 2007;67:10564–10572. doi: 10.1158/0008-5472.CAN-07-0974. [DOI] [PMC free article] [PubMed] [Google Scholar]
- 10.Machiavelli G, Cotignola J, Danilowicz K, Carbonara C, Paes de Lima A, Bruno OD, Basso A, Szijan I. Expression of p16(INK4A) gene in human pituitary tumours. Pituitary. 2008;11:71–75. doi: 10.1007/s11102-007-0077-z. [DOI] [PubMed] [Google Scholar]
- 11.Quereda V, Malumbres M. Cell cycle control of pituitary development and disease. J Mol Endocrinol. 2009;42:75–86. doi: 10.1677/JME-08-0146. [DOI] [PubMed] [Google Scholar]
- 12.Massague J. TGFbeta in Cancer. Cell. 2008;134:215–230. doi: 10.1016/j.cell.2008.07.001. [DOI] [PMC free article] [PubMed] [Google Scholar]
- 13.Zhenye L, Chuzhong L, Youtu W, Xiaolei L, Lei C, Lichuan H, Hongyun W, Yonggang W, Fei W, Yazhuo Z. The expression of TGF-beta1, Smad3, phospho-Smad3 and Smad7 is correlated with the development and invasion of nonfunctioning pituitary adenomas. J Transl Med. 2014;12:71. doi: 10.1186/1479-5876-12-71. [DOI] [PMC free article] [PubMed] [Google Scholar]
- 14.Cury ML, Fernandes JC, Machado HR, Elias LL, Moreira AC, Castro M. Non-functioning pituitary adenomas: clinical feature, laboratorial and imaging assessment, therapeutic management and outcome. Arq Bras Endocrinol Metabol. 2009;53:31–39. doi: 10.1590/S0004-27302009000100006. [DOI] [PubMed] [Google Scholar]
- 15.Chang EF, Zada G, Kim S, Lamborn KR, Quinones-Hinojosa A, Tyrrell JB, Wilson CB, Kunwar S. Long-term recurrence and mortality after surgery and adjuvant radiotherapy for nonfunctional pituitary adenomas. J Neurosurg. 2008;108:736–745. doi: 10.3171/JNS/2008/108/4/0736. [DOI] [PubMed] [Google Scholar]
- 16.Losa M, Mortini P, Barzaghi R, Ribotto P, Terreni MR, Marzoli SB, Pieralli S, Giovanelli M. Early results of surgery in patients with nonfunctioning pituitary adenoma and analysis of the risk of tumor recurrence. J Neurosurg. 2008;108:525–532. doi: 10.3171/JNS/2008/108/3/0525. [DOI] [PubMed] [Google Scholar]
- 17.Roelfsema F, Biermasz NR, Pereira AM. Clinical factors involved in the recurrence of pituitary adenomas after surgical remission: a structured review and meta-analysis. Pituitary. 2012;15:71–83. doi: 10.1007/s11102-011-0347-7. [DOI] [PMC free article] [PubMed] [Google Scholar]
- 18.Losa M, Franzin A, Mangili F, Terreni MR, Barzaghi R, Veglia F, Mortini P, Giovanelli M. Proliferation index of nonfunctioning pituitary adenomas: correlations with clinical characteristics and long-term follow-up results. Neurosurgery. 2000;47:1313–1318. doi: 10.1097/00006123-200012000-00009. [DOI] [PubMed] [Google Scholar]
- 19.Watts AK, Easwaran A, McNeill P, Wang YY, Inder WJ, Caputo C. Younger age is a risk factor for regrowth and recurrence of nonfunctioning pituitary macroadenomas: results from a single Australian centre. Clin Endocrinol (Oxf) 2017;87:264–271. doi: 10.1111/cen.13365. [DOI] [PubMed] [Google Scholar]
- 20.Tampourlou M, Ntali G, Ahmed S, Arlt W, Ayuk J, Byrne JV, Chavda S, Cudlip S, Gittoes N, Grossman A, et al. Outcome of nonfunctioning pituitary adenomas that regrow after primary treatment: a study from two large UK centers. J Clin Endocrinol Metab. 2017;102:1889–1897. doi: 10.1210/jc.2016-4061. [DOI] [PubMed] [Google Scholar]
- 21.Chen X, Dai M, Zhu H, Li J, Huang Z, Liu X, Huang Y, Chen J, Dai S. Evaluation on the diagnostic and prognostic values of long non-coding RNA BLACAT1 in common types of human cancer. Mol Cancer. 2017;16:160. doi: 10.1186/s12943-017-0728-2. [DOI] [PMC free article] [PubMed] [Google Scholar]
- 22.Wu Y, Wang YQ, Weng WW, Zhang QY, Yang XQ, Gan HL, Yang YS, Zhang PP, Sun MH, Xu MD, Wang CF. A serum-circulating long noncoding RNA signature can discriminate between patients with clear cell renal cell carcinoma and healthy controls. Oncogenesis. 2016;5:e192. doi: 10.1038/oncsis.2015.48. [DOI] [PMC free article] [PubMed] [Google Scholar]
- 23.Yamoah K, Johnson MH, Choeurng V, Faisal FA, Yousefi K, Haddad Z, Ross AE, Alshalafa M, Den R, Lal P, et al. Novel biomarker signature that may predict aggressive disease in african American men with prostate cancer. J Clin Oncol. 2015;33:2789–2796. doi: 10.1200/JCO.2014.59.8912. [DOI] [PMC free article] [PubMed] [Google Scholar]
- 24.Li Z, Li C, Liu C, Yu S, Zhang Y. Expression of the long non-coding RNAs MEG3, HOTAIR, and MALAT-1 in non-functioning pituitary adenomas and their relationship to tumor behavior. Pituitary. 2015;18:42–47. doi: 10.1007/s11102-014-0554-0. [DOI] [PubMed] [Google Scholar]
- 25.Robertson AM, Heaney AP. Molecular markers in pituitary tumors. Curr Opin Endocrinol Diabetes Obes. 2016;23:324–330. doi: 10.1097/MED.0000000000000266. [DOI] [PubMed] [Google Scholar]
Associated Data
This section collects any data citations, data availability statements, or supplementary materials included in this article.
Supplementary Materials
Additional file 1: Table S1. Antibody information involved in the research.
Additional file 2: Table S2. P values of 41 tumour related proteins in differential and Kaplan–Meier analyses.
Data Availability Statement
The datasets during and/or analyzed during the current study available from the corresponding author on reasonable request.


