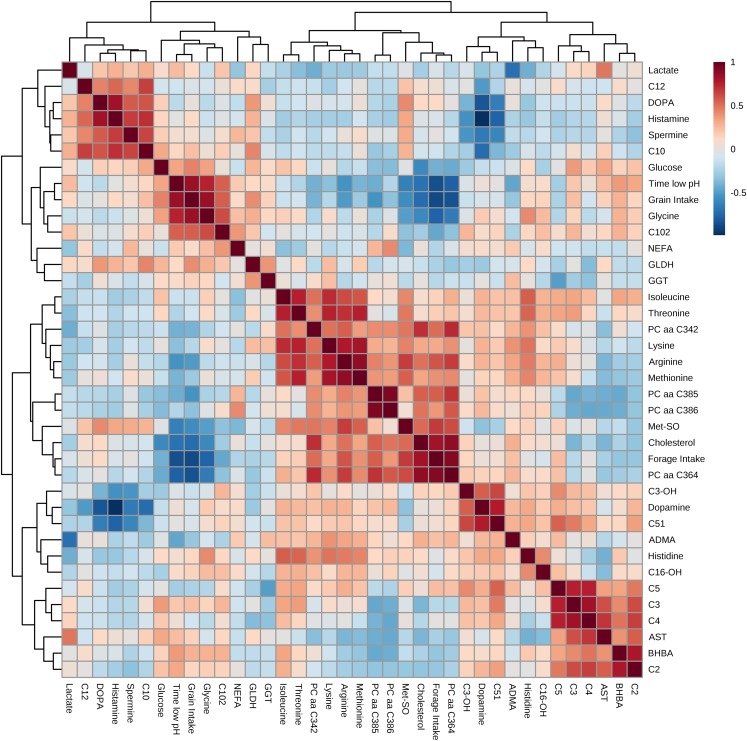
Figure 3.
Correlation of the different blood metabolites that were affected by the feed additive, as well as forage and grain intake and reticular pH below the subacute ruminal acidosis (SARA)-threshold, measured during a pure forage feeding regimen or a 65% concentrate-challenge. A heat map of Spearman correlation coefficients was generated for different concentration levels. The red color indicates a positive correlation coefficient, and the blue color represents a negative coefficient. ADMA=asymmetric dimethylarginine; AST=aspartate aminotransferase; BHBA=ß-hydroxybutyrate; C=carnitine; DOPA=dihydroxyphenylalanine; GLDH=glutamate dehydrogenase; GGT=γ-glutamyltransferase; Met-SO=methionine-sulfoxide; NEFA=non-esterified fatty acids; PC=phosphatidylcholine; aa=diacyl.

