Abstract
Objective
Multiple mechanisms underlying the development of portal vein tumor thrombus (PVTT) in hepatocellular carcinoma (HCC) have been reported recently. However, the origins of PVTT remain unknown. Increasing multi-omics data on PVTTs in HCCs have made it possible to investigate whether PVTTs originate from the corresponding primary tumors (Ts).
Methods
The clonal relationship between PVTTs and their corresponding primary Ts was investigated using datasets deposited in public databases. One DNA copy number variations dataset and three gene expression datasets were downloaded for the analyses. Clonality analysis was performed to investigate the clonal relationship between PVTTs and Ts from an individual patient. Differential gene expression analysis was applied to investigate the gene expression profiles of PVTTs and Ts.
Results
One out of 19 PVTTs had no clonal relationship with its corresponding T, whereas the others did. The PVTTs with independent clonal origin showed different gene expression and enrichment in biological processes from the primary Ts. Based on the unique gene expression profiles, a gene signature including 24 genes was used to identify pairs of PVTTs and primary Ts without any clonal relationship. Validation in three datasets showed that these types of pairs of PVTTs and Ts can be identified by the 24-gene signature.
Conclusions
Our findings show a direct evidence for PVTT origin and consolidate the heterogeneity of PVTTs observed in clinic. The results suggest that PVTT investigation at a molecular level is clinically necessary for diagnosis and treatment.
Keywords: Hepatocellular carcinoma, portal vein tumor thrombus, clonal origin, copy number variation, bioinformatics
Introduction
Portal vein tumor thrombus (PVTT) is one of the main hepatocellular carcinoma (HCC) complications, found in approximately 50% of HCC patients1. The prognosis of HCC patients with PVTT is poor, and the median overall survival (OS) time of patients with PVTT was primarily less than 1 year2,3. Although clinicians in Europe and America recommend sorafenib alone, and multidisciplinary therapy has been adapted in Asia4,5, no worldwide consensus or guidelines have shown effectiveness for specific PVTT treatment, which might be due to a lack of knowledge about the nature of PVTT.
Although currently, hypoxia, non-coding RNAs, and cancer stem cells have been found to contribute to PVTT development6-9, the clonal origins of PVTT still remain unknown. The identical gene expression profiles between PVTT and the corresponding primary HCCs demonstrated that PVTT could originate from HCC primary nodules by metastasis10,11. Contradictorily, in small HCC patients, some PVTTs are clinically defined, that are distant from the liver parenchyma tumor (PT) nodules, and some PVTTs are found without liver parenchyma tumor nodules12,13. Moreover, some PVTTs showed significantly different gene expression profiles compared with those of the paired primary tumors (Ts)11. These findings indicate that PVTTs display relatively high heterogeneity and may have different clonal origins from the paired primary Ts.
Recently, high-throughput technology, such as microarray and sequencing, has been widely used to investigate the mechanisms underlying the development of Ts, including HCC. Among them, 3 published studies involved the genomic or transcriptomic datasets of HCC as well as PVTT9,11,14. In the present study, previously published datasets (GSE77509, GSE69164, GSE77275, and GSE74656), and freshly obtained samples were used for analysis, and we found a type of PVTT that has a different clonal origin from that of the corresponding primary Ts in HCC. Additionally, this type of PVTT was found to express a specific set of genes, which varied from that of the corresponding Ts.
Materials and methods
Data resources
Four previously published datasets (Cytoscan HD array, GSE77275; RNA-seq, GSE77509 and GSE69164; and cDNA microarray, GSE74656) used in this study were downloaded from the NCBI Gene Expression Omnibus (GEO, http://www.ncbi.nlm.nih.gov/geo/). GSE77275 included the copy number variation (CNV) profiles of 60 matched samples (PVTT/T/PT from 20 patients) assessed by Cytoscan HD array. GSE77509 included the gene expression profiles of these 60 samples assessed by RNA-seq. DNA and total RNA from the 60 samples were used for CNV and gene expression analysis, respectively, as previously reported11.
The samples of patient 14 (P14), in these two datasets, were not included in the present study because they were reported to be contaminated11. GSE69164 included the gene expression of 33 matched samples from 11 patients assessed by RNA-seq14. GSE74656 included the gene expression data of 15 matched samples from 5 patients assessed by cDNA analysis.
Clonality testing
To investigate the clonal relationship between PVTTs and Ts from an individual patient, the CNV profiles of 19 pairs of PVTTs and Ts were extracted from GSE77275 using R package Affy2sv and loaded to R package Clonality for further analysis. The CNV of the chromosome region in each patient was estimated using the circular binary segmentation (CBS) analysis based on the normalized weighted Log2 ratio. A significant CNV in chromosome regions was determined according to the threshold value (median absolute deviations = 1.25). The clonal relationship between PVTTs and Ts from an individual patient was investigated according to the likelihood ratio 2 (LR2)15,16.
Differential gene expression analysis
The gene expression profiles of PVTTs and Ts from the datasets GSE77509, GSE69164, and GSE74656 were extracted using the appropriate methods11. EBSeq from NovelBrain BioCloud (https://cloud.novelbrain.com) was applied to analyze differentially expressed genes between PVTTs and Ts from individual patients in GSE77509. Genes with fold changes > 3 and FDR < 0.05 were identified as significantly differentially expressed.
Gene ontology and KEGG pathway enrichment analyses
The differentially expressed genes between PVTT13 and T13 were loaded to Metascape for Gene ontology (GO) and KEGG pathway enrichment analyses17. Protein-protein interaction (PPI) network analysis was also performed in Metascape, and the PPI network was exported using Cytoscape 3.4.
Gene signature enrichment analysis
Gene expression signature enrichment was evaluated using single-sample gene set enrichment analysis (ssGSEA) and nearest template prediction (NTP) analyses (Gene Pattern modules)18. Molecular Signature Database gene sets, (MSigDB, www.broadinstitute.org/msigdb) including hematopoietic stem cells and liver cancer stem cells, and previously published gene-expression signatures representing different cell types including bile duct cells (BDC), hepatocytes, hepatic progenitor cells (HPC), and hepatic stellate cells (HSC)19 (Supplementary Table S1), were tested using ssGSEA. Previously, published HCC molecular classifications were also analyzed using NTP analysis20,21.
S1.
Gene set used in enrichment analysis
| Molecular Signature Database gene sets | Description | Genes |
| HOSHIDA_LIVER_
CANCER_ SUBCLASS_S3 |
> Genes from 'subtype S3' signature of hepatocellular carcinoma (HCC): hepatocyte differentiation. | ABCB4, ABCC6, ABHD2, ABP1, ACAA2, ACADM, ACADS, ACADSB, ACADVL, ACO1, ACOX1, ACOX2, ACSL1, ACY1, ADH4, ADH6, ADK, AGL, AGXT, AKR1C1, ALAS1, ALDH1A1, ALDH1B1, ALDH2, ALDH3A2, ALDH4A1, ALDH6A1, ALDH7A1, ALDOB, ALPL, AMFR, AMT, ANXA6, APCS, APOA1, APOC2, APOC4, APOH, AQP7, ARG1, ARHGEF12, ARSA, ASCL1, ASGR1, ASGR2, ASL, ASS1, ATOX1, ATP5D, ATP5J, AZGP1, BAAT, BDH1, BHMT, BLOC1S1, BLVRB, BPHL, BTD, C1R, C1S, C4A, C4BPA, C8B, CA2, CAT, CBR1, CD14, CD302, CD81, CECR1, CES1, CFB, CFH, CGREF1, CNGA1, COL18A1, COX5B, CP, CPA3, CPA4, CPB2, CPS1, CRABP1, CRYAA, CRYM, CSTB, CTH, CTSO, CXCL2, CYB5A, CYFIP2, CYP21A2, CYP27A1, CYP2C9, CYP2J2, CYP3A7, DAO, DCAF8, DECR1, DNASE1L3, DPAGT1, DRG2, ECHS1, ECI1, EDNRB, EGFR, EHHADH, EMP2, EPAS1, EPHX1, ETS2, F11, F2, F5, FAH, FANCA, FGB, FGG, FH, FKBP2, FLT4, FMO4, FOXO1, FXR2, GCH1, GCHFR, GCKR, GGH, GHR, GJB1, GLYAT, GOT2, GPT, GPX2, GPX3, GSTA2, GSTO1, GSTZ1, HAAO, HADH, HGD, HMGCS2, HMOX2, HPD, HRG, HRSP12, HSD17B10, HSD17B4, ICAM3, IDH2, IDH3A, IFIT1, IGF1, IL13RA1, IL32, IL6R, IMPA1, INSR, IQGAP2, ISG15, ITIH1, ITIH3, ITIH4, ITPR2, IVD, KCNJ8, KLKB1, KMO, KNG1, LCAT, LONP1, LPIN1, LPIN2, MAOA, MAOB, MAPRE3, MGST2, MME, MSMO1, MT2A, MTHFD1, MTHFS, MUT, MYLK, MYO1E, NDUFV2, NFIB, NFIC, NFKBIA, NNMT, NRG1, PAH, PAPSS2, PCCA, PCCB, PCK1, PCK2, PDK4, PGM1, PGRMC1, PIK3R1, PKLR, PLA2G2A, PLCG2, PLG, PLGLB2, PNPLA4, POLD4, PON3, PPP2R1B, PROS1, PTGR1, PTS, QDPR, RARRES2, RBP5, RGN, RHOB, RNASE4, SBDS, SDC1, SDHB, SDS, SELENBP1, SEPP1, SERPINA3, SERPINA6, SERPINC1, SERPING1, SHB, SHMT1, SLC10A1, SLC16A2, SLC23A1, SLC23A2, SLC2A2, SLC35D1, SLC6A1, SLC6A12, SLC7A2, SLC9A3R2, SLCO2A1, SLPI, SMARCA2, SOAT1, SOD1, SOD2, SORL1, SPAM1, SPARCL1, SRD5A1, SREBF1, SULT2A1, TCEA2, TDO2, TGFBR3, TINAGL1, TJP2, TMBIM6, TMOD1, TOB1, TPMT, TST, UQCRB, VSIG2, ZNF160 |
| HOSHIDA_LIVER_
CANCER_ SUBCLASS_S2 |
> Genes from 'subtype S2' signature of hepatocellular carcinoma (HCC): proliferation, MYC and AKT1 [GeneID=4609;207] activation. | ABCB10, ABCD3, ACP1, ADD3, AFP, AHCY, ARHGAP35, ARID3A, ATF2, ATM, ATP2B1, ATP2B2, ATP5F1, ATXN10, BCAM, BCLAF1, BRD3, BTG3, C5orf13, CASC3, CD46, CDK6, CHKA, CLK2, COL2A1, CPD, CSE1L, CSNK2A1, CSNK2A2, CTNNB1, CUL4A, CXADR, DDX1, DDX18, DEK, EIF4A2, EIF4B, ENPP1, EP300, ERBB3, FBL, FGFR3, FGFR4, FLNB, GBF1, GCN1L1, GLUD1, GNAI1, GPC3, GTF2I, GTF3C2, H1F0, HELZ, HMGCR, HNRNPA2B1, HNRNPC, HNRNPU, IDI1, IGF2, IGF2R, ITIH2, KLF3, LBR, MAPK6, MEST, NCOA4, NET1, NR2C1, NR5A2, NT5E, NUP153, PEG3, PHF3, PHKA2, PIGC, PLXNB1, PNN, POFUT1, PPARG, PPP2R1A, PRDX3, PTOV1, RAB4A, RBM39, RPL24, RPL27, RPL31, RPS19, RPS24, RPS25, RPS27, RPS5, RRP1B, SEPHS1, SLC6A2, SLC6A5, SMARCA1, SMARCC1, SNRPE, SNTB1, SREBF2, SSB, SUMO1, SUZ12, TARBP1, TBCE, TFIP11, TIA1, TIAL1, TM9SF4, TP53BP2, TPR, TRIM26, TTC3, UBE2K |
| HOSHIDA_LIVER_
CANCER_ SUBCLASS_S1 |
> Genes from 'subtype S1' signature of hepatocellular carcinoma (HCC): aberrant activation of the WNT signaling pathway. | ACP5, ACTA2, ADAM15, ADAM8, ADAM9, AEBP1, AIF1, AKT3, ALDOA, ALOX5AP, ANXA1, ANXA4, ANXA5, AP2S1, AQP1, ARF5, ARHGDIB, ARPC1B, ARPC2, ASAH1, ATP1B3, ATP6AP1, ATP6V0B, ATP6V1B2, ATP6V1F, BCL2A1, BLVRA, C1QB, C3AR1, CAPZA1, CBFB, CCL3, CCL5, CCND2, CCR7, CD151, CD37, CD3D, CD47, CD48, CD53, CD74, CD8A, CDC20, CDC25B, CDH11, CDK2AP1, CELF2, CHN1, COL11A1, COL15A1, COL1A2, COL3A1, COL4A1, COL4A2, COL5A2, COL6A1, COL6A2, CORO1A, CRABP2, CRIP2, CSRP3, CTGF, CTSC, CTSS, CXCL1, CXCR4, CYBA, CYBB, CYFIP1, CYP1B1, CYR61, DAB2, DCTN2, DDR1, DDR2, DDX11, DGKA, DGKZ, DNM2, DPYSL2, DUSP5, DUT, EFEMP1, EFNB1, F13A1, FBN1, FBRS, FCGBP, FCGR2A, FGL2, FHL3, FLNA, FUT4, FYB, GEM, GLIPR1, GNAI2, GNS, GPNMB, GRN, GSTP1, GUCY1A3, GYPC, HCLS1, HEXA, HIF1A, HK1, HLA-DMA, HLA-DOA, HLA-DPB1, HLA-DQA2, HLA-DQB1, ID3, IER3, IFI16, IFI30, IGFBP5, IGH@, IGKC, IGLL1, IKBKE, IL15RA, IL2RB, IL2RG, IL7R, IQGAP1, IRF1, ITGB2, ITPR3, KIAA0101, KLC1, KLF5, LAMB1, LAPTM5, LCP1, LDHB, LGALS1, LGALS3BP, LGALS9, LGMN, LHFPL2, LITAF, LMO4, LOX, LSP1, LTBP2, LTBP3, LTF, LUM, LYN, M6PR, MAP1B, ME1, MFAP1, MGP, MPHOSPH6, MSN, MTHFD2, MYCBP2, NBL1, NPC2, NSMAF, OAZ1, PAK1, PAM, PAPSS1, PEA15, PFN1, PGK1, PIM2, PKD2, PKMYT1, PKN1, PLAUR, PLD3, PLP2, PNP, POLD3, POSTN, PPIC, PPP1CB, PPP4C, PPP4R1, PRKD2, PRMT5, PROCR, PSMD2, PTPRC, PYGB, QSOX1, RAB31, RALB, RALGDS, RCC1, RHOA, RIN2, RIT1, RNASE1, RNASE6, RPA2, RSU1, S100A10, S100A11, S100A13, SLA, SLBP, SLC1A5, SLC2A1, SLC2A5, SLC39A6, SLC7A5, SMAD2, SMARCD1, SPAG8, SRGN, SRI, STK38, STX3, TAGLN, TAX1BP3, TCF4, TFF3, THY1, TIMP2, TMSB4X, TNFRSF1B, TP53BP1, TPM2, TRA@, TRAF3, TRAF5, TRIP10, TSPAN3, TUBA4A, VCAN, ZNF384 |
| Continued | ||
Tumor tissues
Eight pairs of human PVTTs and Ts were obtained from HCC patients who underwent curative resection in the Eastern Hepatobiliary Surgery Hospital (Shanghai, China) after obtaining informed consent. All 8 pairs of PVTTs and Ts were used to perform real-time polymerase chain reaction (PCR) analysis. The study was approved by the Ethics Committee of Eastern Hepatobiliary Surgery Hospital.
Quantitative real-time PCR
Total RNA was isolated using TRIzol reagent (Invitrogen, CA, USA), and reverse-transcription (RT) was performed using the PrimeScript RT Reagent Kit (Takara, Kusatsu, Japan), according to manufacturer’s instructions. Real-time PCR was performed with SYBR Premix Ex Taq (Takara, Kusatsu, Japan) using the StepOnePlus Real-Time PCR System (Applied Biosystems, CA, USA). The primers used are listed in Supplementary Table S2. The gene expression levels were calculated relative to the expression of β-actin.
S2.
The primer sequence used in Real-time PCR
| Gene symbol | Sequence (5′ → 3′) | |
| RNF14 | Forward Primer | ACTTTGTGCAGGTTGACCTAC |
| Reverse Primer | CGCTTGCAGGTATTCATTTCGTA | |
| GABRA1 | Forward Primer | AGCCGTCATTACAAGATGAACTT |
| Reverse Primer | TGGTCTCAGGCGATTGTCATAA | |
| NDST1 | Forward Primer | CTGCCTGTTCAGCGTTTTCAT |
| Reverse Primer | CGAGTAGAGGCTCTCCACAAA | |
| FBXW11 | Forward Primer | GGAACATCATCTGTGATCGTCTC |
| Reverse Primer | TGGTAAAGCGGTAATAAAGTCCC | |
| TJP1 | Forward Primer | CAACATACAGTGACGCTTCACA |
| Reverse Primer | CACTATTGACGTTTCCCCACTC | |
| HSPA9 | Forward Primer | CTTGTTTCAAGGCGGGATTATGC |
| Reverse Primer | GCAGGAGTTGGTAGTACCCAAA | |
| CLINT1 | Forward Primer | CGAGAGGCAACGAACGATGAT |
| Reverse Primer | CCTTATGAGGTAAGCTAGGAGCA | |
| THBS4 | Forward Primer | TGCTGCCAGTCCTGACAGA |
| Reverse Primer | GTTTAAGCGTCCCATCACAGTA | |
| GABRG2 | Forward Primer | ACTTCGGCCTGATATAGGAGTG |
| Reverse Primer | ACGTCTGTCATACCACGTTTG | |
| FGF1 | Forward Primer | GACAGGAGCGACCAGCACATTC |
| Reverse Primer | TCCAGCCTTTCCAGGAACAAACATT | |
| APC | Forward Primer | AAAATGTCCCTCCGTTCTTATGG |
| Reverse Primer | CTGAAGTTGAGCGTAATACCAGT | |
| SAR1B | Forward Primer | TACAGTGGTTTCAGCAGTGTG |
| Reverse Primer | AGTGGGATGTAATGTTGGGACA | |
| GRIA1 | Forward Primer | TGGGTTTTATGAACGTAGGACTG |
| Reverse Primer | AAAGCTCGGCGTAATGAAGCA | |
| FGF18 | Forward Primer | ACTTGCCTGTGTTTACACTTCC |
| Reverse Primer | GACCTGGATGTGTTTCCCACT | |
| ACTC1 | Forward Primer | TCCCATCGAGCATGGTATCAT |
| Reverse Primer | GGTACGGCCAGAAGCATACA | |
| F2RL1 | Forward Primer | CAGTGGCACCATCCAAGGAA |
| Reverse Primer | CAGGGCCATGCCGTTACTT | |
| GABRB3 | Forward Primer | GATAAAAGGCTCGCCTATTCTGG |
| Reverse Primer | GATCATGCGGTTTTTCACTGTC | |
| CHST14 | Forward Primer | CGCCACATCCTCGTAAGTGAC |
| Reverse Primer | CCCGCTTCCAGTTAGAGCA | |
| ADRB2 | Forward Primer | TTGCTGGCACCCAATAGAAGC |
| Reverse Primer | CAGACGCTCGAACTTGGCA | |
| Continued | ||
Cluster analysis
All pairs of PVTT and Ts were classified using one minus Pearson correlation hierarchical cluster analysis by the 24-gene signatures (Morpheus). The 24 genes are listed in Supplementary Table S3.
S3.
The 24 genes set identifying pairs of PVTTs and Ts with no clonal relationship
| Gene symbol | Gene names |
| RNF14 | Ring finger protein 14 |
| GABRA1 | Gamma-aminobutyric acid type A receptor alpha1 subunit |
| NDST1 | N-deacetylase and N-sulfotransferase 1 |
| FBXW11 | F-box and WD repeat domain containing 11 |
| TJP1 | Tight junction protein 1 |
| HSPA9 | Heat shock protein family A (Hsp70) member 9 |
| CLINT1 | Clathrin interactor 1 |
| THBS4 | Thrombospondin 4 |
| GABRG2 | Gamma-aminobutyric acid type A receptor gamma2 subunit |
| FGF1 | Fibroblast growth factor 1 |
| APC | APC, WNT signaling pathway regulator |
| SAR1B | Secretion associated Ras related GTPase 1B |
| GRIA1 | Glutamate ionotropic receptor AMPA type subunit 1 |
| FGF18 | Fibroblast growth factor 18 |
| ACTC1 | Actin, alpha, cardiac muscle 1 |
| F2RL1 | F2R like trypsin receptor 1 |
| GABRB3 | Gamma-aminobutyric acid type A receptor beta 3 subunit |
| CHST14 | Carbohydrate sulfotransferase 14 |
| ADRB2 | Adrenoceptor beta 2 |
| OTUD7A | OUT deubiquitinase 7A |
| ADRA1B | Adrenoceptor alpha 1B |
| SYNPO | Synaptopodin |
| GABRG3 | Gamma-aminobutyric acid type A receptor gamma 3 subunit |
| OCLN | Occludin |
Statistical analysis
All P values and FDR values were obtained by the appropriate methods used in the different gene expression and enrichment analyses. Statistical analysis of the gene signature enrichment score from ssGSEA was not performed due to only one PVTT-T pair identified to have no clonal relationship.
Results
Analysis of the clonal relationship between PVTTs and corresponding primary Ts
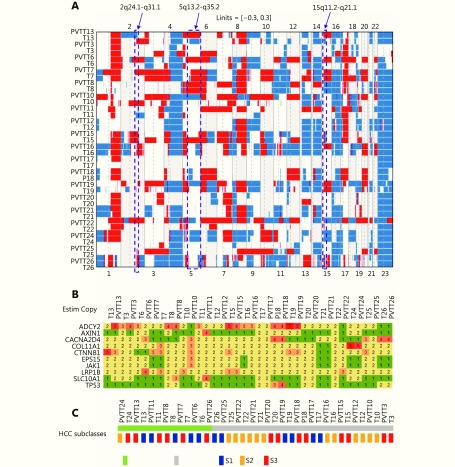
To investigate the clonal relationship of PVTTs with corresponding Ts, DNA copy number variation (CNV) profiles of 19 paired PVTTs and Ts were analyzed using the R package Clonality22. The clonal-relatedness of the paired tissues was evaluated according to the LR2 value. Overall, 18 out of 19 PVTT-T pairs showed a significantly higher LR2 value (P < 0.001), whereas only one pair (patient 13, P13) showed a much lower LR2 value ( P > 0.05) ( Table 1). As a low LR2 value indicates no clonal relatedness, PVTT13 was identified to have an independent clonal origin from T13, whereas the other PVTTs had a clonal origin from the corresponding Ts. For further verification, the CNV of the chromosome regions and genes was investigated using the R package DNA copy23. The DNA CNV patterns of chromosome regions were estimated based on the threshold values (threshold = 0.3). Aberrant chromosome regions showed very different CNV patterns between PVTT13 and T13, whereas these differences were not observed in other pairs (Figure 1A). The region of 2q24.1-q31.1 was deleted in PVTT13 but amplified in T13. Regions of 5q13.2-q35.2 and 15q11.2-q21.1 were amplified in PVTT13 but deleted in T13. These three chromosome regions displayed similar CNV patterns between PVTTs and Ts from other patients (Figure 1A). CNV analysis of genes showed that 10 HCC driver genes have different copy numbers between the PVTTs and Ts from individual patients (Figure 1B). Less than 3 different mutant genes were observed in most PVTT-T pairs (n = 15), whereas 3 or more different mutant genes were observed in pairs from patient 6 (P6), patient 11 (P11), P13, and patient 22 (P22) (Figure 1B). Among these 4 PVTT-T pairs with more than 2 mutant genes with different copy numbers, only the pair from P13 had 2 mutant genes, with 2 and 3 different copies. Five copies of ADCY2 and 3 copies of CTNNB1 were observed in PVTT13, whereas 2 copies of ADCY2 and 5 copies of CTNNB1 were observed in T13 (Figure 1B). Additionally, Hoshida S1-S2-S3 classes of the PVTTs and Ts were evaluated by NTP analysis using their gene expression profiles20. All PVTTs and Ts were classified into one of the Hoshida S1-S2-S3 classes (Bonferroni P = 0.019, FDR < 0.01, Figure 1C). Among the 19 PVTT-T pairs, 6 pairs including PVTT13-T13 had their PVTTs and Ts in different subclasses (Figure 1C). PVTT13 was classified into the S3 class, which is associated with hepatocyte differentiation, and T13 was classified into the S1 class, which reflects an aberrant activation of the Wnt-signaling pathway (Figure 1C). Collectively, these data indicated that PVTT13 and T13 had different origins and that some PVTTs may not originate from the primary Ts.
1.
Clonality analysis of PVTT and T (n = 19) according to copy number variations at the probe level
| T | PVTT | LR2* | P |
| *LR2, likelihood ratio 2, quantifies the odds that the two tissues are clonal; T, primary tumor; PVTT, portal vein tumor thrombus. | |||
| T3 | PVTT3 | 48890042738 | 0 |
| T6 | PVTT6 | 3965105136 | 0 |
| T7 | PVTT7 | 1.27E+20 | 0 |
| T8 | PVTT8 | 1.21E+43 | 0 |
| T10 | PVTT10 | 7.68E+12 | 0 |
| T11 | PVTT11 | 43403254817 | 0 |
| T12 | PVTT12 | 4.67E+26 | 0 |
| T13 | PVTT13 | 0.005090782 | 0.201316 |
| T15 | PVTT15 | 1.49E+36 | 0 |
| T16 | PVTT16 | 2.73E+23 | 0 |
| T17 | PVTT17 | 1.68E+16 | 0 |
| T18 | PVTT18 | 3.61E+29 | 0 |
| T19 | PVTT19 | 1.64E+20 | 0 |
| T20 | PVTT20 | 1.75E+33 | 0 |
| T21 | PVTT21 | 6.16E+17 | 0 |
| T22 | PVTT22 | 9461268136 | 0 |
| T24 | PVTT24 | 1.07E+32 | 0 |
| T25 | PVTT25 | 2.10E+13 | 0 |
| T26 | PVTT26 | 3.81E+43 | 0 |
1.
Analysis of the clonal relationship between PVTTs and corresponding primary Ts.
Analysis of aberrantly expressed genes in PVTT13
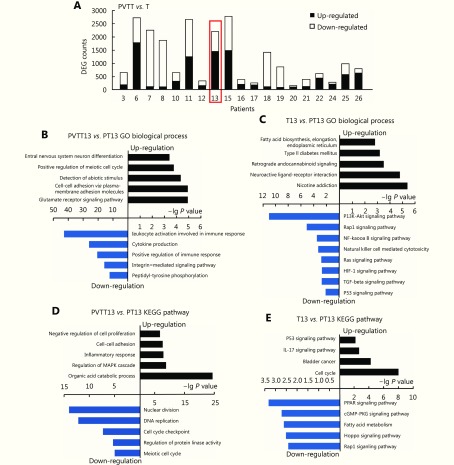
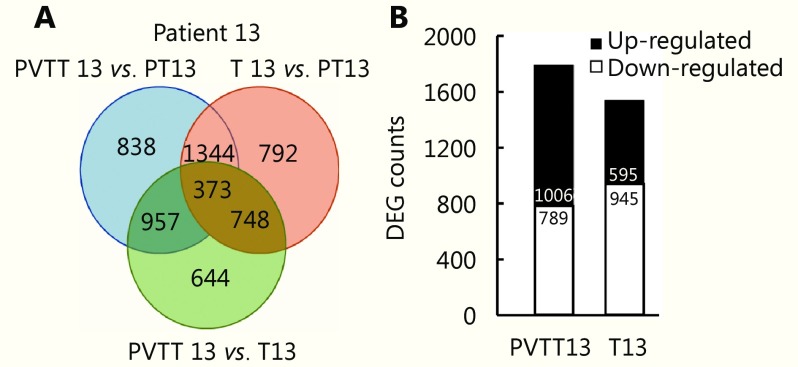
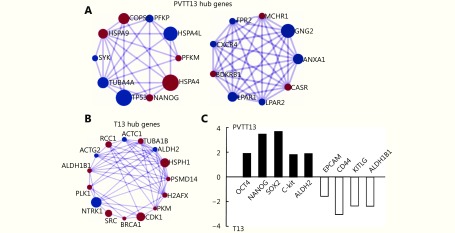
To investigate aberrantly expressed genes in PVTTs and Ts, EBSeq was used to analyze the differently expressed genes (DEGs) between PVTTs, Ts, and parenchyma tumor tissue (PT) from individual patients. Gene expression profiles of these tissues (RNA-seq, GSE77509) were downloaded from the GEO database. Genes with fold change > 3 and FDR < 0.05 were identified as having significantly different expression. More than 2,000 DEGs were observed in 5 PVTT-T pairs including P13, whereas less than 1,000 DEGs were observed in the other pairs ( Figure 2A). The Venn diagram in Supplementary Figure S1A shows that 512 and 3,257 DEGs were identified in PVTT13 and T13 compared with PT13, respectively. Among these 1,795 DEGs, 1,006 upregulated and 789 downregulated genes were identified as genes with specifically aberrant expression in PVTT13, and 1,540 DEGs with 595 upregulated and 945 downregulated genes were identified as genes with specifically aberrant expression in T13 (Supplementary Figure S1B). GO analysis showed that upregulated DEGs in PVTT13 were enriched in 15 biological processes (BPs) including the glutamate receptor signaling pathway, cell adhesion, and cell cycle (Figure 2B, Supplementary Table S4). Downregulated DEGs in PVTT13 were enriched in 16 BPs, including positive regulation of immune response, cytokine production, and peptidyl-tyrosine phosphorylation (Figure 2B, Supplementary Table S4). Upregulated DEGs in T13 were enriched in 15 BPs, including nuclear division, cell cycle checkpoints, and regulation of protein kinase activity (Figure 2C, Supplementary Table S4). Downregulated DEGs in T13 were enriched in 17 BPs, including inflammatory response, cell-cell adhesion, and negative regulation of cell proliferation (Figure 2C, Supplementary Table S4). KEGG enrichment analysis showed that upregulated DEGs in PVTT13 were enriched in pathways for nicotine addiction and type II diabetes mellitus, and The downregulated DEGs were enriched in signaling pathways, mainly PI3K-Akt, TGF-β, and p53 signaling (Figure 2D, Supplementary Table S4). The upregulated DEGs in T13 were enriched in signaling pathways, such as IL-17, p53 and cell cycle signaling, and the downregulated DEGs in T13 were enriched in signaling pathways including cGMP-PKG, Hippo and Rap1 (Figure 2E, Supplementary Table S4). The GO and KEGG analyses showed that DEGs in PVTT13 and T13 were enriched in different BPs and pathways. These data suggest that PVTT13 and T13 were different tumor types and that different mechanisms were involved in PVTT13 and T13 development.
2.
Analysis of aberrantly expressed genes in PVTT13 and T13.
S1.
Analysis of aberrantly expressed genes in PVTT13 and T13.(A) Venn diagram of differently expressed genes between PVTT13, T13 and PT13. Genes with fold change>3 and FDR < 0.05 were identified as differently expressed between tissues.(B) Number of genes aberrantly expressed specifically in PVTT13 and T13. Up-regulation and down-regulation of genes was estimated relatively to the expression in PT13.
S4.
KEGG pathways and GO biological processes enriched in PVTT13 and T13. Only KEGG pathways were displayed. The full Table S4 can be found in the online version of this article
| Up-regulated pathways in PVTT13 | ||||||
| Pathway ID | Description | % | type | Count | P Value | genes |
| hsa05033 | Nicotine addiction | 1 | up | 10 | 3.98E-06 | CACNA1B, GABRA1, GABRA4, GABRG2, GABRG3, GABRR1, GRIA1, GRIA4, GRIN2B, SLC17A6 |
| hsa04080 | Neuroactive ligand-receptor interaction | 2.8 | up | 28 | 1.58E-05 | ADRA2C, AVPR1B, BDKRB1, CHRNB3, CRHR2, GABRA1, GABRA4, GABRG2, GABRG3, GABRR1, GLP1R, GLRA1, MCHR1, GRIA1, …… |
| hsa04723 | Retrograde endocannabinoid signaling | 1.3 | up | 13 | 0.00031623 | ADCY2, CACNA1B, GABRA1, GABRA4, GABRG2, GABRG3, GABRR1, GRIA1, GRIA4, KCNJ9, RIMS1, PLCB1, SLC17A6 |
| hsa04930 | Type II diabetes mellitus | 0.81 | up | 8 | 0.00063096 | CACNA1B, CACNA1E, IKBKB, KCNJ11, PKLR, ABCC8, ADIPOQ, MAFA |
| hsa04727 | GABAergic synapse | 1.1 | up | 11 | 0.001 | ADCY2, CACNA1B, GABRA1, GABRA4, GABRG2, GABRG3, GABRR1, GAD2, HAP1, GABBR2, SLC12A5 |
| hsa_M00415 | Fatty acid biosynthesis, elongation, endoplasmic reticulum | 0.41 | up | 4 | 0.00158489 | HACD3, ELOVL2, ELOVL7, HACD2 |
| hsa05032 | Morphine addiction | 1.1 | up | 11 | 0.00158489 | ADCY2, CACNA1B, GABRA1, GABRA4, GABRG2, GABRG3, GABRR1, KCNJ9, OPRM1, PDE1C, GABBR2 |
| hsa04724 | Glutamatergic synapse | 1.2 | up | 12 | 0.00316228 | ADCY2, GRIA1, GRIA4, GRIN2B, GRM3, GRM4, SLC1A6, HOMER1, PLCB1, SLC17A6, PLA2G4E, PLA2G4D |
| hsa00564 | Glycerophospholipid metabolism | 1 | up | 10 | 0.00630957 | CDS1, PLA2G1B, DGKI, LPGAT1, LYPLA1, AGPAT4, GPAM, PLA2G2F, PLA2G4E, PLA2G4D |
| hsa04911 | Insulin secretion | 0.91 | up | 9 | 1.00E-02 | ADCY2, GCG, GLP1R, KCNJ11, KCNN1, ABCC8, RIMS2, PLCB1, KCNU1 |
| Dwon-regulated pathways in PVTT13 | ||||||
| Pathway ID | Description | % | type | Count | P Value | genes |
| hsa04380 | Osteoclast differentiation | 4 | down | 31 | 1.00E-18 | ACP5, BTK, CSF1R, CYBB, FCGR1A, FCGR3A, FCGR3B, IL1R1, ITGB3, JUNB, LCP2, NCF4, PIK3CD, SPI1, SYK, TGFB1, FOSL1, SOCS1, …… |
| hsa04151 | PI3K-Akt signaling pathway | 5.1 | down | 40 | 1.00E-11 | CCND3, COL4A3, COL6A1, COL6A2, COL6A3, COL9A2, CSF1R, CSF3, CSF3R, LPAR1, FGF2, FGF7, FGF9, NR4A1, TNC, IGF1R, IL2RG, IL6, …… |
| hsa05144 | Malaria | 1.9 | down | 15 | 1.00E-11 | CR1, CSF3, GYPC, HBA1, HBA2, HBB, IL6, IL18, ITGB2, TGFB1, TGFB3, THBS1, THBS2 |
| hsa04062 | Chemokine signaling pathway | 3.5 | down | 27 | 1.00E-10 | ADCY7, CXCR5, CCR1, CCR5, CCR6, DOCK2, PTK2B, FGR, CXCL2, HCK, CXCR1, CXCR2, JAK2, PIK3CD, PLCB2, PRKCB, RAC2, CCL11, VAV1, …… |
| hsa04512 | ECM-receptor interaction | 2.3 | down | 18 | 1.58E-10 | CD44, COL4A3, COL6A1, COL6A2, COL6A3, COL9A2, TNC, ITGA4, ITGB3, ITGB4, ITGB7, ITGB8, RELN, THBS1, THBS2, ITGA8, GP6, LAMA1 |
| hsa05152 | Tuberculosis | 3.3 | down | 26 | 2.51E-10 | CD14, PLK3, CR1, CTSS, FCER1G, FCGR1A, FCGR3A, FCGR3B, IL6, IL10RA, IL18, ITGB2, JAK2, LSP1, SYK, TGFB1, TGFB3, TLR1, TLR2, TLR4, …… |
| Continued | ||||||
Enrichment of hepatocyte gene signature in PVTT13
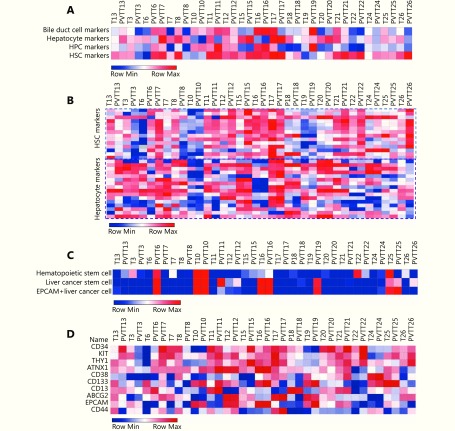
To further investigate the independent origin of PVTT13, enrichment of the gene signatures of the main cell types in liver tissues were analyzed using ssGSEA. The gene signatures of bile duct cells (BDCs), hepatocytes, hepatic progenitor cells (HPCs), and hepatic stellate cells (HSCs) were included due to their potential role in liver cancer24.
The hepatocyte gene signature showed higher enrichment value in PVTT13 (7223.62) than that in T13 (5985.81), and the HPC gene signature showed lower enrichment value in PVTT13 (2608.81) than that in T13 (3212.07) (Figure 3A). Differences in the BDC and HSC gene signature enrichment values were not observed between PVTT13 and T13 (Figure 3A), whereas other PVTT-T pairs showed similar gene signature enrichment (Figure 3A). Further gene expression analysis showed a higher expression of hepatocyte-specific genes and lower expression of HSC-specific genes in PVTT13 than in T13 (Figure 3B). In addition, previous reports suggest that cancer stem cells (CSCs) and hematopoietic stem cells may be involved in PVTT development8,12. Our findings show that gene markers of these cells, such as NANOG and C-kit, were the nodes of the gene network or aberrantly expressed in PVTT13, further consolidating their potential roles in PVTT development (Supplementary Figure S2). Therefore, enrichment of gene signatures of hematopoietic stem cells and liver cancer stem cells were also investigated. A higher enrichment value of hematopoietic stem cell gene signatures was observed in PVTT13 (3114.07) than in T13 (1031.52), whereas a lower enrichment value of the EpCAM+ liver cancer cell gene signature was observed in PVTT13 (–315.38) than in T13 (1401.61) (Figure 3C). Most PVTTs and Ts, except for PVTT6, PVTT11, PVTT19, T22, and pairs of P10, P16, and P25, had no enrichment of these signatures (Figure 3C). Gene expression analysis showed a higher expression of hematopoietic stem cell-specific genes, such as CD34 and KIT, and a lower expression of EpCAM+ liver cancer cell-specific genes, such as EpCAM and CD44 in PVTT13 (Figure 3D). These data suggested that PVTT13 expressed high levels of hepatocyte- and hematopoietic stem cell-specific genes, and that these two cell types may be involved in PVTT13 development.
3.
Enrichment analysis of gene signatures in PVTTs and Ts.
S2.
Hub genes and expression of cancer stem cell genes in PVTT13 and T13. (A) Hub genes (degree > 40) in PVTT13 found by PPI analysis using DEGs between PVTT13 and PT13. (B) Hub genes (degree > 50) in T13 found by PPI analysis using DEGs between T13 and PT13. Genes with degree higher than 50 were displayed. PPI analysis was performed using metascape database, and the result was viewed using Cytoscape 3.4. (C) Expression of cancer stem cell markers in PVTT13 relative with T13. FDR < 0.05; FC, fold change.
Gene signatures identifying PVTTs with no clonal relatedness with Ts
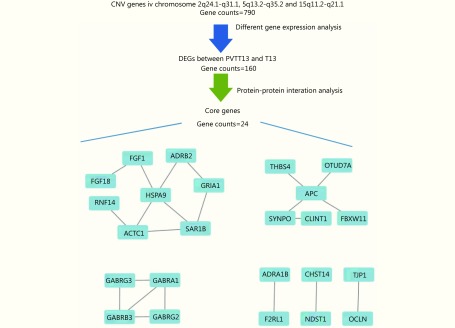
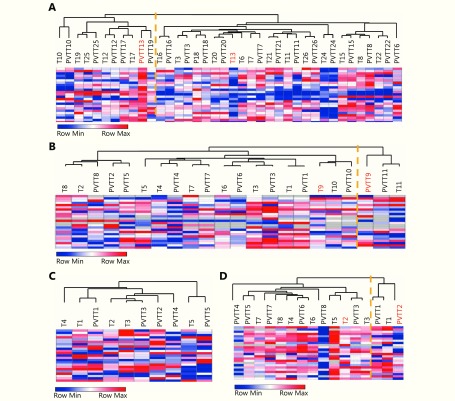
Having found that some PVTTs had no clonal relatedness with the corresponding Ts and that they have unique gene expression profiles, gene signatures identifying whether PVTTs have clonal relatedness with Ts may be very helpful for PVTT treatment. An integration analysis of CNV and gene expression profiles showed that 160 genes have differentially expressed copy number variations between PVTT13 and T13 (Supplementary Figure S3). The following PPI analysis found 24 genes to be the nodes in the network, suggesting that they may have crucial roles in PVTT13 development (Supplementary Figure S3). The ability of the 24-gene signature to identify PVTTs and Ts with no clonal relatedness was validated using three publicly available datasets with unsupervised clustering. In the dataset GSE77509, which includes 19 pairs of PVTT and Ts, the 24-gene signature classified PVTT13 and T13 into two different groups and classified other PVTTs and Ts from the same patient into the same group (Figure 4A). In the dataset GSE69164, including 11 pairs of PVTTs and Ts, PVTT9 and T9 were classified into two different groups, whereas other PVTTs and Ts from an individual patient were classified into the same group (Figure 4B). In the dataset GSE74656, which includes 5 pairs of PVTTs and Ts, all the PVTTs and Ts from an individual patient were classified into the same group (Figure 4C). In addition, the ability of the 24-gene signature to identify clonal relatedness was also validated using newly collected samples (n = 8). PVTT and T from patient 2 were, however, classified into two different groups (Figure 4D). All these data indicated that the 24-gene signature may be used to identify PVTTs and Ts with no clonal relatedness.
S3.
Analysis of differently expressed genes between PVTT13 and T13. 790 genes were found located in Chromosome regions with CNV. 160 out of these genes were found differently expressed between PVTT13 and T13. 24 DEGs were found to be node genes in the gene network established by PPI analysis.
4.
Validation of identification ability of 24-gene signature
Discussion
In the present study, we found that PVTTs may have a different clonal origin than that of the corresponding HCC Ts. These types of PVTTs have different gene expression profiles from those of the corresponding Ts, whereas PVTTs originating from primary Ts have similar gene expression profiles to those of their origin Ts tissues. Previous studies reported the involvement of several factors, such as hypoxia and non-coding RNA in PVTT development, and similar gene expression profiles of PVTTs with Ts7-10, suggesting that PVTT may be a special type of HCC intrahepatic metastasis. Here, the clonality analysis, which was established to identify paired Ts with clonal origin, was applied to investigate the clonal relationship between PVTTs and Ts. Based on the clonality analysis and 24-gene signature identification, we found that most of the PVTTs (18 out of 19 in GSE77509, 10 out of 11 in GSE69164, and all 5 of GSE74656) possibly originate from the paired Ts (Table 1, Figure 4). Additionally, we also found another type of PVTTs, which received a very low LR2 value in the clonality analysis and were classified into a different group with the paired Ts in the cluster analysis (Table 1, Figure 4). These types of PVTTs were considered to represent tumor tissues having a different clonal origin than that of the paired Ts. These findings suggest the existence of two types of PVTTs according to their clonal origin, wherein one type has the same origin as the paired Ts and the other does not. Moreover, our findings can explain why PVTTs were observed in some patients without liver parenchyma tumor nodules13. The results can also explain why PVTTs from different patients showed very different gene expression profiles11. Of note is the observation that different CNV patterns were observed between PVTT13 and T13. These CNVs may be caused by gene translocation or genomic instability in the tumor cells. Genes transfer onto other chromosomes or extrachromosomal DNA (ecDNA) is amplified in tumor cells25. Genomic instability is a well-known characteristic of tumor cells, inducing alterations in the genomes26. Hepatitis virus infection is another important factor that causes genomic instability in HCC27. Hence, the mechanism underlying the different CNV patterns between PVTTs and Ts needs more investigation.
Our study suggests that integrated analysis of the published datasets provides a better understanding of Ts, and that such analyses may lead to improved therapeutic strategies. With the development of high-throughput technology and multi-omics analyses, increasingly more omics data from Ts are uploaded into the public databases such as GEO and The Cancer Genome Atlas (TCGA)28. An integrated analysis of these datasets makes it possible to obtain a more comprehensive understanding of Ts at multidimensional levels. The comprehensive integrated analysis of HCC using six distinct data platforms determined subtypes of HCC associated with poorer prognosis, and the gene expression signatures correlated with poor survival and potential therapeutic targets for HCC29. Another multiplatform integrative analysis based on TCGA found that molecular signatures provide a higher accuracy for the clinical outcome prediction than that of the currently used tissue-of-origin-based classification in some cases30. By integrated analysis of CNV and gene expression profiles previously used to investigate aberrantly expressed lncRNAs11, we analyzed the origin of PVTTs and developed a gene signature to identify the type of PVTTs. It has been reported that the “cell-of-origin”-based features mainly dominate the molecular taxonomy of tumor types30. Therefore, the gene signatures developed in our study may provide a platform for a high-accuracy identification of PVTTs with independent origins. However, follow-up studies and additional samples are necessary to validate the findings reported here.
Acknowledgements
This work was supported by grants of China National Funds for Distinguished Young Scientists (Grant No. 81425019), National Natural Science Foundation of China (Grant No. 81672899), the State Key Program of National Natural Science Foundation of China (Grant No. 81730076), Shanghai Science and Technology Committee Program (Grant No. 18XD1405300) and Specially-Appointed Professor Fund of Shanghai (Grant No. GZ2015009).
Conflict of interest statement
No potential conflicts of interest are disclosed.
References
- 1.Zhang ZM, Lai ECH, Zhang C, Yu HW, Liu Z, Wan BJ, et al The strategies for treating primary hepatocellular carcinoma with portal vein tumor thrombus. Int J Surg. 2015;20:8–16. doi: 10.1016/j.ijsu.2015.05.009. [DOI] [PubMed] [Google Scholar]
- 2.Kokudo T, Hasegawa K, Matsuyama Y, Takayama T, Izumi N, Kadoya M, et al Survival benefit of liver resection for hepatocellular carcinoma associated with portal vein invasion. J Hepatol. 2016;65:938–43. doi: 10.1016/j.jhep.2016.05.044. [DOI] [PubMed] [Google Scholar]
- 3.Sakamoto K, Nagano H Surgical treatment for advanced hepatocellular carcinoma with portal vein tumor thrombus. Hepatol Res. 2017;47:957–62. doi: 10.1111/hepr.v47.10. [DOI] [PubMed] [Google Scholar]
- 4.Bruix J, Sherman M Management of hepatocellular carcinoma: an update. Hepatology. 2011;53:1020–2. doi: 10.1002/hep.24199. [DOI] [PMC free article] [PubMed] [Google Scholar]
- 5.Cheng SQ, Chen MS, Cai JQ, National Research Cooperative Group for Diagnosis, Treatment of Hepatocellular Carcinoma with Tumor Thrombus Chinese expert consensus on multidisciplinary diagnosis and treatment of hepatocellular carcinoma with portal vein tumor thrombus: 2016 edition. Oncotarget. 2017;8:8867–76. doi: 10.18632/oncotarget.12817. [DOI] [PMC free article] [PubMed] [Google Scholar]
- 6.Tang YF, Liu SP, Li N, Guo WX, Shi J, Yu HM, et al 14-3-3ζ promotes hepatocellular carcinoma venous metastasis by modulating hypoxia-inducible factor-1α. Oncotarget. 2016;7:15854–67. doi: 10.18632/oncotarget.7493. [DOI] [PMC free article] [PubMed] [Google Scholar]
- 7.Ye LY, Chen W, Bai XL, Xu XY, Zhang Q, Xia XF, et al Hypoxia-induced epithelial-to-mesenchymal transition in hepatocellular carcinoma induces an immunosuppressive tumor microenvironment to promote metastasis. Cancer Res. 2016;76:818–30. doi: 10.1158/0008-5472.CAN-15-0977. [DOI] [PubMed] [Google Scholar]
- 8.Zhang J, Pan YF, Ding ZW, Yang GZ, Tan YX, Yang C, et al Rmp promotes venous metastases of hepatocellular carcinoma through promoting il-6 transcription. Oncogene. 2015;34:1575–83. doi: 10.1038/onc.2014.84. [DOI] [PubMed] [Google Scholar]
- 9.Guo WX, Liu SP, Cheng YQ, Lu L, Shi J, Xu GX, et al ICAM-1-related noncoding rna in cancer stem cells maintains ICAM-1 expression in hepatocellular carcinoma. Clin Cancer Res. 2015;22:2041–50. doi: 10.1158/1078-0432.CCR-14-3106. [DOI] [PubMed] [Google Scholar]
- 10.Ye QH, Qin LX, Forgues M, He P, Kim JW, Peng AC, et al Predicting hepatitis B virus-positive metastatic hepatocellular carcinomas using gene expression profiling and supervised machine learning. Nat Med. 2003;9:416–23. doi: 10.1038/nm843. [DOI] [PubMed] [Google Scholar]
- 11.Yang Y, Chen L, Gu J, Zhang HS, Yuan JP, Lian QY, et al Recurrently deregulated lncRNAs in hepatocellular carcinoma. Nat Commun. 2017;8:14421. doi: 10.1038/ncomms14421. [DOI] [PMC free article] [PubMed] [Google Scholar]
- 12.Guo WX, Xue J, Shi J, Li N, Shao Y, Yu XY, et al Proteomics analysis of distinct portal vein tumor thrombi in hepatocellular carcinoma patients. J Proteome Res. 2010;9:4170–5. doi: 10.1021/pr100412w. [DOI] [PubMed] [Google Scholar]
- 13.Saito M, Seo Y, Yano Y, Uehara K, Hara S, Momose K, et al Portal venous tumor growth-type of hepatocellular carcinoma without liver parenchyma tumor nodules: a case report. Ann Hepatol. 2013;12:969–73. [PubMed] [Google Scholar]
- 14.Zhang H, Ye JY, Weng XL, Liu FT, He L, Zhou DZ, et al Comparative transcriptome analysis reveals that the extracellular matrix receptor interaction contributes to the venous metastases of hepatocellular carcinoma. Cancer Genet. 2015;208:482–91. doi: 10.1016/j.cancergen.2015.06.002. [DOI] [PubMed] [Google Scholar]
- 15.Nemes S, Danielsson A, Parris TZ, Jonasson JM, Bülow E, Karlsson P, et al A diagnostic algorithm to identify paired tumors with clonal origin. Genes Chromosomes Cancer. 2013;52:1007–16. doi: 10.1002/gcc.22096. [DOI] [PubMed] [Google Scholar]
- 16.Haffner MC, Mosbruger T, Esopi DM, Fedor H, Heaphy CM, Walker DA, et al Tracking the clonal origin of lethal prostate cancer. J Clin Invest. 2013;123:4918–22. doi: 10.1172/JCI70354. [DOI] [PMC free article] [PubMed] [Google Scholar]
- 17.Tripathi S, Pohl MO, Zhou YY, Rodriguez-Frandsen A, Wang GJ, Stein DA, et al Meta- and orthogonal integration of influenza "OMICs" data defines a role for UBR4 in virus budding. Cell Host Microbe. 2015;18:723–35. doi: 10.1016/j.chom.2015.11.002. [DOI] [PMC free article] [PubMed] [Google Scholar]
- 18.Reich M, Liefeld T, Gould J, Lerner J, Tamayo P, Mesirov JP Genepattern 2.0. Nat Genet. 2006;38:500–1. doi: 10.1038/ng0506-500. [DOI] [PubMed] [Google Scholar]
- 19.Ceulemans A, Verhulst S, Van Haele M, Govaere O, Ventura JJ, Van Grunsven LA, et al Rna-sequencing-based comparative analysis of human hepatic progenitor cells and their niche from alcoholic steatohepatitis livers. Cell Death Dis. 2017;8:e3164. doi: 10.1038/cddis.2017.543. [DOI] [PMC free article] [PubMed] [Google Scholar]
- 20.Hoshida Y, Nijman SMB, Kobayashi M, Chan JA, Brunet JP, Chiang DY, et al Integrative transcriptome analysis reveals common molecular subclasses of human hepatocellular carcinoma. Cancer Res. 2009;69:7385–92. doi: 10.1158/0008-5472.CAN-09-1089. [DOI] [PMC free article] [PubMed] [Google Scholar]
- 21.Sia D, Jiao Y, Martinez-Quetglas I, Kuchuk O, Villacorta-Martin C, Castro De Moura M, et al Identification of an immune-specific class of hepatocellular carcinoma, based on molecular features. Gastroenterology. 2017;153:812–26. doi: 10.1053/j.gastro.2017.06.007. [DOI] [PMC free article] [PubMed] [Google Scholar]
- 22.Song FF, Li XC, Song FJ, Zhao YR, Li HX, Zheng H, et al Comparative genomic analysis reveals bilateral breast cancers are genetically independent. Oncotarget. 2015;6:31820–9. doi: 10.18632/oncotarget.5569. [DOI] [PMC free article] [PubMed] [Google Scholar]
- 23.Venkatraman ES, Olshen AB A faster circular binary segmentation algorithm for the analysis of array CGH data. Bioinformatics. 2007;23:657–63. doi: 10.1093/bioinformatics/btl646. [DOI] [PubMed] [Google Scholar]
- 24.Sia D, Villanueva A, Friedman SL, Llovet JM Liver cancer cell of origin, molecular class, and effects on patient prognosis. Gastroenterology. 2017;152:745–61. doi: 10.1053/j.gastro.2016.11.048. [DOI] [PMC free article] [PubMed] [Google Scholar]
- 25.Turner KM, Deshpande V, Beyter D, Koga T, Rusert J, Lee C, et al Extrachromosomal oncogene amplification drives tumour evolution and genetic heterogeneity. Nature. 2017;543:122–5. doi: 10.1038/nature21356. [DOI] [PMC free article] [PubMed] [Google Scholar]
- 26.Hanahan D, Weinberg RA Hallmarks of cancer: the next generation. Cell. 2011;144:646–74. doi: 10.1016/j.cell.2011.02.013. [DOI] [PubMed] [Google Scholar]
- 27.Wang M, Xi D, Ning Q Virus-induced hepatocellular carcinoma with special emphasis on HBV. Hepatol Int. 2017;11:171–80. doi: 10.1007/s12072-016-9779-5. [DOI] [PubMed] [Google Scholar]
- 28.Tomczak K, Czerwińska P, Wiznerowicz M The cancer genome atlas (TCGA): an immeasurable source of knowledge. Contemp Oncol. 2015;19:A68–77. doi: 10.5114/wo.2014.47136. [DOI] [PMC free article] [PubMed] [Google Scholar]
- 29.The Cancer Genome Atlas Research Network Comprehensive and integrative genomic characterization of hepatocellular carcinoma. Cell. 2017;169:1327–1341.e23. doi: 10.1016/j.cell.2017.05.046. [DOI] [PMC free article] [PubMed] [Google Scholar]
- 30.Hoadley KA, Yau C, Wolf DM, Cherniack AD, Tamborero D, Ng S, et al Multiplatform analysis of 12 cancer types reveals molecular classification within and across tissues of origin. Cell. 2014;158:929–44. doi: 10.1016/j.cell.2014.06.049. [DOI] [PMC free article] [PubMed] [Google Scholar]


